America s New Urban and Regional Demographics
|
|
|
- Cora Adams
- 5 years ago
- Views:
Transcription

1 America s New Urban and Regional Demographics William H. Frey Metropolitan Policy Program-The Brookings Institution Population Studies Center-The University of Michigan
2 * Population and Migration Trends * Race and Ethnic Shifts * Aging and Younging
3 State Growth, Below 0% 0% -4% 5% - 9% 10% - 20% 20% +
4 Growth Rates for and Northeast Midwest South West
5 Medium NE Metro Growth, A l a s k a 1 Allentown 10.9% 2 Lancaster 10.4% 3 Harrisburg 7.9% 4 Poughkeepsie 7.8% 5 Worcester 6.3% 6 New Haven 4.7% 7 Bridgeport 3.9% 8 Syracuse 1.9% 9 Springfield 1.9% 10 Scranton.5%
6 Melting Pot, New Sunbelt and Heartland States Melting Pot New Sunbelt Heartland
7 Share of U.S. in Melting Pot States Native Born 37% Foreign Born 66% Spanish at Home 72% Asian Language at Home 65%
8 Demographic Components, (Rates per 1000) Melting Pot New Sunbelt Heartland Immigratio n Domestic Migration


9 Domestic Migration Magnets, Phoenix 530,579 2 Riverside, CA 457,430 3 Atlanta 412,832 4 Dallas 307,907 5 Las Vegas 299,027 6 Tampa 254,650 7 Charlotte 243,399 8 Houston 242,573
10 Immigrant Magnet Metros, New York 1,079,016 2 Los Angeles 803,614 3 Miami 506,423 4 Chicago 363,134 5 Dallas 323,941 6 Washington DC 310,222 7 Houston 289,648 8 San Francisco 257,318


11 Greatest Domestic Out-Migration, New York -1,920,745 2 Los Angeles -1,337,522 3 Chicago -547,430 4 Detroit -361,632 5 San Francisco -343,834 6 New Orleans - 298,721 7 Miami -284,860 8 San Jose -233,133
12 Demographic Components, (Rates per 1000) New York Boston Philadelphia Immigration Domestic Migration
13 Demographic Components, (Rates per 1000) Immigration Domestic Migration Allentown Worcester Syracuse
14 Migration Slowdown to *

15 College Graduates (age 25+) Rates of Migration to Source: W. Frey analysis of US Census Bureau Current Population Survey Annual Social and Economic Supplement

16 Intercounty Reasons for Move: Employment vs Housing Source: W. Frey analysis of US Census Bureau Current Population Survey Annual Social and Economic Supplement
17 California versus Mountain West Annual Net Domestic Migration California Mountain West
18 New York versus Florida Annual Net Domestic Migration New York Florida
19 Top Metro Net Migration Gainers, Rank Metro Net Mig 1 Phoenix 98,789 2 Riverside 72,341 3 Tampa 51,985 4 Orlando 51,826 5 Atlanta 51,305 6 Las Vegas 39,331
20 New and Old Net Migration Gainers, Rank Metro Net Mig 1 Houston 49,662 2 Dallas 45,241 3 Austin 25,654 4 Raleigh 20,095 5 Denver 19,831 6 Charlotte 19,211 9 Atlanta 17, Phoenix 12, Tampa 4, Riverside Las Vegas -1, Orlando -4,279
21 Florida Metro Areas Annual Net Migration ,000 50,000 40,000 30,000 20,000 10, , Orlando Tampa Jacksonville
22 Metro Phoenix Domestic and International Migration Domestic International
23 Texas Metro Areas Annual Net Migration ,000 80,000 60,000 40,000 20, , Dallas Houston Austin
24 Annual Population Growth, Urban, Suburban, Exurban Urban Suburban Exurban
25 Race Ethnic Shares 2010 Population Growth White Black Am Indian Asian Hawaii Othr Race 2+ Races Hispanic
26 Race Ethnic Profiles of Regions 2010 Melting Pot New Sunbelt Heartland 12% 28% 4% 3% 3% 6% 2% 12% 51% 14% 3% 7% 11% 67% 77% White Black Asian Other Hispanic
27 Greatest Immigrant Growth Alabama South Carolina Tennessee Arkansas Kentucky North Carolina South Dakota Georgia
28 Hispanic Concentrations 2010 Percent of County Population Data source: William H. Frey analysis of Census2010
29 Greatest Hispanic Growth Rates State Growth 1 South Carolina 148% 2 Alabama 145% 3 Tennessee 134% 4 Kentucky 122% 5 Arkansas 114% 6 North Carolina 111% 7 Maryland 106% 8 Mississippi 106%
30 Asian Concentrations 2010 Percent of County Population Data source: William H. Frey analysis of Census2010

31 Greatest Asian Growth Rates State Growth 1 Nevada 116% 2 North Dakota 92% 3 Arizona 91% 4 North Carolina 84% 5 Georgia 82% 6 Arkansas 79% 7 New Hampshire 79% 8 Delaware 76%
32 Black Concentrations 2010 Percent of County Population Data source: William H. Frey analysis of Census2010

33 Largest Black Gains State Gains 1 Florida 586,832 2 Georgia 579,335 3 Texas 522,570 4 North Carolina 296,553 5 Maryland 209,494 6 Virginia 147,326 7 Pennsylvania 124,654 8 Tennessee 121,187
34 White Concentrations 2010 Percent of County Population Data source: William H. Frey analysis of Census2010
35 Largest White Gains State Gains 1 North Carolina 576,840 2 Texas 464,032 3 Florida 426,213 4 Arizona 421,389 5 Colorado 317,913 6 Utah 317,454 7 South Carolina 310,449 8 Tennessee 294,852
36 Largest White Losses State Losses 1 California -860,537 2 New York -456,734 3 New Jersey -342,331 4 Illinois -256,387 5 Michigan -236,752 6 Pennsylvania -227,803 7 Massachusetts -213,559 8 Ohio -178,848


37 Metro-NonMetro Race Changes, % 90% 80% 70% 60% 50% 40% 30% 20% 10% 0% Large Metros** Small Metros NonMetros White* Black* Asian* Other Races* Hispanic
38 Race Ethnic Compositions 100% 90% 80% 70% 60% 50% 40% 30% 20% 10% 0% Los Angeles Atlanta Philadelphia White Black Hispanic Asian Other

39 LA and NY: Race Change , , , , , , ,000 Los Angeles New York White Black Asian Hispanic
40 Atlanta and Phila: Race Change , , , ,000 50,000-50, ,000 Atlanta Philadelphia White Black Asian Hispanic

41 City and Suburb Populations, % 90% 80% 70% 60% 50% 40% 30% 20% 10% 0% 53 Cities Suburbs White Black Am Indian Asian Hawaii Othr Race 2+ Races Hispanic 72 65
42 Change in City and Suburb Population by Race/Ethnicity 10,000,000 8,000,000 6,000,000 4,000,000 2,000, ,000,000 City Suburbs White Black Asian 2+ Races Hispanic
43 City Suburb Race-Ethnic Profiles Selected Metros 100% Los Angeles Atlanta Philadelphia 80% 60% 40% 20% 0% City Suburbs City Suburbs City Suburbs White Black Asian/other Hispanic
44
45 Cities with Greatest Black Losses City Black Loss 1 Detroit -185,393 2 Chicago -181,453 3 New York -100,859 4 Los Angeles -54,606 5 Washington DC -39,035 6 Oakland -33,502 7 Cleveland -33,304 8 Atlanta -29,746
46 Metro Residents Living in Suburbs White Black Asian Hispanic
47 US Growth by Age

48 Growth by Ages Atlanta Philadelphia Pittsburgh Under
49 State Growth in Child Population*, Growth 5% and over Growth under 5% Decline under 5% Decline 5% and over Under age 18
50 Change in Child Population by Race-Ethnicity 6,000,000 4,000,000 2,000, ,000,000-4,000,000-6,000,000 White Black Am Indian Asian 2+ Races Hispanic
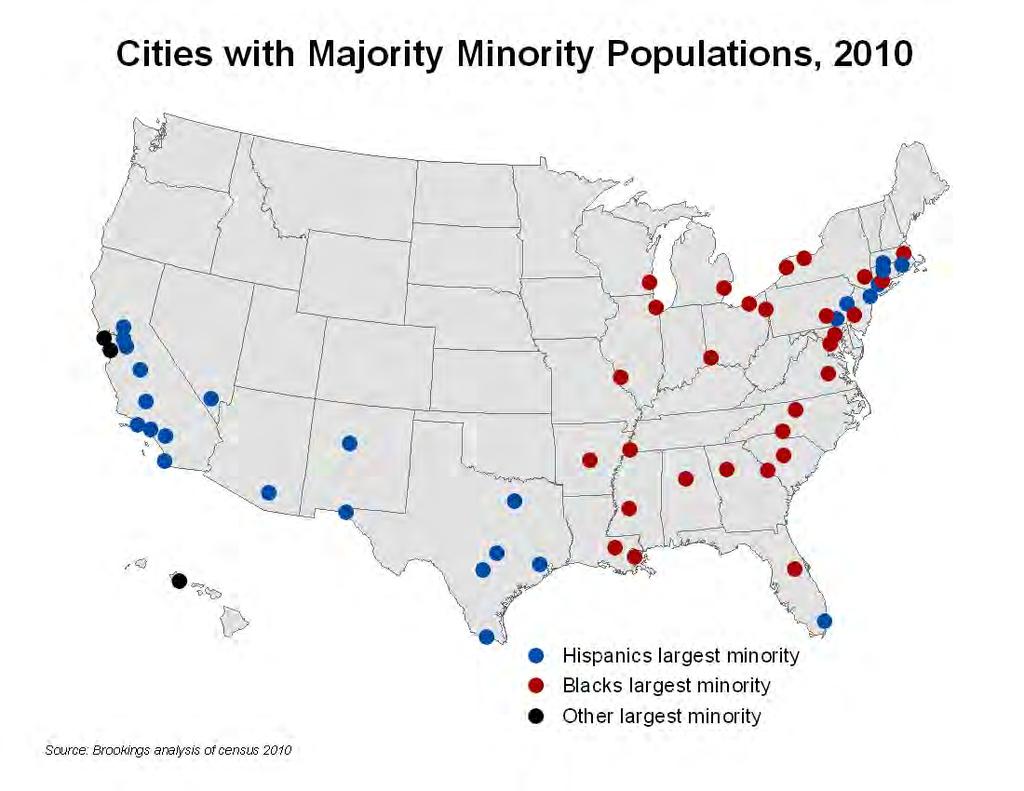
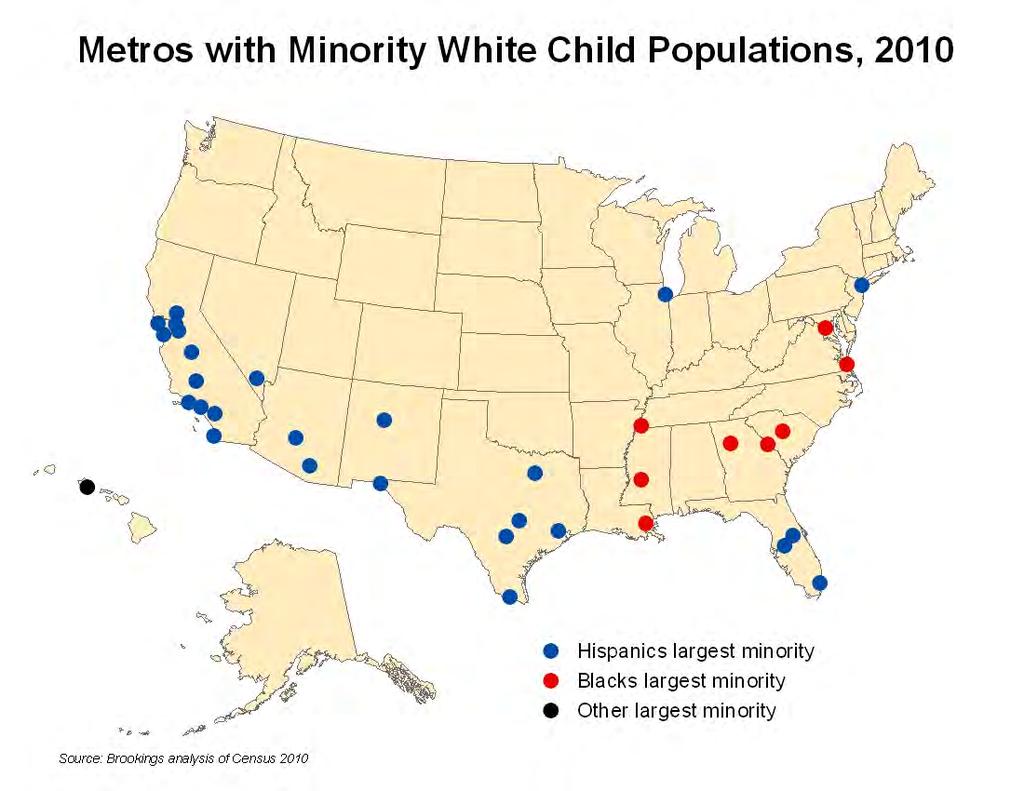
51 Percent Minority Children, 2010 GT 50% 40% - 50% 25% - 40% Under 25%
52
53 Percent Children with Immigrant Parents % 40 35% 35% 34% 32% 31% 31% 30 23% CA NY NV AZ FL NJ TX US Ist Gen 2nd Gen
54 Children Speaking Other than English GT 20% 10% - 20% 6% - 10% Under 6% * Ages 5-17
55 US Growth by Age
56 Median Ages for States, and over 38 to to 38 Below 36
57 Age 65 + Growth GT 25% 15% -25% 10% -15% under 10%

58 Population Changes - 3 Decades 12,000 Young Elderly Old Elderly (65-74) (75 +) 10,000 8,000 6,000 4,000 2,000 0 Source: Source: William William H. H. Frey Frey analysis
59 RANK: Age 65+ Growth, A l a s k a 1 Raleigh 60% 2 Austin 53% 3 Las Vegas 50% 4 Boise City 46% 5 Atlanta 44% 6 Provo 42% 7 Colorado Springs 40% 8 Houston 39% 9 Dallas 38% 10 Charlotte 36%
60 RANK: Age Growth, A l a s k a 1 Raleigh 60% 2 Austin 53% 3 Las Vegas 50% 4 Boise City 46% 5 Atlanta 44% 6 Provo 42% 7 Colorado Springs 40% 8 Houston 39% 9 Dallas 38% 10 Charlotte 36%

61 Projected Number of Moves by Age
62 Projected Age 65+ Growth , US States 140% & above 100% -139% 70% -99% under 69%
63 Projected Age 65+ Growth, percent growth Florida California New York
64 Percent Age 65+, Central and Suburban Counties, Projected : Selected Metro Areas New York Philadelphia Chicago Los Angeles Central Cos. Source: Source: William William H. H. Frey Frey analysis analysis Suburban Cos.
65 Boomers vs. Parents at Midlife % With 3+ Kids 30% 55% % Not Married 21% 36% %Women Not Working 23% 50% % HS Dropout 14% 38% 0% 10% 20% 30% 40% 50% 60% Boomers Parents

66 Projected Race-Ethnic Shares, % 90% 80% 70% 60% 50% 40% 30% 20% 10% 0% Children % 90% 80% 70% 60% 50% 40% 30% 20% 10% 0% Seniors white Black Asian/Other Hispanic
67 Contributions to Labor Force Growth (in millions) White Black Asian/Other Hispanic
68 Race for Age Groups: Arizona 100% 90% 80% 70% 60% 50% 40% 30% 20% 10% 0% 42 Age Under Age Age Age 65+ White Black Asian Other Hispanic
69 Race for Age Groups: US 100% 90% 80% 70% 60% 50% 40% 30% 20% 10% 0% Age Under Age Age Age 65+ White Black Asian Other Hispanic
70 Race for Age Groups: Minnesota 100% 80% 60% 40% 20% % Age Under 15 Age Age Age 65+ White Black Asian Other Hispanic

71 Useful Websites
BUILDING CAPACITY FOR COLLEGE AND CAREER READINESS: LESSONS LEARNED FROM NAEP ITEM ANALYSES. Council of the Great City Schools
 1 BUILDING CAPACITY FOR COLLEGE AND CAREER READINESS: LESSONS LEARNED FROM NAEP ITEM ANALYSES Council of the Great City Schools 2 Overview This analysis explores national, state and district performance
cover Private Public Schools America s Michael J. Petrilli and Janie Scull
 cover America s Private Public Schools Michael J. Petrilli and Janie Scull February 2010 contents introduction 3 national findings 5 state findings 6 metropolitan area findings 13 conclusion 18 about us
46 Children s Defense Fund
 Nationally, about 1 in 15 teens ages 16 to 19 is a dropout. Fewer than two-thirds of 9 th graders in Florida, Georgia, Louisiana and Nevada graduate from high school within four years with a regular diploma.
medicaid and the How will the Medicaid Expansion for Adults Impact Eligibility and Coverage? Key Findings in Brief
 on medicaid and the uninsured July 2012 How will the Medicaid Expansion for Impact Eligibility and Coverage? Key Findings in Brief Effective January 2014, the ACA establishes a new minimum Medicaid eligibility
Average Loan or Lease Term. Average
 Auto Credit For many working families and individuals, owning a car or truck is critical to economic success. For most, a car or other vehicle is their primary means of transportation to work. For those
FY year and 3-year Cohort Default Rates by State and Level and Control of Institution
 Student Aid Policy Analysis FY2007 2-year and 3-year Cohort Default Rates by State and Level and Control of Institution Mark Kantrowitz Publisher of FinAid.org and FastWeb.com January 5, 2010 EXECUTIVE
2017 National Clean Water Law Seminar and Water Enforcement Workshop Continuing Legal Education (CLE) Credits. States
 Credits. States") t 2017 National Clean Water Law Seminar and Water Enforcement Workshop Continuing Legal Education (CLE) Credits NACWA has applied to the states listed below for Continuing Legal Education (CLE) credits.
t 2017 National Clean Water Law Seminar and Water Enforcement Workshop Continuing Legal Education (CLE) Credits NACWA has applied to the states listed below for Continuing Legal Education (CLE) credits.
STATE CAPITAL SPENDING ON PK 12 SCHOOL FACILITIES NORTH CAROLINA
 STATE CAPITAL SPENDING ON PK 12 SCHOOL FACILITIES NORTH CAROLINA NOVEMBER 2010 Authors Mary Filardo Stephanie Cheng Marni Allen Michelle Bar Jessie Ulsoy 21st Century School Fund (21CSF) Founded in 1994,
2016 Match List. Residency Program Distribution by Specialty. Anesthesiology. Barnes-Jewish Hospital, St. Louis MO
 2016 Match List Residency Program Distribution by Specialty Anesthesiology Cleveland Clinic Foundation - Ohio, Cleveland OH University of Arkansas Medical School - Little Rock, Little Rock AR University
Disciplinary action: special education and autism IDEA laws, zero tolerance in schools, and disciplinary action
 National Autism Data Center Fact Sheet Series March 2016; Issue 7 Disciplinary action: special education and autism IDEA laws, zero tolerance in schools, and disciplinary action The Individuals with Disabilities
Wilma Rudolph Student Athlete Achievement Award
 Wilma Rudolph Student Athlete Achievement Award CRITERIA FOR NOMINATION The N4A Wilma Rudolph Student Athlete Achievement Award is intended to honor student athletes who have overcome great personal, academic,
Two Million K-12 Teachers Are Now Corralled Into Unions. And 1.3 Million Are Forced to Pay Union Dues, as Well as Accept Union Monopoly Bargaining
 FACT SHEET National Institute for Labor Relations Research 5211 Port Royal Road, Suite 510 i Springfield, VA 22151 i Phone: (703) 321-9606 i Fax: (703) 321-7342 i research@nilrr.org i www.nilrr.org August
Reaching the Hispanic Market The Arbonne Hispanic Initiative
 Reaching the Hispanic Market The Arbonne Hispanic Initiative Hispanic Initiative Overview 2002 Arbonne en Español Started 2006 Initiated Hispanic Initiative 2007 Market Study & Survey Field Support» Jael
A Profile of Top Performers on the Uniform CPA Exam
 Marquette University e-publications@marquette Accounting Faculty Research and Publications Business Administration, College of 8-1-2014 A Profile of Top Performers on the Uniform CPA Exam Michael D. Akers
The following tables contain data that are derived mainly
 APPENDIX Medical Schools in the United s, 2012-2013 Barbara Barzansky, PhD; Sylvia I. Etzel The following tables contain data that are derived mainly from the 2012-2013 Liaison Committee on Medical Education
Housekeeping. Questions
 Housekeeping To join us on audio, dial the phone number in the teleconference box and follow the prompts. Please dial in with your Attendee ID number. The Attendee ID number will connect your name in WebEx
The Economic Impact of College Bowl Games
 The Economic Impact of College Bowl Games September 2016 TABLE OF CONTENTS Contents Executive Summary 1 Introduction 2 Bowl Game EI Studies 4 Analysis 5 Limitations 7 Research Team 8 EXECUTIVE SUMMARY
The Demographic Wave: Rethinking Hispanic AP Trends
 The Demographic Wave: Rethinking Hispanic AP Trends Kelcey Edwards & Ellen Sawtell AP Annual Conference, Las Vegas, NV July 19, 2013 Exploring the Data Hispanic/Latino US public school graduates The Demographic
Stetson University College of Law Class of 2012 Summary Report
 Stetson University College Law Class 2012 Summary Report Full-time Long-term Salaries # with Salary 25th Median 75th Mean Total = 341 Gender : Women Men Subtotal Race : Minority Nonminority Subtotal Gender
RETAIL SECTOR CONTINUES SLOW RECOVERY AFTER A HARSH WINTER
 RETAIL MARKET REPORT: 1Q RETAIL SECTOR CONTINUES SLOW RECOVERY AFTER A HARSH WINTER KEY INDICATORS: Key retail market indicators improved slightly this quarter. Monthly retail sales (ex: motor vehicles
Discussion Papers. Assessing the New Federalism. State General Assistance Programs An Urban Institute Program to Assess Changing Social Policies
 State General Assistance Programs 1998 L. Jerome Gallagher Cori E. Uccello Alicia B. Pierce Erin B. Reidy 99 01 Assessing the New Federalism An Urban Institute Program to Assess Changing Social Policies
Student Admissions, Outcomes, and Other Data
 Student Admissions, Outcomes, and Other Data Data on Incoming Class UNL Clinical Psychology Training Program (CPTP) August Academic Year of Entry 7 8 9 Number of Applicants 9 7 8 8 8 Number Interviewed
A Comparison of the ERP Offerings of AACSB Accredited Universities Belonging to SAPUA
 Association for Information Systems AIS Electronic Library (AISeL) SAIS 2004 Proceedings Southern (SAIS) 3-1-2004 A Comparison of the ERP Offerings of AACSB Accredited Universities Belonging to SAPUA Ronald
Junior (61-90 semester hours or quarter hours) Two-year Colleges Number of Students Tested at Each Institution July 2008 through June 2013
 Two-year Colleges Number of Students Tested at Each Institution July 2008 through June 2013") Number of Students Tested at Each Institution July 2008 through June 2013 List of Institutions Number of School Name Students AIKEN TECHNICAL COLLEGE, SC 119 ARKANSAS NORTHEASTERN COLLEGE, AR 66 ASHLAND
Number of Students Tested at Each Institution July 2008 through June 2013 List of Institutions Number of School Name Students AIKEN TECHNICAL COLLEGE, SC 119 ARKANSAS NORTHEASTERN COLLEGE, AR 66 ASHLAND
The College of New Jersey Department of Chemistry. Overview- 2009
 The College of New Jersey Department of Chemistry Overview- 2009 Faculty Heba Abourahma John Allison Michelle Bunagan Lynn Bradley Benny Chan Don Hirsh Jinmo Huang David Hunt Stephanie Sen (plus currently
2007 NIRSA Salary Census Compiled by the National Intramural-Recreational Sports Association NIRSA National Center, Corvallis, Oregon
 2007 NIRSA Salary Census Compiled by the National Intramural-Recreational Sports Association NIRSA National Center, Corvallis, Oregon 2007 Salary Census 2007 No part of this publication may be reproduced
NASWA SURVEY ON PELL GRANTS AND APPROVED TRAINING FOR UI SUMMARY AND STATE-BY-STATE RESULTS
 NASWA SURVEY ON PELL GRANTS AND APPROVED TRAINING FOR UI SUMMARY AND STATE-BY-STATE RESULTS FINAL: 3/22/2010 Contact: Yvette Chocolaad Director, Center for Employment Security Education and Research National
The number of involuntary part-time workers,
 University of New Hampshire Carsey School of Public Policy CARSEY RESEARCH National Issue Brief #116 Spring 2017 Involuntary Part-Time Employment A Slow and Uneven Economic Recovery Rebecca Glauber The
Enrollment Trends. Past, Present, and. Future. Presentation Topics. NCCC enrollment down from peak levels
 Presentation Topics 1. Enrollment Trends 2. Attainment Trends Past, Present, and Future Challenges & Opportunities for NC Community Colleges August 17, 217 Rebecca Tippett Director, Carolina Demography
The Effect of Income on Educational Attainment: Evidence from State Earned Income Tax Credit Expansions
 The Effect of Income on Educational Attainment: Evidence from State Earned Income Tax Credit Expansions Katherine Michelmore Policy Analysis and Management Cornell University km459@cornell.edu September
January 2014 March 2015 Virginia LGBT TravelsAmerica Visitor Profile Report August 10, 2015
 TravelsAmerica Visitor Profile Report August 10, 2015 Job #212 241402 1 Contents 1 Appendix: Results of the Research 2 13 Visitor Volume and Origins 14 3 Visitor Demographics 20 4 Trip Characteristics
CLE/MCLE Information by State
 /M Information by State Updated June 30, 2011 State /M Information Form Contact Telephone Email Alabama http://www.alabar.org/cle/ http://www.alabar.org/cle/course_approv al.cfm Linda Dukes Conner, of
EXPANDING THE SCOPE OF THE ATIS TASK: THE ATIS-3 CORPUS
 EXPANDING THE SCOPE OF THE ATIS TASK: THE ATIS-3 CORPUS Deborah A. Dahl, Madeleine Bates, Michael Brown, William Fisher, Kate Hunicke-Smith, David Pallett, Christine Pao, Alexander Rudnicky, and Elizabeth
The Value of English Proficiency to the. By Amber Schwartz and Don Soifer December 2012
 The Value of English Proficiency to the United States Economy By Amber Schwartz and Don Soifer December 2012 Also by the Lexington Institute: English Language Learners and NAEP: Progress Through Inclusion,
2013 donorcentrics Annual Report on Higher Education Alumni Giving
 213 donorcentrics Annual Report on Higher Education Alumni Giving Summary of Annual Fund Key Performance Indicators July 212-June 213 214 2 Daniel Island Drive, Charleston, SC 29492 T 8.443.9441 E solutions@blackbaud.com
NATIONAL SURVEY OF STUDENT ENGAGEMENT
 NATIONAL SURVEY OF STUDENT ENGAGEMENT (NSSE 2004 Results) Perspectives from USM First-Year and Senior Students Office of Academic Assessment University of Southern Maine Portland Campus 780-4383 Fall 2004
ELLEN E. ENGEL. Stanford University, Graduate School of Business, Ph.D. - Accounting, 1997.
 ELLEN E. ENGEL September 2016 University of Illinois at Chicago Department of Accounting 601 S. Morgan Street Chicago, IL 60607 Office Phone: (312)-413-3418 Mobile Phone: (847) 644-2961 Email: elleneng@uic.edu
Teach For America alumni 37,000+ Alumni working full-time in education or with low-income communities 86%
 About Teach For America Teach For America recruits, trains, and supports top college graduates and professionals who make an initial commitment to teach for two years in urban and rural public schools
VOL VISION 2020 STRATEGIC PLAN IMPLEMENTATION
 VOL VISION 2020 STRATEGIC PLAN IMPLEMENTATION CONTENTS Vol Vision 2020 Summary Overview Approach Plan Phase 1 Key Initiatives, Timelines, Accountability Strategy Dashboard Phase 1 Metrics and Indicators
Wisconsin 4 th Grade Reading Results on the 2015 National Assessment of Educational Progress (NAEP)
") Wisconsin 4 th Grade Reading Results on the 2015 National Assessment of Educational Progress (NAEP) Main takeaways from the 2015 NAEP 4 th grade reading exam: Wisconsin scores have been statistically flat
Wisconsin 4 th Grade Reading Results on the 2015 National Assessment of Educational Progress (NAEP) Main takeaways from the 2015 NAEP 4 th grade reading exam: Wisconsin scores have been statistically flat
National Survey of Student Engagement Spring University of Kansas. Executive Summary
 National Survey of Student Engagement Spring 2010 University of Kansas Executive Summary Overview One thousand six hundred and twenty-one (1,621) students from the University of Kansas completed the web-based
Albert (Yan) Wang. Flow-induced Trading Pressure and Corporate Investment (with Xiaoxia Lou), Forthcoming at
 Wang. Flow-induced Trading Pressure and Corporate Investment (with Xiaoxia Lou), Forthcoming at") Albert (Yan) Wang 315 Lowder Hall 405 W. Magnolia Ave Auburn, AL 36849 Office: 334-844-5324 Cell: 205-737-2677 albertwang@auburn.edu Employment 2017/8 present: Synovus Fellow and Associate Professor, Department
Albert (Yan) Wang 315 Lowder Hall 405 W. Magnolia Ave Auburn, AL 36849 Office: 334-844-5324 Cell: 205-737-2677 albertwang@auburn.edu Employment 2017/8 present: Synovus Fellow and Associate Professor, Department
State Limits on Contributions to Candidates Election Cycle Updated June 27, PAC Candidate Contributions
 State Limits on to Candidates 2017-2018 Election Cycle Updated June 27, 2017 Individual Candidate Alabama Ala. Code 17-5-1 et seq. Unlimited Unlimited Unlimited Unlimited Unlimited Alaska 15.13.070, 15.13.072(e),
Status of Women of Color in Science, Engineering, and Medicine
 Status of Women of Color in Science, Engineering, and Medicine The figures and tables below are based upon the latest publicly available data from AAMC, NSF, Department of Education and the US Census Bureau.
Financial Education and the Credit Behavior of Young Adults
 Financial Education and the Credit Behavior of Young Adults Alexandra Brown 1 J. Michael Collins 2 Maximilian Schmeiser 1 Carly Urban 3 1 Federal Reserve Board 2 Department of Consumer Science University
Susanna M Donaldson Curriculum Vitae
 Susanna M Donaldson Curriculum Vitae Department of Sociology and Anthropology 307 Knapp Hall Phone: (304) 293-8844 West Virginia University Fax: (304) 293-5994 Morgantown, WV 25606-6326 smdonaldson@mail.wvu.edu
Iowa School District Profiles. Le Mars
 Iowa School District Profiles Overview This profile describes enrollment trends, student performance, income levels, population, and other characteristics of the public school district. The report utilizes
Understanding University Funding
 Understanding University Funding Jamie Graham Registrar and AVP, Institutional Planning Brad MacIsaac AVP Planning & Analysis, and Registrar Where does Funding Come From Total Revenue Ontario $13.1B Other
Free Fall. By: John Rogers, Melanie Bertrand, Rhoda Freelon, Sophie Fanelli. March 2011
 Free Fall Educational Opportunities in 2011 By: John Rogers, Melanie Bertrand, Rhoda Freelon, Sophie Fanelli March 2011 Copyright 2011 UCLA s Institute for Democracy, Education, and Access UC All Campus
JOSHUA GERALD LEPREE
 JOSHUA GERALD LEPREE University of Colorado-Boulder, Department of Sociology 195 Ketchum, 327 UCB, Boulder, CO 80309-0327 (305) 484-1065 Joshua.LePree@colorado.edu http://sociology.colorado.edu/people/lepree-josh
Like much of the country, Detroit suffered significant job losses during the Great Recession.
 36 37 POPULATION TRENDS Economy ECONOMY Like much of the country, suffered significant job losses during the Great Recession. Since bottoming out in the first quarter of 2010, however, the city has seen
Updated: December Educational Attainment
 Updated: Educational Attainment Among 25- to 29-year olds, the proportions who have attained a high school education, some college, or a bachelor s degree are all rising, according to longterm trends.
EDELINA M. BURCIAGA 3151 Social Science Plaza Irvine, CA
 EDELINA M. BURCIAGA 3151 Social Science Plaza Irvine, CA 92697-5000 eburciag@uci.edu EDUCATION UNIVERSITY OF CALIFORNIA, IRVINE, Irvine, CA Doctoral candidate, Department of Sociology. Expected graduation
File Print Created 11/17/2017 6:16 PM 1 of 10
 Success - Key Measures Graduation Rate: 4-, 5-, and 6-Year 9. First-time, full-time entering, degree-seeking, students enrolled in a minimum of 12 SCH their first fall semester who have graduated from
EDUCATION POLICY ANALYSIS ARCHIVES A peer-reviewed scholarly journal
 EDUCATION POLICY ANALYSIS ARCHIVES A peer-reviewed scholarly journal English Editor: Sherman Dorn College of Education University of South Florida Spanish Editor: Gustavo Fischman Mary Lou Fulton College
Proficiency Illusion
 KINGSBURY RESEARCH CENTER Proficiency Illusion Deborah Adkins, MS 1 Partnering to Help All Kids Learn NWEA.org 503.624.1951 121 NW Everett St., Portland, OR 97209 Executive Summary At the heart of the
A Guide to Finding Statistics for Students
 San Joaquin Valley Statistics http://pegasi.us/sjstats/ 1 of 2 6/12/2010 5:00 PM A Guide to Finding Statistics for Students CV Stats Home By Topic By Area About the Valley About this Site Population Agriculture
The Impact of Inter-district Open Enrollment in Mahoning County Public Schools
 The Impact of Inter-district Open Enrollment in Mahoning County Public Schools Ronald J. Iarussi Mahoning County Educational Services Center and Mahoning County Career and Technical Center Karen H. Larwin
ACCESS TO SUCCESS IN AMERICA: Where are we? What Can We Learn from Colleges on the Performance Frontier?
 ACCESS TO SUCCESS IN AMERICA: Where are we? What Can We Learn from Colleges on the Performance Frontier? America: Two Powerful Stories Maricopa Community Colleges Student Success Conference Phoenix, AZ
Instrumentation, Control & Automation Staffing. Maintenance Benchmarking Study
 Electronic Document Instrumentation, Control & Automation Staffing Prepared by ITA Technical Committee, Maintenance Subcommittee, Task Force on IC&A Staffing John Petito, Chair Richard Haugh, Vice-Chair
An Empirical Analysis of the Effects of Mexican American Studies Participation on Student Achievement within Tucson Unified School District
 An Empirical Analysis of the Effects of Mexican American Studies Participation on Student Achievement within Tucson Unified School District Report Submitted June 20, 2012, to Willis D. Hawley, Ph.D., Special
top of report Note: Survey result percentages are always out of the total number of people who participated in the survey.
 Offering Report Recognition and Reward for Academic Advising...: Advisor Recognition and Reward... Summary Survey Name: Recognition and Reward for Academic Advising Offering Name: Advisor Recognition and
93 percent of local providers will not be awarded competitive bidding contracts 2.
 Durable Medical Equipment (DME) COMPETITIVE BIDDING Will Cost More Than 100,000 Jobs DMEPOS Competitive Bidding is set to be implemented January 1, 2011 in nine of the United States largest metropolitan
San Francisco County Weekly Wages
 San Francisco County Weekly Wages Focus on Post-Recession Recovery Q 3 205 Update Produced by: Marin Economic Consulting March 6, 206 Jon Haveman, Principal 45-336-5705 or Jon@MarinEconomicConsulting.com
Ken Cyree, Ph.D. Dean of the Business School Frank R. Day/Mississippi Bankers Association Chair Professor of Finance
 Ken Cyree, Ph.D. Dean of the Business School Frank R. Day/Mississippi Bankers Association Chair Professor of Finance Academic Background Ph.D. University of Tennessee, Knoxville, TN, Finance, 1996 M.B.A.
JANIE HODGE, Ph.D. Associate Professor of Special Education 225 Holtzendorff Clemson University
 Hodge 1 JANIE HODGE, Ph.D. Associate Professor of Special Education 225 Holtzendorff Clemson University Academic Degrees B.S. Memphis State University 1976 Elementary Education M.A. University of North
MABEL ABRAHAM. 710 Uris Hall Broadway mabelabraham.com New York, New York Updated January 2017 EMPLOYMENT
 MABEL ABRAHAM Columbia Business School mabel.abraham@columbia.edu 710 Uris Hall 212-854-7788 3022 Broadway mabelabraham.com New York, New York 10027 Updated January 2017 EMPLOYMENT 2015 Columbia University,
Rosalind S. Chou Georgia State University Department of Sociology
 R.Chou, CV Page 1 of 7 POSITIONS Rosalind S. Chou Georgia State University Department of Sociology E-mail: rchou@gsu.edu 2011 present Assistant Professor of Sociology Georgia State University 2010 2011
Educational Attainment
 A Demographic and Socio-Economic Profile of Allen County, Indiana based on the 2010 Census and the American Community Survey Educational Attainment A Review of Census Data Related to the Educational Attainment
Effective Recruitment and Retention Strategies for Underrepresented Minority Students: Perspectives from Dental Students
 Critical Issues in Dental Education Effective Recruitment and Retention Strategies for Underrepresented Minority Students: Perspectives from Dental Students Naty Lopez, Ph.D.; Rose Wadenya, D.M.D., M.S.;
NATIONAL CENTER FOR EDUCATION STATISTICS
 NATIONAL CENTER FOR EDUCATION STATISTICS Palm Desert, CA The Integrated Postsecondary Education Data System (IPEDS) is the nation s core postsecondary education data collection program. It is a single,
Suggested Citation: Institute for Research on Higher Education. (2016). College Affordability Diagnosis: Maine. Philadelphia, PA: Institute for
. College Affordability Diagnosis: Maine. Philadelphia, PA: Institute for") MAINE Suggested Citation: Institute for Research on Higher Education. (2016). College Affordability Diagnosis: Maine. Philadelphia, PA: Institute for Research on Higher Education, Graduate School of Education,
MAINE Suggested Citation: Institute for Research on Higher Education. (2016). College Affordability Diagnosis: Maine. Philadelphia, PA: Institute for Research on Higher Education, Graduate School of Education,
December 1966 Edition. The Birth of the Program
 December 1966 Edition A HISTORY OF THE SCHOOL PSYCHOLOGY TRAINING PROGRAM AT FLORIDA STATE UNIVERSITY The Birth of the Program A preliminary study of the need for school psychologists by the Department
Fisk University FACT BOOK. Office of Institutional Assessment and Research
 Fisk University 2013-2014 FACT BOOK Office of Institutional Assessment and Research 1 The 2013-2014 Fisk University Fact Book is designed to present and provide basic descriptive and statistical information
CAMPUS PROFILE MEET OUR STUDENTS UNDERGRADUATE ADMISSIONS. The average age of undergraduates is 21; 78% are 22 years or younger.
 CAMPUS PROFILE MEET OUR STUDENTS Freshmen are defined here as all domestic students entering in fall quarter from high school. These statistics include information drawn from records available at UC Davis.
2009 National Survey of Student Engagement. Oklahoma State University
 Office of University Assessment and Testing Jeremy Penn, Ph.D., Director Chris Ray, Ph.D., Assistant Director uat@okstate.edu (405) 744-6687 Contributions to this report were made by Tom Gross and Lihua
READY OR NOT? CALIFORNIA'S EARLY ASSESSMENT PROGRAM AND THE TRANSITION TO COLLEGE
 READY OR NOT? CALIFORNIA'S EARLY ASSESSMENT PROGRAM AND THE TRANSITION TO COLLEGE Michal Kurlaender University of California, Davis Policy Analysis for California Education March 16, 2012 This research
Peer Comparison of Graduate Data
 Peer Comparison of Graduate Data Enrollment and Degrees Total Number of Doctoral Degrees Awarded 2009 Institution 2009 Doctorates Granted of Florida 2,028 Ohio State - 1,617 of Minnesota-Twin Cities 1,594
Resume. Christine Ann Loucks Telephone: (208) (work)
 (work)") Resume Christine Ann Loucks Telephone: (208) 426-1468 (work) Professor, Department of Economics (208) 342-2412 (home) College of Business and Economics cloucks@boisestate.edu Boise State University, Boise,
Resume Christine Ann Loucks Telephone: (208) 426-1468 (work) Professor, Department of Economics (208) 342-2412 (home) College of Business and Economics cloucks@boisestate.edu Boise State University, Boise,
Spanish Users and Their Participation in College: The Case of Indiana
 and Their Participation in College: The Case of Indiana CAROLINA PELAEZ-MORALES Purdue University Spanish has become a widely used second language in the U.S. As the number of Spanish users (SUs) continues
How Living Costs Undermine Net Price As An Affordability Metric
 How Living Costs Undermine Net Price As An Affordability Metric Braden J. Hosch, Ph.D. Asst. Vice President for Institutional Research, Planning & Effectiveness Association for Institutional Research Annual
The Dropout Crisis is a National Issue
 2012 ANNUAL REPORT The Dropout Crisis is a National Issue Thirty percent of U.S. students drop out of high school, with dropout rates exceeding 50% in poor urban communities. Students who dropout face
Practices Worthy of Attention Step Up to High School Chicago Public Schools Chicago, Illinois
 Step Up to High School Chicago Public Schools Chicago, Illinois Summary of the Practice. Step Up to High School is a four-week transitional summer program for incoming ninth-graders in Chicago Public Schools.
Rosalind S. Chou Georgia State University Department of Sociology
 R.Chou, CV Page 1 of 7 POSITIONS Rosalind S. Chou Georgia State University Department of Sociology E-mail: rchou@gsu.edu 2011 present Assistant Professor of Sociology Georgia State University 2010 2011
SAT Results December, 2002 Authors: Chuck Dulaney and Roger Regan WCPSS SAT Scores Reach Historic High
 ABOUT THE SAT 2001-2002 SAT Results December, 2002 Authors: Chuck Dulaney and Roger Regan WCPSS SAT Scores Reach Historic High The Scholastic Assessment Test (SAT), more formally known as the SAT I: Reasoning
Los Angeles City College Student Equity Plan. Signature Page
 Los Angeles City College Student Equity Plan Signature Page Los Angeles Community College Los Angeles City College President, Board of Trustees Date District Chancellor: College President: Academic Senate
Trends in Tuition at Idaho s Public Colleges and Universities: Critical Context for the State s Education Goals
 1 Trends in Tuition at Idaho s Public Colleges and Universities: Critical Context for the State s Education Goals June 2017 Idahoans have long valued public higher education, recognizing its importance
Sheryl L. Skaggs, Ph.D. Curriculum Vitae
 October 2011 Sheryl L. Skaggs, Ph.D. Curriculum Vitae School of Economic, Political and Policy Sciences Sociology and Public Policy The University of Texas at Dallas 800 W. Campbell Rd., GR 31; Richardson,
Lesson M4. page 1 of 2
 Lesson M4 page 1 of 2 Miniature Gulf Coast Project Math TEKS Objectives 111.22 6b.1 (A) apply mathematics to problems arising in everyday life, society, and the workplace; 6b.1 (C) select tools, including
Psychometric Research Brief Office of Shared Accountability
 August 2012 Psychometric Research Brief Office of Shared Accountability Linking Measures of Academic Progress in Mathematics and Maryland School Assessment in Mathematics Huafang Zhao, Ph.D. This brief
LEN HIGHTOWER, Ph.D.
 Page 1 LEN HIGHTOWER, Ph.D. 350 South Merelet Lane Orange, CA 92869 E-Mail: WLHightower@hotmail.com 714-602-6573 Home 503-341-2672 Cell CAREER HIGHLIGHTS HighTower Consulting Assisted Concordia University
2014 Comprehensive Survey of Lawyer Assistance Programs
 2014 Comprehensive Survey of Lawyer Assistance Programs A m e r i c a n B a r A s s o c i a t i o n 3 2 1 N. C l a r k S t r e e t C h i c a g o, I L 6 0 6 5 4 Copyright 2015 by the American Bar Association.
STUDENT PERCEPTION SURVEYS ACTIONABLE STUDENT FEEDBACK PROMOTING EXCELLENCE IN TEACHING AND LEARNING
 1 STUDENT PERCEPTION SURVEYS ACTIONABLE STUDENT FEEDBACK PROMOTING EXCELLENCE IN TEACHING AND LEARNING Presentation to STLE Grantees: December 20, 2013 Information Recorded on: December 26, 2013 Please
Jon N. Kerr, PhD, CPA August 2017
 JON NATHAN KERR, PhD, CPA ASSISTANT PROFESSOR THE OHIO STATE UNIVERSITY FISHER COLLEGE OF BUSINESS 2100 NEIL AVENUE 400 FISHER HALL COLUMBUS, OH 43210 Email: kerr.360@osu.edu Office: Fax: EDUCATION Columbia
Strategic Plan Update, Physics Department May 2010
 Strategic Plan Update, Physics Department May 2010 Mission To generate and disseminate knowledge of physics and its applications. Vision The Department of Physics faculty will continue to conduct cutting
Update Peer and Aspirant Institutions
 Update Peer and Aspirant Institutions Prepared for Southern University at Shreveport January 2015 In the following report, Hanover Research describes the methodology used to identify Southern University
Sung-Wook Kwon. Texas Tech University Phone: Box Fax: Lubbock, TX 79409
 VITAE for Sung-Wook Kwon Sung-Wook Kwon Department of Political Science E-mail: sung.kwon@ttu.edu Texas Tech University Phone: 806-834-4786 Box 41015 Fax: 806-742-0850 Lubbock, TX 79409 ACADEMIC APPOINTMENTS
Centers for Disease Control and Prevention, Office for State, Tribal, Local and Territorial Support, Public Health Law Program
 Centers for Disease Control and Prevention, Office for State, Tribal, Local and Territorial Support, Public Health Law Program Legal Epidemiology Competency Model Project PARTICIPANT LIST (CONFIRMED) ANDERSON,
Redirected Inbound Call Sampling An Example of Fit for Purpose Non-probability Sample Design
 Redirected Inbound Call Sampling An Example of Fit for Purpose Non-probability Sample Design Burton Levine Karol Krotki NISS/WSS Workshop on Inference from Nonprobability Samples September 25, 2017 RTI
Demographic Survey for Focus and Discussion Groups
 Appendix F Demographic Survey for Focus and Discussion Groups Demographic Survey--Lesbian, Gay, and Bisexual Discussion Group Demographic Survey Faculty with Disabilities Discussion Group Demographic Survey