Environmental Scan 2002
|
|
|
- Adele Nelson
- 5 years ago
- Views:
Transcription

1 Environmental Scan 2002 Office of Institutional Research and Planning New Jersey s Public Liberal Arts College
2 OIRP Staff Steven L. Johnson, Director Babette Varano, Associate Director Wanda Kosinski, Testing Coordinator Xiurong Zhang, Research Analyst Publication Date May, 2002 New Jersey s Public Liberal Arts College
3 CONTENTS I. Highlights...i II. Data Tables Table 1: Population Trends for New Jersey (and Selected New York) Counties...1 Map 1: Population Change by County, Table 2: Population Projections for New Jersey (and Selected New York) Counties...3 Map 2: Projected Population Change, by County, to Table 3: Trends in Public High School Graduates in New Jersey...5 Table 4: New Jersey Public High School Graduates by County and Ethnicity, Table 5: New Jersey Public High School Graduates by County and Sex, Table 6: Plans for Further Education by County, N.J. Public High School Graduates, Table 7: Plans of N.J. Public H.S. Graduates for In- Vs. Out-of-State Study, by Co., Table 8: Post-Secondary Institutions in New Jersey (and Selected New York) Counties...10 Map 3: Post-Secondary Institutions Relative to Population Change...11 Table 9: College Availability Ratios by New Jersey County...12 Table 10: Trends in Undergraduate Enrollment at N.J. Institutions of Higher Education...13 Table 11: Trends in Graduate Enrollment at N.J. Institutions of Higher Education...14 Table 12: Trends in Total Enrollment at N.J. Institutions of Higher Education...15 Table 13: Fall 2000 Undergraduate Enrollments by CIP Code at N.J. State Colleges & Univ...16 Table 14: Inventory of Bachelor s Degree Programs by CIP Code at NJSCU s...17 Table 15: FY2000 Bachelor's Degrees Awarded by CIP Code at NJSCU s...18 Table 16: Inventory of Master s Degree Programs by CIP Code at NJSCU s...19 Table 17: FY2000 Master's Degrees Awarded by CIP Code at NJSCU s...20 Table 18: Trends in Annual Resident F-T Undergraduate Tuition Charges at N.J. Inst Figure 1: State Support as a Percent of Revenues...22 Figure 2: State Appropriations vs. Total E&G...23 Table 19: Estimated and Projected Employment by Occupation, Bergen County...24 Table 20: Unemployment Statistics for New Jersey, by Region, Through February III. Appendix Governor McGreevey s Budget Address to the Joint Session of the Legislature, 11 February 2002 Governor McGreevey Signs Executive Order Creating Governor s Education Cabinet, 21 Feb i
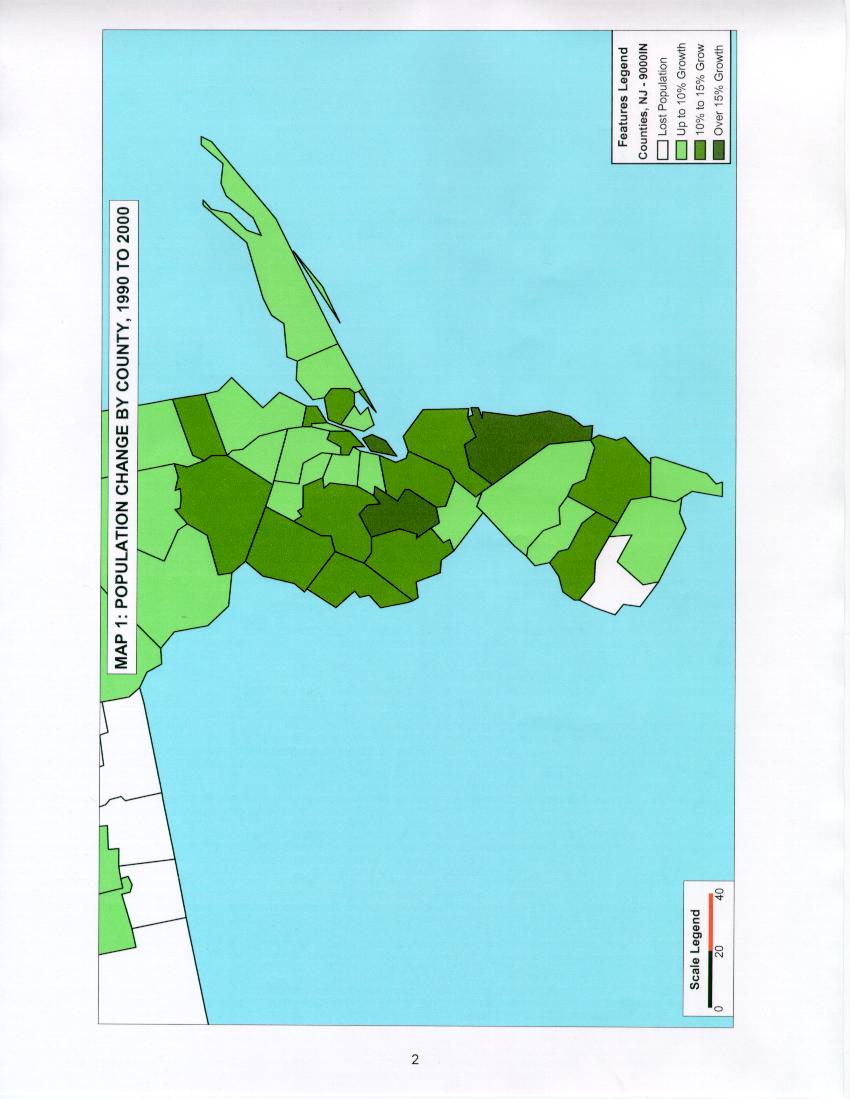
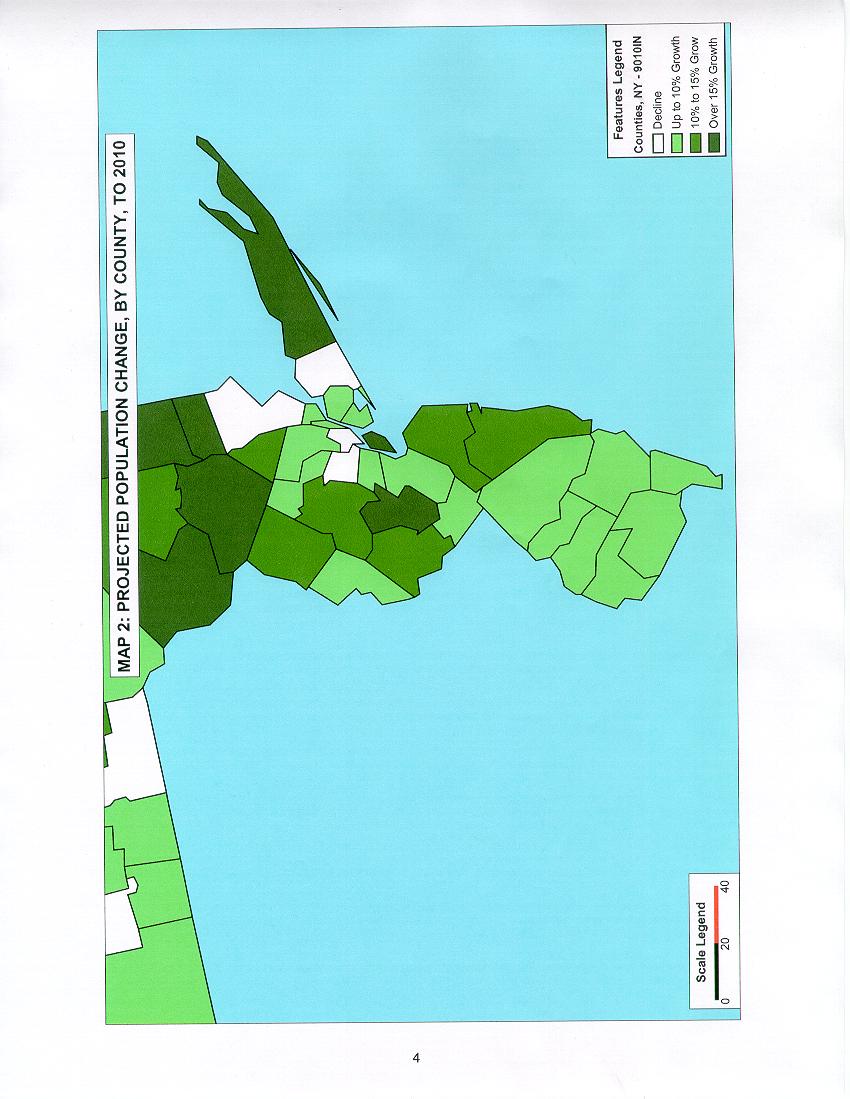
4 HIGHLIGHTS Population Trends and Projections New Jersey s population increased by 684,162 persons, or 8.9%, between 1990 and Bergen County s population rose 7.1% during the 10-year period. [Table 1] Somerset (23.8%), Ocean (17.9%), Hunterdon (13.2%), and Atlantic (12.6%) were the fastest growing counties in the state between 1990 and The populations of Middlesex, Monmouth, Morris, and Warren counties rose between 11% and 12% over the period. [Table 1 and Map 1] In New Jersey, only Salem County (-1.5%) lost population over the 10-year period, though Camden (1.2%) and Essex (2.0%) experienced only modest growth. [Table 1] Nearby New York counties grew proportionately more than Bergen County. The population of Orange County rose 11.0% between 1990 and 2000, while Rockland County s population increased 8.0% during the same period. Other New York counties in the region that experienced double-digit growth included the Bronx at 10.7%, Queens at 14.2%, and Richmond, or Staten Island, at 17.1%. [Table 1] It is projected that New Jersey s population will increase 6.2% by While Bergen County s projected 5.1% rate of growth lags slightly behind the anticipated rate of growth for the State as a whole, it exceeds projections for such nearby counties as Passaic (3.0%), Essex (-0.8%), Hudson (-0.5%), and Union (1.6%). [Table 2] The greatest potential source of new students from New Jersey may be those larger counties projected to grow the most between 2000 and 2010, including Somerset (17.2%), Ocean (12.7%), Monmouth (11.4%), and Morris (10.7%). Large increases in population are also projected for Hunterdon (14.7%) and Sussex (12.4%) counties, but these increases are based on smaller base populations. [Table 2 and Map 2] New York also shows high potential as a possible source of new students. In particular, the populations of Orange and Rockland counties in New York are projected to increase 20.9% and 15.0%, respectively, by Richmond County s population is also projected to increase 22.3% over the same period. In contrast, Westchester County s population is projected to decline by 0.8% by [Table 2] 1 1 While population projections for New Jersey counties have been updated to account for Census 2000 figures, New York projections still use a base year of 1990 for estimating population changes. When new projections are available for New York that use a base year of 2000, they will be incorporated into this scan. i
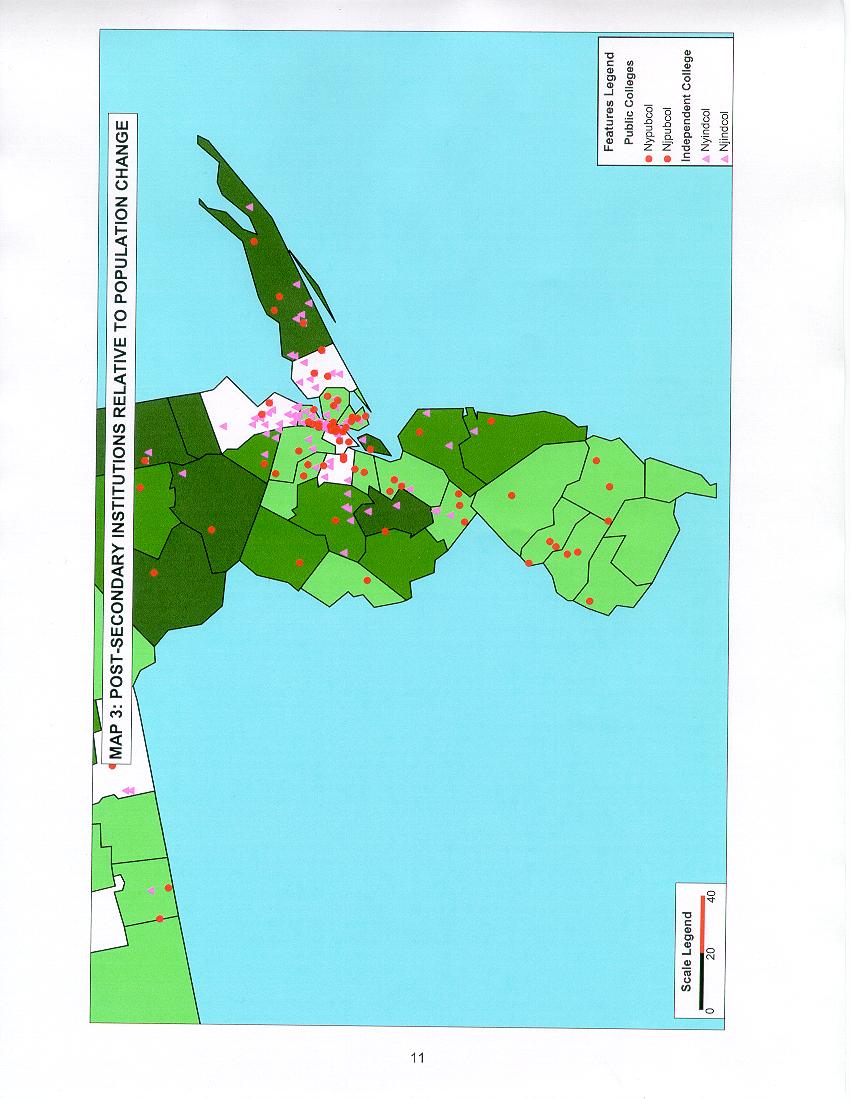
5 Trends in High School Graduates and Recent College-Going Rates The number of public high school students graduated in New Jersey changed very little (-0.1%) from to The decline was marginally greater in Bergen County (-0.2%) over this period. [Table 3] Between and , Somerset (10.3%), Mercer (8.3%), and Cape May (7.1%) counties experienced the greatest increases in public high school graduates, while Atlantic (-11.7%), Camden (-5.5%), and Essex (-4.4%) counties experienced the largest declines. [Table 3] Statewide, approximately one third of New Jersey s public high school graduates were students of color. Racial and ethnic diversity was most notable in Hudson and Essex counties where students of color comprised 75% and 60% of the graduating classes, respectively. In Bergen County, 31% of graduates were students of color. [Table 4] More males than females (50.2% to 49.8%) were graduated from Bergen County public high schools during Statewide, the reverse was true by a similarly small margin (50.1% female to 49.9% male). Passaic County had the highest proportion of male graduates in (53.5%), while Sussex County had the highest proportion of females (53.3%). [Table 5] Statewide, over 79% of New Jersey s public high school graduates said they planned to continue their education beyond the secondary level at a college or university. Another 4% said they would avail themselves of other forms of postsecondary education. The highest planned college-going rates were seen in Morris (89.6%), Bergen (87.3%), and Somerset (87.0%) counties. The lowest planned college-going rates were seen in Cumberland (63.7%), Hudson (67.5%), and Salem (68.1%) counties. [Table 6] Of those public high school graduates who said they planned to continue their education at a college or university, approximately 62% said they intended to stay in New Jersey. The counties with the highest planned rates of in-state study are Hudson (85.5%), Cumberland (73.95), Middlesex (73.1%), and Ocean (73.1%). The highest planned out-migration rates are seen in Hunterdon (61.2%), Morris (53.1%), Warren (49.9%), and Bergen (47.7%) counties. [Table 7] Other Colleges Competition for students is intense in northeastern New Jersey. There are almost 90 post-secondary institutions of all types located in the five northeastern counties of the State. Bergen and Essex each have 27 institutions, Hudson and Morris have 13 apiece, and Passaic has 9. [Table 8 and Map 3] ii
6 There is less competition for students in northwestern, central, and southern New Jersey. The northern and central New Jersey counties with the fewest post-secondary institutions are Hunterdon (0), Sussex (1), Warren (2), and Somerset (6). In the south, Salem (1), Cape May (2), Cumberland (4), Burlington (5), and Gloucester (5) counties have the fewest post-secondary institutions. [Table 8] In New York, Rockland (8) and Orange (3) counties have relatively few postsecondary institutions, while Westchester has 28. When considering New York City and Long Island, Richmond County (the Borough of Staten Island) has the fewest competitors for students. [Table 8] College availability can be calculated either as the ratio of total population to institutions or as the ratio of high school graduates to institutions. When looking just at the ratio of public high school graduates to colleges, Burlington (3780:1), Somerset (2124:1), Union (1963:1), Monmouth (1883:1), and Bergen (1817:1) counties have a surfeit of students relative to post-secondary institutions. [Table 9] Between 1997 and 2001, total fall enrollment rose in all five sectors of the New Jersey higher education system. Total enrollment grew 4.8% in the public research university sector, mainly on the strength of increases in undergraduate enrollment. In the state college and university sector, total enrollment increased 5.2%, with graduate enrollment rising faster than undergraduate. Total enrollment rose 6.0% in the community college sector, and 6.6% in the independent sector. The proprietary sector, however, grew most, with total enrollment up 30.0%. [Tables 10 to 12] Among state colleges and universities, total enrollment increased most between 1997 and 2001 at William Paterson (13.7%). Ramapo and Montclair both grew by 7.8%. Only Thomas Edison State College (-2.7%) lost enrollment over the period. [Tables 10 to 12] Ramapo was the third-fastest growing college/university in Bergen County. The growth leader was Felician College, where total enrollment rose 48%. Total enrollment at Fairleigh Dickinson University increased 9.4%, while Bergen Community College s enrollment rose 7.5% between 1997 and [Table 12] Within the State College and University sector, Education majors predominated at The College of New Jersey (TCNJ), Kean, and Rowan. At the other traditional institutions, including Ramapo, most students majored in Business, while at Thomas Edison most students majored in interdisciplinary studies. [Table 13] Not surprisingly, NJSCU s awarded most of their degrees in the disciplinary areas with the highest enrollments. Only Stockton and Paterson deviated from this pattern by awarded more degrees in the Social Sciences than in Business. [Table 15] iii
7 Most Bachelor s degree programs at TCNJ, Kean, and William Paterson are in Education, while at New Jersey City University (NJCU) and Richard Stockton programs in the Physical Sciences predominate. Bachelor s degree programs in the Social Sciences and Visual and Performing Arts are most common at Ramapo, Montclair, and Rowan. [Table 14] Reflecting their origins as teacher-training institutions, most Master s degree programs at the older, traditional NJSCU s are in Education. Only the newer (Ramapo and Stockton) or non-traditional (Edison) institutions deviate from this pattern. [Table 16] At seven of the nine NJSCU s (including Ramapo), most Master s degrees are awarded in Education. Only Stockton (Health Professions) and Edison (Business) award most of their Master s degrees in other fields. [Table 17] Ramapo s tuition ranks third in the state college and university sector behind the College of New Jersey and Rowan University. It is $278 above the mean for the state college sector, and $666 above Kean s tuition (which is the lowest in the sector). [Table 18] Between and , Ramapo s tuition rose 39.8%, which is the third highest increase in the state college and university sector behind Richard Stockton College and Rowan University. However, between and , Ramapo s tuition increase (6%) was the second lowest in the sector. Only Kean s 5.9% increase was lower. [Table 18] The Economy and Public Support for Higher Education Employment opportunities in Bergen County were expected to grow, most, between 1996 and 2006 in the following occupational areas: Computer Systems/Science (+5,350 positions), Marketing and Sales (+4,600 positions), Health Services (+4,150 positions), Executive/Managerial (+3,700), Administrative Support (+3,700), and K- 12 Teachers (+2,100). [Table 17] Statewide, unemployment was at 5.5% in March The unemployment rate in Bergen County was slightly below the stateside figure at 4.7%. Unemployment was especially high in the Jersey City and Passaic labor areas in northern New Jersey, and in the Atlantic City and Vineland labor areas in the southern part of the State. [Table 20] Students can expect to bear a greater portion of the cost of their education in coming years. While the new administration in Trenton may want to give more support to iv
8 higher education, 2 the anticipated declines in State revenue related to recession and the events of September 2001 may make this wish and impossibility. 3 State support declined from 54.0% of annual revenues in FY92, to 39.0% of annual revenues in FY02. This trend is not expected to change in the foreseeable future. [Figure 1] The annual shortfall in State appropriations has increased steadily since FY92. The gap widened at a much faster pace between FY98 and FY02 than it did in fiscal years before FY98. [Figure 2] 2 In February 2002, Governor McGreevey signed an Executive Order creating a Governor s Education Cabinet. Six college presidents were appointed to the Cabinet, as well as the Chair of the Rutgers University Board of Governors. 3 In his Budget Address to the New Jersey legislature, Governor McGreevey reported that closing a $3 billion shortfall in FY02, and a $6 billion shortfall in FY03, would require tough choices and tough measures. v
9 DATA TABLES AND CHARTS
10 TABLE 1: POPULATION TRENDS FOR NEW JERSEY (AND SELECTED NEW YORK) COUNTIES Percent Percent Change Change New Jersey Counties Number Number Number Number Number 60 to to 00 Atlantic 160, , , , , % 12.6% Bergen 780, , , , , % 7.1% Burlington 224, , , , , % 7.2% Camden 392, , , , , % 1.2% Cape May 48,555 59,554 82,266 95, , % 7.6% Cumberland 106, , , , , % 6.1% Essex 923, , , , , % 2.0% Gloucester 134, , , , , % 10.7% Hudson 610, , , , , % 10.1% Hunterdon 54,107 69,718 87, , , % 13.2% Mercer 266, , , , , % 7.7% Middlesex 433, , , , , % 11.7% Monmouth 334, , , , , % 11.2% Morris 261, , , , , % 11.6% Ocean 108, , , , , % 17.9% Passaic 406, , , , , % 7.9% Salem 58,711 60,346 64,676 65,294 64, % -1.5% Somerset 143, , , , , % 23.8% Sussex 49,255 77, , , , % 10.1% Union 504, , , , , % 5.8% Warren 63,220 73,879 84,429 91, , % 11.8% TOTAL 6,066,782 7,168,164 7,365,011 7,730,188 8,414, % 8.9% Percent Percent Change Change Selected New York Counties Number Number Number Number Number 60 to to 00 Orange 183, , , , , % 11.0% Rockland 136, , , , , % 8.0% Westchester 808, , , , , % 5.6% Bronx 1,424,815 1,471,701 1,168,972 1,203,789 1,332, % 10.7% Kings (Brooklyn) 2,627,319 2,602,012 2,230,936 2,300,664 2,465, % 7.2% New York (Manhattan) 1,698,281 1,539,233 1,428,285 1,487,536 1,537, % 3.3% Queens 1,809,578 1,986,473 1,891,325 1,951,598 2,229, % 14.2% Richmond (Staten Island) 221, , , , , % 17.1% Nassau 1,300,171 1,428,080 1,321,582 1,287,348 1,334, % 3.7% Suffolk 666,784 1,124,950 1,284,231 1,321,864 1,419, % 7.4% Total Rest of State 5,903,937 6,443,411 6,494,888 6,610,691 6,662, % 0.8% TOTAL 16,782,304 18,236,967 17,558,072 17,990,455 18,976, % 5.5% 1
11
12 TABLE 2: POPULATION PROJECTIONS FOR NEW JERSEY (AND SELECTED NEW YORK) COUNTIES Actual Projected* Percent Percent Percent Change Change Change New Jersey Counties Number Number Number Number 00 to to to 15 Atlantic 252, , , , % 8.7% 14.0% Bergen 884, , , , % 5.1% 7.8% Burlington 423, , , , % 9.8% 14.5% Camden 508, , , , % 4.3% 6.2% Cape May 102, , , , % 4.2% 8.8% Cumberland 146, , , , % 1.7% 3.0% Essex 793, , , , % -0.8% 0.9% Gloucester 254, , , , % 9.2% 14.1% Hudson 608, , , , % -0.5% 2.5% Hunterdon 121, , , , % 14.7% 21.5% Mercer 350, , , , % 3.4% 6.3% Middlesex 750, , , , % 7.2% 12.1% Monmouth 615, , , , % 11.4% 16.1% Morris 470, , , , % 10.7% 16.0% Ocean 510, , , , % 12.7% 21.2% Passaic 489, , , , % 3.0% 3.3% Salem 64,285 65,700 66,200 66, % 3.0% 3.9% Somerset 297, , , , % 17.2% 26.8% Sussex 144, , , , % 12.4% 18.8% Union 522, , , , % 1.6% 2.6% Warren 102, , , , % 9.2% 13.5% TOTAL 8,414,350 8,662,400 8,937,100 9,257, % 6.2% 10.0% Actual Projected** Percent Percent Percent Change Change Change Selected New York Counties Number** Number Number Number 90 to to to 15 Orange 307, , ,816 N/A 15.5% 20.9% N/A Rockland 265, , ,213 N/A 12.7% 15.0% N/A Westchester 874, , ,131 N/A -0.4% -0.8% N/A Bronx 1,203,789 1,291,671 1,297,407 N/A 7.3% 7.8% N/A Kings (Brooklyn) 2,300,664 2,372,339 2,364,992 N/A 3.1% 2.8% N/A New York (Manhattan) 1,487,536 1,576,967 1,572,215 N/A 6.0% 5.7% N/A Queens 1,951,598 1,965,846 1,976,791 N/A 0.7% 1.3% N/A Richmond (Staten Island) 378, , ,529 N/A 17.6% 22.3% N/A Nassau 1,287,348 1,298,525 1,280,131 N/A 0.9% -0.6% N/A Suffolk 1,321,864 1,498,904 1,528,028 N/A 13.4% 15.6% N/A Total Rest of State 6,610,691 6,889,167 6,955,913 N/A 4.2% 5.2% N/A TOTAL 17,990,455 18,865,318 18,984,166 N/A 4.9% 5.5% N/A * Source: New Jersey Department of Labor, Division of Labor Market & Demographic Research, January These projections have been adjusted to be consistent with the 2000 Census figures. ** Source: New York State Statistical Yearbook, Albany: Nelson A. Rockefeller Institute of Government, SUNY. Projections that are consistent with the 2000 Census figures are not yet available. 3
13
14 TABLE 3: TRENDS IN PUBLIC HIGH SCHOOL GRADUATES IN NEW JERSEY [1] Percent Percent Change Change New Jersey Counties [1] Number Number Number Number Number 94/95 to 98/99 97/98 to 98/99 Atlantic 2,140 2,155 2,182 1,795 1, % 5.3% Bergen 7,284 7,389 7,519 7,159 7, % 1.5% Burlington 3,672 3,747 3,845 3,589 3, % 5.3% Camden 4,738 4,509 4,618 4,315 4, % 3.7% Cape May % 2.8% Cumberland 1,265 1,239 1,346 1,248 1, % 1.6% Essex 5,709 5,707 5,779 5,607 5, % -2.6% Gloucester 2,421 2,513 2,646 4,586 2, % -44.7% Hudson 3,587 3,706 3,895 3,691 3, % 0.7% Hunterdon 1,095 1,050 1,377 1,025 1, % 6.6% Mercer 2,612 2,606 2,670 2,716 2, % 4.1% Middlesex 5,670 5,774 5,850 5,538 5, % 4.6% Monmouth 5,857 5,617 6,257 5,564 5, % 1.5% Morris 4,346 4,216 4,284 4,123 4, % 1.0% Ocean 3,890 3,835 4,055 3,917 4, % 3.1% Passaic 3,517 3,606 3,685 3,339 3, % 1.9% Salem % 4.3% Somerset 1,926 2,162 2,262 2,180 2, % -2.6% Sussex 1,541 1,497 1,548 1,409 1, % 10.3% Union 3,858 3,954 3,553 3,987 3, % -1.5% Warren % -0.8% TOTAL 67,403 67,704 70,028 68,148 67, % -1.1% [1] Source: Vital Education Statistics, to , New Jersey Department of Education. 5
15 TABLE 4: NEW JERSEY PUBLIC HIGH SCHOOL GRADUATES BY COUNTY AND ETHNICITY, [1] American Indian/ Asian/ Black, White, Alaskan Native Pacific Islander non-hispanic Hispanic non-hispanic Total County Number Row Pct. Number Row Pct. Number Row Pct. Number Row Pct. Number Row Pct. Number Atlantic 5 0.2% % % % 1, % 1,890 Bergen % 1, % % % 5, % 7,267 Burlington 6 0.2% % % % 2, % 3,780 Camden 3 0.1% % % % 3, % 4,477 Cape May 0 0.0% 5 0.7% % 8 1.0% % 765 Cumberland % % % % % 1,269 Essex % % 2, % % 2, % 5,459 Gloucester 2 0.1% % % % 2, % 2,535 Hudson 4 0.1% % % 1, % % 3,718 Hunterdon 3 0.3% % % % 1, % 1,093 Mercer 9 0.3% % % % 1, % 2,828 Middlesex 4 0.1% % % % 3, % 5,791 Monmouth % % % % 4, % 5,648 Morris % % % % 3, % 4,165 Ocean 8 0.2% % % % 3, % 4,040 Passaic 7 0.2% % % % 1, % 3,404 Salem 0 0.0% 4 0.6% % % % 688 Somerset 4 0.2% % % % 1, % 2,124 Sussex 0 0.0% % % % 1, % 1,554 Union 4 0.1% % 1, % % 1, % 3,927 Warren 0 0.0% % % % % 953 TOTALS % 4, % 9, % 7, % 45, % 67,369 [1] Source: Vital Education Statistics, Trenton: New Jersey State Department of Education. 6
16 TABLE 5: NEW JERSEY PUBLIC HIGH SCHOOL GRADUATES BY COUNTY AND SEX, [1] Female Male Total County Number Row Percent Number Row Percent Number Atlantic % % 1,890 Bergen 3, % 3, % 7,267 Burlington 1, % 1, % 3,780 Camden 2, % 2, % 4,477 Cape May % % 765 Cumberland % % 1,269 Essex 2, % 2, % 5,459 Gloucester 1, % 1, % 2,535 Hudson 1, % 1, % 3,718 Hunterdon % % 1,093 Mercer 1, % 1, % 2,828 Middlesex 2, % 2, % 5,791 Monmouth 2, % 2, % 5,648 Morris 2, % 2, % 4,165 Ocean 2, % 1, % 4,040 Passaic 1, % 1, % 3,404 Salem % % 688 Somerset 1, % 1, % 2,124 Sussex % % 1,554 Union 1, % 2, % 3,927 Warren % % 953 TOTALS 33, % 33, % 67,369 [1] Source: Vital Education Statistics, Trenton: New Jersey State Department of Education. 7
17 TABLE 6: PLANS FOR FURTHER EDUCATION BY COUNTY, NEW JERSEY PUBLIC HIGH SCHOOL GRADUATES, Total Number Number Percent No. Continuing Percent Total Percent of Public HS Continuing at of Total Other of Total Continuing of Total County Graduates Col. or Univ Graduates Education Graduates Education Graduates Atlantic 1,890 1, % % 1, % Bergen 7,267 6, % % 6, % Burlington 3,780 3, % % 3, % Camden 4,477 3, % % 3, % Cape May % % % Cumberland 1, % % % Essex 5,459 4, % % 4, % Gloucester 2,535 2, % % 2, % Hudson 3,718 2, % % 2, % Hunterdon 1, % % % Mercer 2,828 2, % % 2, % Middlesex 5,791 4, % % 4, % Monmouth 5,648 4, % % 4, % Morris 4,165 3, % % 3, % Ocean 4,040 3, % % 3, % Passaic 3,404 2, % % 2, % Salem % % % Somerset 2,124 1, % % 1, % Sussex 1,554 1, % % 1, % Union 3,927 2, % % 3, % Warren % % % TOTAL STATE 67,369 53, % 2, % 56, % * Source: Vital Education Statistics, Trenton: New Jersey Department of Education 8
18 TABLE 7: PLANS OF N.J. PUBLIC H.S. GRADUATES FOR IN- VERSUS OUT-OF-STATE STUDY, BY COUNTY, Total Number Number Percent Number Percent Number Percent of Public HS Continuing at of Total Continuing of Number Continuing of Number County Graduates Col. or Univ Graduates In-State Continuing Out-of-State Continuing Atlantic 1,890 1, % % % Bergen 7,267 6, % 3, % 3, % Burlington 3,780 3, % 1, % 1, % Camden 4,477 3, % 2, % 1, % Cape May % % % Cumberland 1, % % % Essex 5,459 4, % 2, % 1, % Gloucester 2,535 2, % 1, % % Hudson 3,718 2, % 2, % % Hunterdon 1, % % % Mercer 2,828 2, % 1, % 1, % Middlesex 5,791 4, % 3, % 1, % Monmouth 5,648 4, % 2, % 1, % Morris 4,165 3, % 1, % 1, % Ocean 4,040 3, % 2, % % Passaic 3,404 2, % 1, % % Salem % % % Somerset 2,124 1, % 1, % % Sussex 1,554 1, % % % Union 3,927 2, % 1, % 1, % Warren % % % TOTAL STATE 67,369 53, % 32, % 20, % * Source: Vital Education Statistics, Trenton: New Jersey Department of Education 9
19 TABLE 8: POST-SECONDARY INSTITUTIONS IN NEW JERSEY (AND SELECTED NEW YORK) COUNTIES Public Public Independent Nursing & College & Community/ Public College & Health Proprietary Percent University County Col. Vocational University Professions Schools County of State New Jersey Campuses Campuses Campuses Campuses [1] Campuses Campuses Total Total Atlantic % Bergen % Burlington % Camden [2] % Cape May % Cumberland % Essex [3] % Gloucester % Hudson % Hunterdon % Mercer % Middlesex [4] % Monmouth % Morris % Ocean % Passaic % Salem % Somerset % Sussex % Union % Warren % TOTAL STATE % Public Public Independent Nursing & College & Community/ Public College & Health Proprietary Percent University County Col. Vocational University Professions Schools County of State New York Campuses [5] Campuses Campuses Campuses [6] Campuses Campuses Total Total Orange % Rockland % Westchester % Bronx % Kings (Brooklyn) % New York (Manhattan) % Queens % Richmond (Staten Island) % Nassau % Suffolk % Total Rest of State % TOTAL STATE % [1] Includes theological schools and religious institutions. [2] Includes Rutgers-Camden, UMDNJ-Camden, and UMDNJ-Stratford. [3] Includes Rutgers-Newark. [4] Includes UMDNJ-Piscataway/New Brunswick. [5] Includes both two- and four-year institutions. [6] Includes both independent colleges and universities with a public mission and nursing or health professions schools. 10
20
21 TABLE 9: COLLEGE AVAILABILITY RATIOS BY NEW JERSEY COUNTY College Availability Public College Total 2000 Ratio 1 High School Availability County Campuses [1] Population (in thousands) [2] Graduates Ratio 2 [3] Atlantic 2 252, :1 1, :1 Bergen 4 884, :1 7, :1 Burlington 1 423, :1 3, :1 Camden 4 508, :1 4, :1 Cape May 0 102,326 N/A 765 N/A Cumberland 1 146, :1 1, :1 Essex 8 793,633 99:1 5, :1 Gloucester 2 254, :1 2, :1 Hudson 4 608, :1 3, :1 Hunterdon 0 121,989 N/A 1,093 N/A Mercer 6 350,761 58:1 2, :1 Middlesex 4 750, :1 5, :1 Monmouth 3 615, :1 5, :1 Morris 5 470,212 94:1 4, :1 Ocean 3 510, :1 4, :1 Passaic 2 489, :1 3, :1 Salem 1 64,285 64: :1 Somerset 1 297, :1 2, :1 Sussex 1 144, :1 1, :1 Union 2 522, :1 3, :1 Warren 2 102,137 51: :1 TOTAL STATE 56 8,414, :1 67, :1 [1] Includes public, independent, and religious/theological institutions. Excludes vocational, nursing, and proprietary schools. [2] The ratio of number of county residents per institution, calculated by dividing total county population by number of institutions (in thousands). Thus, a ratio of 206:1 means there are 206,000 county residents per higher education institution. [3] The ratio of number of county public h.s. graduates per institution, calculated by dividing total number of graduates per county by number of institutions. Thus, a ratio of 430:1 means there are 430 county public h.s. graduates per college/university. 12
22 TABLE 10: TRENDS IN UNDERGRADUATE ENROLLMENT AT NEW JERSEY INSTITUTIONS OF HIGHER EDUCATION Fall 1997 Fall 1998 Fall 1999 Fall 2000 Fall 2001 Percent Percent Change Change Institution Number Number Number Number Number 97 to to 01 NJ Institute of Technology 4,995 5,178 5,265 5,637 5, % 1.1% Rutgers University 35,712 36,290 37,112 37,528 38, % 1.6% U of Med. & Dentistry Of NJ 761 1, % -4.6% Subtotal 41,468 42,637 43,182 43,994 44, % 1.5% College of New Jersey 5,894 5,853 5,930 6,010 5, % -0.6% Kean University 9,634 9,510 9,228 9,300 9, % 1.8% Montclair State University 9,751 9,742 10,159 10,188 10, % 2.1% New Jersey City University 6,359 6,412 5,952 6,398 6, % -4.9% Ramapo College of NJ 4,681 4,658 4,655 4,906 4, % -0.3% Richard Stockton Col of NJ 6,040 5,895 5,975 5,976 6, % 2.7% Rowan University 8,055 8,173 8,389 8,051 8, % 3.7% Thomas Edison State Col 8,515 8,393 8,414 7,972 8, % 2.3% William Paterson Univ 7,878 8,071 8,270 8,454 8, % 4.8% Subtotal 66,807 66,707 66,972 67,255 68, % 1.6% Atlantic CC 5,522 4,987 4,811 5,162 5, % 6.2% Bergen CC 11,298 11,812 12,225 11,993 12, % 1.3% Brookdale CC 11,591 11,423 11,575 11,552 11, % 2.8% Burlington CC 5,817 5,735 5,733 6,122 6, % 1.0% Camden CC 11,935 11,785 11,821 12,131 12, % 3.6% Cumberland CC 2,406 2,485 2,662 2,735 2, % 1.2% Essex CC 8,130 8,353 8,921 8,868 9, % 7.6% Gloucester CC 4,701 4,612 4,752 4,669 4, % 4.9% Hudson CCC 4,161 4,174 4,460 4,854 5, % 8.9% Mercer CCC 8,117 7,974 7,843 7,751 8, % 4.9% Middlesex CC 10,458 10,268 10,331 10,398 10, % 3.9% CC of Morris 8,252 7,557 7,714 7,919 8, % 3.4% Ocean CC 7,458 7,195 7,256 7,143 7, % 4.3% Passaic CCC 3,712 4,017 4,354 4,633 5, % 10.7% Raritan Valley CC 5,487 5,612 5,439 5,751 5, % 1.4% Salem CC 1,125 1,127 1,244 1,166 1, % 5.4% Sussex CCC 2,308 2,248 2,339 2,286 2, % 8.5% Union CC 9,235 8,900 8,571 8,655 8, % 3.4% Warren CCC % 23.1% Subtotal 122, , , , , % 4.3% Bloomfield College 2,010 1,958 1,810 1,785 1, % -0.9% Caldwell College 1,716 1,768 1,816 1,844 1, % 4.3% Centenary College ,202 1, % 20.9% Drew University 1,542 1,526 1,485 1,537 1, % -0.1% Fairleigh Dickinson University 5,891 6,023 6,256 6,560 6, % -0.3% Felcian College 1,140 1,165 1,324 1,484 1, % 9.2% Georgian Court College 1,488 1,521 1,582 1,618 1, % 9.2% Monmouth University 4,063 4,056 4,004 4,194 4, % -0.4% Princeton University 4,721 4,752 4,672 4,663 4, % 1.7% Rider University 3,878 4,146 4,222 4,178 4, % 3.1% College of St. Elizabeth 1,403 1,353 1,351 1,337 1, % -6.4% St. Peter's College 3,211 2,973 2,762 2,687 2, % -3.8% Seton Hall University 5,532 5,718 5,465 5,403 5, % -5.4% Stevens Inst. of Technology 1,451 1,533 1,564 1,599 1, % 3.5% Subtotal 38,946 39,377 39,253 40,091 40, % 0.9% Berkeley College 1,980 2,035 1,960 1,994 2, % 7.5% Devry Institute 3,157 3,365 3,640 3,779 3, % 3.5% Gibbs College ,202 1, % 13.9% Subtotal 5,712 6,257 6,526 6,975 7, % 6.5% 13
23 TABLE 11: TRENDS IN GRADUATE ENROLLMENT AT NEW JERSEY INSTITUTIONS OF HIGHER EDUCATION Fall 1997 Fall 1998 Fall 1999 Fall 2000 Fall 2001 Percent Percent Change Change Institution Number Number Number Number Number 97 to to 01 NJ Institute of Technology 3,138 3,013 2,993 3,183 3, % -0.6% Rutgers University 12,629 12,368 12,353 12,196 12, % 0.1% U of Med. & Dentistry Of NJ 3,707 3,288 3,813 3,837 3, % 0.8% Subtotal 19,474 18,669 19,159 19,216 19, % 0.1% College of New Jersey % 2.8% Kean University 1,903 1,828 1,971 2,168 2, % 21.2% Montclair State University 3,100 3,014 3,126 3,314 3, % 4.1% New Jersey City University 2,144 2,132 2,072 1,944 2, % 40.8% Ramapo College of NJ % 6.9% Richard Stockton Col of NJ % -3.9% Rowan University 1,312 1,307 1,247 1,313 1, % 9.9% Thomas Edison State Col % 10.9% William Paterson Univ 1,329 1,313 1,488 1,491 1, % 7.6% Subtotal 11,028 10,965 11,381 11,871 13, % 14.2% Atlantic CC N/A N/A Bergen CC N/A N/A Brookdale CC N/A N/A Burlington CC N/A N/A Camden CC N/A N/A Cumberland CC N/A N/A Essex CC N/A N/A Gloucester CC N/A N/A Hudson CCC N/A N/A Mercer CCC N/A N/A Middlesex CC N/A N/A CC of Morris N/A N/A Ocean CC N/A N/A Passaic CCC N/A N/A Raritan Valley CC N/A N/A Salem CC N/A N/A Sussex CCC N/A N/A Union CC N/A N/A Warren CCC N/A N/A Subtotal N/A N/A Bloomfield College N/A N/A Caldwell College % 26.0% Centenary College % 48.1% Drew University % 0.8% Fairleigh Dickinson University 2,839 2,722 2,692 2,822 3, % 6.7% Felcian College % 61.7% Georgian Court College % 8.8% Monmouth University 1,274 1,304 1,421 1,442 1, % 9.2% Princeton University 1,751 1,762 1,768 1,884 1, % 2.1% Rider University 1,200 1,181 1,125 1,096 1, % 4.9% College of St. Elizabeth % -0.7% St. Peter's College % 7.4% Seton Hall University 4,586 4,641 4,631 4,517 4, % -0.6% Stevens Inst. of Technology 1,797 1,934 2,150 2,522 2, % 3.8% Subtotal 16,145 16,544 16,882 17,495 18, % 4.4% Berkeley College N/A N/A Devry Institute N/A N/A Gibbs College N/A N/A Subtotal N/A N/A 14
24 TABLE 12: TRENDS IN TOTAL ENROLLMENT AT NEW JERSEY INSTITUTIONS OF HIGHER EDUCATION Fall 1997 Fall 1998 Fall 1999 Fall 2000 Fall 2001 Percent Percent Change Change Institution Number Number Number Number Number 97 to to 01 NJ Institute of Technology 8,133 8,191 8,258 8,820 8, % 0.5% Rutgers University 48,341 48,658 49,465 49,724 50, % 1.3% U of Med. & Dentistry Of NJ 4,468 4,457 4,618 4,666 4, % -0.1% Subtotal 60,942 61,306 62,341 63,210 63, % 1.0% College of New Jersey 6,780 6,711 6,747 6,861 6, % -0.2% Kean University 11,537 11,338 11,199 11,468 12, % 5.5% Montclair State University 12,851 12,756 13,285 13,502 13, % 2.6% New Jersey City University 8,503 8,544 8,024 8,342 8, % 5.8% Ramapo College of NJ 4,821 4,812 4,868 5,195 5, % 0.1% Richard Stockton Col of NJ 6,205 6,157 6,298 6,312 6, % 2.3% Rowan University 9,367 9,480 9,636 9,364 9, % 4.5% Thomas Edison State Col 8,564 8,490 8,538 8,137 8, % 2.4% William Paterson Univ 9,207 9,384 9,758 9,945 10, % 5.2% Subtotal 77,835 77,672 78,353 79,126 81, % 3.5% Atlantic CC 5,522 4,987 4,811 5,162 5, % 6.2% Bergen CC 11,298 11,812 12,225 11,993 12, % 1.3% Brookdale CC 11,591 11,423 11,575 11,552 11, % 2.8% Burlington CC 5,817 5,735 5,733 6,122 6, % 1.0% Camden CC 11,935 11,785 11,821 12,131 12, % 3.6% Cumberland CC 2,406 2,485 2,662 2,735 2, % 1.2% Essex CC 8,130 8,353 8,921 8,868 9, % 7.6% Gloucester CC 4,701 4,612 4,752 4,669 4, % 4.9% Hudson CCC 4,161 4,174 4,460 4,854 5, % 8.9% Mercer CCC 8,117 7,974 7,843 7,751 8, % 4.9% Middlesex CC 10,458 10,268 10,331 10,398 10, % 3.9% CC of Morris 8,252 7,557 7,714 7,919 8, % 3.4% Ocean CC 7,458 7,195 7,256 7,143 7, % 4.3% Passaic CCC 3,712 4,017 4,354 4,633 5, % 10.7% Raritan Valley CC 5,487 5,612 5,439 5,751 5, % 1.4% Salem CC 1,125 1,127 1,244 1,166 1, % 5.4% Sussex CCC 2,308 2,248 2,339 2,286 2, % 8.5% Union CC 9,235 8,900 8,571 8,655 8, % 3.4% Warren CCC % 23.1% Subtotal 122, , , , , % 4.3% Bloomfield College 2,010 1,958 1,810 1,785 1, % -0.9% Caldwell College 1,827 1,964 2,066 2,094 2, % 6.9% Centenary College ,023 1,335 1, % 23.6% Drew University 2,310 2,369 2,379 2,412 2, % 0.2% Fairleigh Dickinson University 8,730 8,745 8,948 9,382 9, % 1.8% Felcian College 1,160 1,203 1,377 1,544 1, % 11.2% Georgian Court College 2,350 2,405 2,420 2,483 2, % 9.1% Monmouth University 5,337 5,360 5,425 5,636 5, % 2.1% Princeton University 6,472 6,514 6,440 6,547 6, % 1.8% Rider University 5,078 5,327 5,347 5,274 5, % 3.5% College of St. Elizabeth 1,791 1,793 1,810 1,771 1, % -5.0% St. Peter's College 3,698 3,512 3,280 3,282 3, % -1.7% Seton Hall University 10,118 10,359 10,096 9,920 9, % -3.2% Stevens Inst. of Technology 3,248 3,467 3,714 4,121 4, % 3.7% Subtotal 55,091 55,921 56,135 57,586 58, % 2.0% Berkeley College 1,980 2,035 1,960 1,994 2, % 7.5% Devry Institute 3,157 3,365 3,640 3,779 3, % 3.5% Gibbs College ,202 1, % 13.9% Subtotal 5,712 6,257 6,526 6,975 7, % 6.5% 15
25 TABLE 13: FALL 2000 UNDERGRADUATE ENROLLMENTS BY CIP CODE AT NEW JERSEY STATE COLLEGES AND UNIVERSITIES* CIP Code CIP Category Title CNJ KU MSU NJCU RCNJ RSCNJ RU TESC WPU Totals 03 Conservation and Renewable Natural Resources Area, Ethnic, and Cultural Studies Communications , Computer and Information Sciences , Education 1,630 2, , , Engineering Engineering-related Technologies Foreign Languages and Literatures Home Economics Law and Legal Studies English Language and Literature/Letters , Liberal Arts and Sciences, General Studies, and Humanities , , Biological Sciences/Life Sciences , Mathematics Multi/Interdisciplinary Studies 150 2,497 2, Parks, Recreation, Leisure, and Fitness Studies Philosophy and Religion Physical Sciences Psychology , Protective Services , Public Administration and Services , Social Sciences ,039 1,146 5, Precision Production Trades Visual and Performing Arts , Health Professions and Related Sciences , Business Management and Administrative Services 1,153 1,530 1, ,977 1,276 10, Major Undecided, Missing, or Other ,639 4,316 1,283 1,208 1, ,355 13,565 Totals 6,010 9,300 10,188 6,398 4,906 5,976 8,051 7,972 8,454 67,255 * Acronyms: CNJ=The College of New Jersey, KU=Kean University, MSU=Montclair State University, NJCU=New Jersey City University, RCNJ=Ramapo College of New Jersey, RSCNJ=Richard Stockton College of New Jersey, RU=Rowan University, TESC=Thomas Edison State College, WPU=William Paterson University
26 TABLE 14: INVENTORY OF BACHELOR'S DEGREE PROGRAMS BY CIP CODE AT NEW JERSEY STATE COLLEGES AND UNIVERSITIES* CIP Code CIP Category Title CNJ KU MSU NJCU RCNJ RSCNJ RU TESC WPU Totals 03 Conservation and Renewable Natural Resources Area, Ethnic, and Cultural Studies Communications Computer and Information Sciences Education Engineering Engineering-related Technologies Foreign Languages and Literatures Home Economics Law and Legal Studies English Language and Literature/Letters Liberal Arts and Sciences, General Studies, and Humanities Biological Sciences/Life Sciences Mathematics Multi/Interdisciplinary Studies Parks, Recreation, Leisure, and Fitness Studies Philosophy and Religion Physical Sciences Psychology Protective Services Public Administration and Services Social Sciences Precision Production Trades Visual and Performing Arts Health Professions and Related Sciences Business Management and Administrative Services Totals * Acronyms: CNJ=The College of New Jersey, KU=Kean University, MSU=Montclair State University, NJCU=New Jersey City University, RCNJ=Ramapo College of New Jersey, RSCNJ=Richard Stockton College of New Jersey, RU=Rowan University, TESC=Thomas Edison State College, WPU=William Paterson University. Source: Inventory of
27 TABLE 15: FY2000 BACHELOR'S DEGREES AWARDED BY CIP CODE AT NEW JERSEY STATE COLLEGES AND UNIVERSITIES* CIP Code CIP Category Title CNJ KU MSU NJCU RCNJ RSCNJ RU TESC WPU Totals 03 Conservation and Renewable Natural Resources Area, Ethnic, and Cultural Studies Communications Computer and Information Sciences Education , Engineering Engineering-related Technologies Foreign Languages and Literatures Home Economics Law and Legal Studies English Language and Literature/Letters Liberal Arts and Sciences, General Studies, and Humanities Biological Sciences/Life Sciences Mathematics Multi/Interdisciplinary Studies Parks, Recreation, Leisure, and Fitness Studies Philosophy and Religion Physical Sciences Psychology Protective Services Public Administration and Services Social Sciences , Precision Production Trades Visual and Performing Arts Health Professions and Related Sciences Business Management and Administrative Services ,101 Totals 1,250 1,621 1, ,456 1,639 1,021 1,281 11,648 * Acronyms: CNJ=The College of New Jersey, KU=Kean University, MSU=Montclair State University, NJCU=New Jersey City University, RCNJ=Ramapo College of New Jersey, RSCNJ=Richard Stockton College of New Jersey, RU=Rowan University, TESC=Thomas Edison State College, WPU=William Paterson University
28 TABLE 16: INVENTORY OF MASTER'S DEGREE PROGRAMS BY CIP CODE AT NEW JERSEY STATE COLLEGES AND UNIVERSITIES* CIP Code CIP Category Title CNJ KU MSU NJCU RCNJ RSCNJ RU TESC WPU Totals 03 Conservation and Renewable Natural Resources Communications Computer and Information Sciences Education Engineering Foreign Languages and Literatures Home Economics Law and Legal Studies English Language and Literature/Letters Liberal Arts and Sciences, General Studies, and Humanities Library Science/Librarianship Biological Sciences/Life Sciences Mathematics Multi/Interdisciplinary Studies Parks, Recreation, Leisure, and Fitness Studies Physical Sciences Psychology Protective Services Public Administration and Services Social Sciences Precision Production Trades Visual and Performing Arts Health Professions and Related Sciences Business Management and Administrative Services Totals * Acronyms: CNJ=The College of New Jersey, KU=Kean University, MSU=Montclair State University, NJCU=New Jersey City University, RCNJ=Ramapo College of New Jersey, RSCNJ=Richard Stockton College of New Jersey, RU=Rowan University, TESC=Thomas Edison State College, WPU=William Paterson University. Source: Inventory of
29 TABLE 17: FY 2000 MASTER'S DEGREES AWARDED BY CIP CODE AT NEW JERSEY STATE COLLEGES AND UNIVERSITIES* CIP Code CIP Category Title CNJ KU MSU NJCU RCNJ RSCNJ RU TESC WPU Totals 03 Conservation and Renewable Natural Resources Communications Computer and Information Sciences Education , Engineering Foreign Languages and Literatures Home Economics Law and Legal Studies English Language and Literature/Letters Liberal Arts and Sciences, General Studies, and Humanities Library Science/Librarianship Biological Sciences/Life Sciences Mathematics Multi/Interdisciplinary Studies Parks, Recreation, Leisure, and Fitness Studies 0 40 Physical Sciences Psychology Protective Services Public Administration and Services Social Sciences Precision Production Trades 0 50 Visual and Performing Arts Health Professions and Related Sciences Business Management and Administrative Services Totals ,291 * Acronyms: CNJ=The College of New Jersey, KU=Kean University, MSU=Montclair State University, NJCU=New Jersey City University, RCNJ=Ramapo College of New Jersey, RSCNJ=Richard Stockton College of New Jersey, RU=Rowan University, TESC=Thomas Edison State College, WPU=William Paterson University.
30 TABLE 18: TRENDS IN ANNUAL RESIDENT FULL-TIME UNDERGRADUATE TUITION CHARGES AT NEW JERSEY INSTITUTIONS Percent Percent Change Change Institution Number Number Number Number Number 96 to to 00 NJ Institute of Technology $4,958 $5,250 $5,508 $5,758 $6, % 6.9% Rutgers University $4,262 $4,562 $4,762 $5,000 $5, % 5.0% U of Med. & Dentistry Of NJ N/A N/A N/A N/A N/A N/A N/A Mean $4,610 $4,906 $5,135 $5,379 $5, % 6.0% College of New Jersey $3,791 $4,168 $4,445 $4,654 $5, % 7.9% Kean University $2,928 $3,213 $3,373 $3,542 $3, % 5.9% Montclair State University $2,980 $3,205 $3,365 $3,470 $3, % 10.0% New Jersey City University $2,865 $3,150 $3,330 $3,540 $3, % 7.6% Ramapo College of NJ $3,159 $3,413 $3,822 $4,166 $4, % 6.0% Richard Stockton Col of NJ $2,816 $3,104 $3,280 $3,600 $3, % 9.8% Rowan University $3,130 $3,420 $3,750 $4,140 $4, % 8.7% William Paterson Univ $2,832 $3,104 $3,320 $3,554 $3, % 8.0% Thomas Edison State Col N/A N/A N/A N/A N/A N/A N/A Mean $3,063 $3,347 $3,586 $3,833 $4, % 8.0% Atlantic CC $1,674 $1,674 $1,674 $1,674 $1, % 8.1% Bergen CC $1,962 $1,962 $2,021 $2,081 $2, % 2.9% Brookdale CC $2,168 $2,168 $2,250 $2,250 $2, % 4.0% Burlington CC $1,482 $1,482 $1,572 $1,572 $1, % 0.0% Camden CC $1,710 $1,710 $1,770 $1,770 $1, % 1.7% Cumberland CC $2,108 $2,100 $2,100 $2,100 $2, % 0.0% Essex CC $2,115 $2,115 $2,115 $2,160 $2, % 2.1% Gloucester CC $1,680 $1,680 $1,740 $1,800 $1, % 4.2% Hudson CCC $1,875 $1,875 $1,928 $1,928 $1, % 0.0% Mercer CCC $1,935 $1,935 $1,995 $2,055 $2, % 0.0% Middlesex CC $1,967 $1,967 $1,967 $2,025 $2, % 3.7% CC of Morris $2,010 $2,010 $2,010 $2,010 $2, % 0.0% Ocean CC $1,712 $1,712 $1,770 $1,800 $1, % 5.0% Passaic CCC $1,973 $1,905 $1,905 $1,905 $1, % 0.0% Raritan Valley CC $1,800 $1,800 $1,800 $1,860 $1, % 0.0% Salem CC $1,935 $1,935 $1,935 $1,935 $1, % 1.6% Sussex CCC $2,040 $2,040 $2,100 $1,950 $1, % 1.5% Union CC $2,085 $2,085 $2,085 $2,085 $2, % 0.0% Warren CCC $2,010 $2,010 $2,010 $2,010 $2, % 0.0% Mean $1,907 $1,903 $1,934 $1,946 $1, % 1.8% Bloomfield College $9,500 $9,900 $10,300 $10,800 $11, % 4.6% Caldwell College $10,800 $11,600 $12,400 $13,100 $14, % 7.6% Centenary College $12,900 $13,200 $13,800 $14,500 $15, % 4.1% Drew University $20,866 $21,702 $22,462 $23,472 $24, % 4.7% Fairleigh Dickinson University $13,280 $13,990 $14,732 $16,346 $17, % 6.9% Felcian College $9,660 $10,110 $10,560 $11,010 $11, % 4.1% Georgian Court College $10,926 $11,446 $12,134 $12,742 $13, % 7.0% Monmouth University $13,894 $14,520 $15,138 $15,758 $16, % 4.7% Princeton University $22,920 $23,820 $24,630 $25,430 $26, % 2.9% Rider University $15,120 $15,880 $16,520 $17,180 $17, % 4.7% College of St. Elizabeth $12,500 $13,000 $13,500 $14,000 $14, % 5.0% St. Peter's College $13,020 $14,100 $14,520 $15,240 $16, % 5.7% Seton Hall University $13,050 $13,830 $15,480 $16,410 $17, % 6.0% Stevens Inst. of Technology $19,120 $19,900 $20,890 $21,900 $22, % 4.9% Mean $14,111 $14,786 $15,505 $16,278 $17, % 5.1% Berkeley College $11,085 $11,475 $11,985 $12,585 $13, % 4.8% Devry Institute $7,280 $7,750 $8,250 $8,250 $8, % 5.9% Gibbs College $9,995 $9,995 $9,995 $11,997 $12, % 4.2% Mean $9,453 $9,740 $10,077 $10,944 $11, % 4.8% [1] Source: Summary table prepared by N.J. Commission on Higher Education from IPEDS form #14. 21
31 FIGURE 1: STATE SUPPORT AS A PERCENT OF REVENUES 55% 53% 54.0% 53.2% 54.0% 52.4% 51% 51.2% 49% 50.1% 47% 45% 46.4% 46.0% 43% 42.7% 41% 39% 39.4% 39.0% 37% 35% (est) 2002 (est)
32 $55,000 $50,000 FIGURE 2: STATE SUPPORT VS. TOTAL E&G (DOLLARS IN THOUSANDS) $46,512 $52,693 $53,794 $45,000 $42,089 $40,000 $37,143 $35,212 $35,000 $30,000 $29,058 $30,314 $31,778 $33,107 $33,309 $25,000 $26,458 $28,286 $29,655 $20,000 $20,570 $20,435 $21,802 $22,245 $21,885 $23,030 $22,609 $23,837 $15,000 $10,000 FY92 FY93 FY94 FY95 FY96 FY97 FY98 FY99 FY00 FY01 (est) FY02 (est) State Support Educational and General Expenditures
33 TABLE 19: ESTIMATED AND PROJECTED EMPLOYMENT BY OCCUPATION, BERGEN COUNTY [1] Change Percent Change Occupations to to 2006 TOTAL, ALL OCCUPATIONS 466, ,900 44, % Executive, Administrative, & Managerial 28,400 32,100 3, % Professional Specialty 92, ,650 18, % e.g. Accounting 7,200 7, % e.g. Personnel 1,750 2, % e.g. Management Support 4,400 5, % e.g. Computer Systems Analysts & Scientists 8,850 14,200 5, % e.g. Social Science Workers 3,100 4, % e.g. Teachers & Instructors (K-12) 16,100 18,250 2, % e.g. Engineers 5,850 7,350 1, % e.g. Therapists 1,200 1, % e.g. Health Care & Treatment (incl. Nursing) 10,050 11,750 1, % e.g. Other Health Professionals/Technicians 4,100 5,300 1, % e.g. Writers, Artists, Communications, etc. 6,700 7,900 1, % Marketing & Sales 67,650 72,250 4, % Administrative Support (Clerical) 101, ,050 3, % Service 67,200 77,750 10, % e.g. Protective Services (incl. Fire & Police) 8,950 10,150 1, % e.g. Health Services (incl. Nurs. Aides) 8,900 13,050 4, % Agriculture, Forestry, & Fishing 3,150 3, % Production, Craft, & Repair 42,350 43,600 1, % Operators, Fabricators, & Laborers 63,950 65,750 1, % [1] Source: New Jersey Department of Labor ( 24
34 TABLE 20: UNEMPLOYMENT STATISTICS FOR NEW JERSEY, BY REGION, THROUGH FEBRUARY
35 APPENDIX
36
State of New Jersey
 OVERVIEW 1213 GRADE SPAN KG6 116946 GALLOWAY, NEW JERSEY 85 This school's academic performance is about average when compared to schools across the state. Additionally, its academic performance is very
Educational Attainment
 A Demographic and Socio-Economic Profile of Allen County, Indiana based on the 2010 Census and the American Community Survey Educational Attainment A Review of Census Data Related to the Educational Attainment
Status of Women of Color in Science, Engineering, and Medicine
 Status of Women of Color in Science, Engineering, and Medicine The figures and tables below are based upon the latest publicly available data from AAMC, NSF, Department of Education and the US Census Bureau.
Facts and Figures Office of Institutional Research and Planning
 Facts and Figures 2008-2009 Office of Institutional Research and Planning Office of Institutional Research Fall 2009 Facts at a Glance Credit Headcount Enrollments Headcount Ethnicity Headcount Percent
Iowa School District Profiles. Le Mars
 Iowa School District Profiles Overview This profile describes enrollment trends, student performance, income levels, population, and other characteristics of the public school district. The report utilizes
1.0 INTRODUCTION. The purpose of the Florida school district performance review is to identify ways that a designated school district can:
 1.0 INTRODUCTION 1.1 Overview Section 11.515, Florida Statutes, was created by the 1996 Florida Legislature for the purpose of conducting performance reviews of school districts in Florida. The statute
Higher Education. Pennsylvania State System of Higher Education. November 3, 2017
 November 3, 2017 Higher Education Pennsylvania s diverse higher education sector - consisting of many different kinds of public and private colleges and universities - helps students gain the knowledge
ESSEX COUNTY COLLEGE. INSTITUTIONAL PROFILE (Excellence and Accountability)
") ESSEX COUNTY COLLEGE INSTITUTIONAL PROFILE (Excellence and Accountability) Submitted to Commission on Higher Education September 28, 2009 Office of Planning, Research & Assessment Dr. J. Scott Drakulich
ESSEX COUNTY COLLEGE INSTITUTIONAL PROFILE (Excellence and Accountability) Submitted to Commission on Higher Education September 28, 2009 Office of Planning, Research & Assessment Dr. J. Scott Drakulich
MAINE 2011 For a strong economy, the skills gap must be closed.
 For a strong economy, the skills gap must be closed. 62% 36% 26% By 2020, jobs requiring a career certificate or college degree Skills gap Too few students make it through college. MEMBER Maine adults
Graduate Division Annual Report Key Findings
 Graduate Division 2010 2011 Annual Report Key Findings Trends in Admissions and Enrollment 1 Size, selectivity, yield UCLA s graduate programs are increasingly attractive and selective. Between Fall 2001
EDUCATIONAL ATTAINMENT
 EDUCATIONAL ATTAINMENT By 2030, at least 60 percent of Texans ages 25 to 34 will have a postsecondary credential or degree. Target: Increase the percent of Texans ages 25 to 34 with a postsecondary credential.
Like much of the country, Detroit suffered significant job losses during the Great Recession.
 36 37 POPULATION TRENDS Economy ECONOMY Like much of the country, suffered significant job losses during the Great Recession. Since bottoming out in the first quarter of 2010, however, the city has seen
EDUCATIONAL ATTAINMENT
 EDUCATIONAL ATTAINMENT By 2030, at least 60 percent of Texans ages 25 to 34 will have a postsecondary credential or degree. Target: Increase the percent of Texans ages 25 to 34 with a postsecondary credential.
Why Graduate School? Deborah M. Figart, Ph.D., Dean, School of Graduate and Continuing Studies. The Degree You Need to Achieve TM
 Why Graduate School? Deborah M. Figart, Ph.D., Dean, School of Graduate and Continuing Studies Message from the Dean Prospective Graduate Students: As an economist, I want to relate how crucial it is for
A Guide to Finding Statistics for Students
 San Joaquin Valley Statistics http://pegasi.us/sjstats/ 1 of 2 6/12/2010 5:00 PM A Guide to Finding Statistics for Students CV Stats Home By Topic By Area About the Valley About this Site Population Agriculture
https://secure.aacte.org/apps/peds/print_all_forms.php?view=report&prin...
 1 of 35 4/25/2012 9:56 AM A» 2011 PEDS» Institutional Data inst id: 3510 Institutional Data A_1 Institutional Information This information will be used in all official references to your institution. Institution
Frank Phillips College. Accountability Report
 Frank Phillips College Accountability Report January 2016 Accountability System, January 2016 1 of 22 Participation - Key Measures Enrollment 1. Fall Headcount (Unduplicated) Fall 2000 Fall 2014 Fall 2015
Enrollment Trends. Past, Present, and. Future. Presentation Topics. NCCC enrollment down from peak levels
 Presentation Topics 1. Enrollment Trends 2. Attainment Trends Past, Present, and Future Challenges & Opportunities for NC Community Colleges August 17, 217 Rebecca Tippett Director, Carolina Demography
What Is The National Survey Of Student Engagement (NSSE)?
?") National Survey of Student Engagement (NSSE) 2000 Results for Montclair State University What Is The National Survey Of Student Engagement (NSSE)? US News and World Reports Best College Survey is due next
National Survey of Student Engagement (NSSE) 2000 Results for Montclair State University What Is The National Survey Of Student Engagement (NSSE)? US News and World Reports Best College Survey is due next
BARUCH COLLEGE THE CITY UNIVERSITY OF NEW YORK
 BARUCH COLLEGE OF THE CITY UNIVERSITY OF NEW YORK A PROPOSAL TO ESTABLISH AN UNDERGRADUATE DEGREE PROGRAM LEADING TO A BACHELOR OF ARTS DEGREE IN COMMUNICATION STUDIES (proposed Hegis 0699) EFFECTIVE FALL
Strategic Plan Dashboard Results. Office of Institutional Research and Assessment
 29-21 Strategic Plan Dashboard Results Office of Institutional Research and Assessment Binghamton University Office of Institutional Research and Assessment Definitions Fall Undergraduate and Graduate
Transportation Equity Analysis
 2015-16 Transportation Equity Analysis Each year the Seattle Public Schools updates the Transportation Service Standards and bus walk zone boundaries for use in the upcoming school year. For the 2014-15
SASKATCHEWAN MINISTRY OF ADVANCED EDUCATION
 SASKATCHEWAN MINISTRY OF ADVANCED EDUCATION Report March 2017 Report compiled by Insightrix Research Inc. 1 3223 Millar Ave. Saskatoon, Saskatchewan T: 1-866-888-5640 F: 1-306-384-5655 Table of Contents
THE ECONOMIC AND SOCIAL IMPACT OF APPRENTICESHIP PROGRAMS
 THE ECONOMIC AND SOCIAL IMPACT OF APPRENTICESHIP PROGRAMS March 14, 2017 Presentation by: Frank Manzo IV, MPP Illinois Economic Policy Institute fmanzo@illinoisepi.org www.illinoisepi.org The Big Takeaways
Junior (61-90 semester hours or quarter hours) Two-year Colleges Number of Students Tested at Each Institution July 2008 through June 2013
 Two-year Colleges Number of Students Tested at Each Institution July 2008 through June 2013") Number of Students Tested at Each Institution July 2008 through June 2013 List of Institutions Number of School Name Students AIKEN TECHNICAL COLLEGE, SC 119 ARKANSAS NORTHEASTERN COLLEGE, AR 66 ASHLAND
Number of Students Tested at Each Institution July 2008 through June 2013 List of Institutions Number of School Name Students AIKEN TECHNICAL COLLEGE, SC 119 ARKANSAS NORTHEASTERN COLLEGE, AR 66 ASHLAND
46 Children s Defense Fund
 Nationally, about 1 in 15 teens ages 16 to 19 is a dropout. Fewer than two-thirds of 9 th graders in Florida, Georgia, Louisiana and Nevada graduate from high school within four years with a regular diploma.
An Analysis of the El Reno Area Labor Force
 An Analysis of the El Reno Area Labor Force Summary Report for the El Reno Industrial Development Corporation and Oklahoma Department of Commerce David A. Penn and Robert C. Dauffenbach Center for Economic
U VA THE CHANGING FACE OF UVA STUDENTS: SSESSMENT. About The Study
 About The Study U VA SSESSMENT In 6, the University of Virginia Office of Institutional Assessment and Studies undertook a study to describe how first-year students have changed over the past four decades.
File Print Created 11/17/2017 6:16 PM 1 of 10
 Success - Key Measures Graduation Rate: 4-, 5-, and 6-Year 9. First-time, full-time entering, degree-seeking, students enrolled in a minimum of 12 SCH their first fall semester who have graduated from
The number of involuntary part-time workers,
 University of New Hampshire Carsey School of Public Policy CARSEY RESEARCH National Issue Brief #116 Spring 2017 Involuntary Part-Time Employment A Slow and Uneven Economic Recovery Rebecca Glauber The
NATIONAL CENTER FOR EDUCATION STATISTICS
 NATIONAL CENTER FOR EDUCATION STATISTICS Palm Desert, CA The Integrated Postsecondary Education Data System (IPEDS) is the nation s core postsecondary education data collection program. It is a single,
Moving the Needle: Creating Better Career Opportunities and Workforce Readiness. Austin ISD Progress Report
 Moving the Needle: Creating Better Career Opportunities and Workforce Readiness Austin ISD Progress Report 2013 A Letter to the Community Central Texas Job Openings More than 150 people move to the Austin
Research Update. Educational Migration and Non-return in Northern Ireland May 2008
 Research Update Educational Migration and Non-return in Northern Ireland May 2008 The Equality Commission for Northern Ireland (hereafter the Commission ) in 2007 contracted the Employment Research Institute
Peter N. Tabbot Phone: Summary of Qualifications. Professional Experience
 Peter N. Tabbot Phone: 973-400-6562 Email: ptabbot@rockawaytownship.org Summary of Qualifications 25 years of progressive supervisory experience in public health, including 17 as Health Officer 17 years
Serving Country and Community: A Study of Service in AmeriCorps. A Profile of AmeriCorps Members at Baseline. June 2001
 Serving Country and Community: A Study of Service in AmeriCorps Cambridge, MA Lexington, MA Hadley, MA Bethesda, MD Washington, DC Chicago, IL Cairo, Egypt Johannesburg, South Africa A Profile of AmeriCorps
Financial Plan. Operating and Capital. May2010
 10 Financial Plan Operating and Capital May2010 Published by: The Division of Planning and Budget Cornell University 440 Day Hall Ithaca, New York 14853 http://dpb.cornell.edu 607 255 0155 May 2010 Edited
Suggested Citation: Institute for Research on Higher Education. (2016). College Affordability Diagnosis: Maine. Philadelphia, PA: Institute for
. College Affordability Diagnosis: Maine. Philadelphia, PA: Institute for") MAINE Suggested Citation: Institute for Research on Higher Education. (2016). College Affordability Diagnosis: Maine. Philadelphia, PA: Institute for Research on Higher Education, Graduate School of Education,
MAINE Suggested Citation: Institute for Research on Higher Education. (2016). College Affordability Diagnosis: Maine. Philadelphia, PA: Institute for Research on Higher Education, Graduate School of Education,
Women, Minorities, and Persons with Disabilities in Science and Engineering
 2017 Women, Minorities, and Persons with Disabilities in Science and Engineering Emilda B. Rivers, Deputy Director National Center for Science and Engineering Statistics National Science Foundation www.nsf.gov/statistics
Continuing education and New Jersey school library media specialists
 Rowan University Rowan Digital Works Theses and Dissertations 8-2-1999 Continuing education and New Jersey school library media specialists Carole A. McKiernan Rowan University Follow this and additional
Higher Education Six-Year Plans
 Higher Education Six-Year Plans 2018-2024 House Appropriations Committee Retreat November 15, 2017 Tony Maggio, Staff Background The Higher Education Opportunity Act of 2011 included the requirement for
NATIONAL SURVEY OF STUDENT ENGAGEMENT
 NATIONAL SURVEY OF STUDENT ENGAGEMENT (NSSE 2004 Results) Perspectives from USM First-Year and Senior Students Office of Academic Assessment University of Southern Maine Portland Campus 780-4383 Fall 2004
BARUCH RANKINGS: *Named Standout Institution by the
 THE BARUCH VALUE BARUCH RANKINGS: *#1 in CollegeNET s annual Social Mobility Index (out of over 900 colleges) for a second year in a row. *Named Standout Institution by the Baruch Background Baruch College
SAT Results December, 2002 Authors: Chuck Dulaney and Roger Regan WCPSS SAT Scores Reach Historic High
 ABOUT THE SAT 2001-2002 SAT Results December, 2002 Authors: Chuck Dulaney and Roger Regan WCPSS SAT Scores Reach Historic High The Scholastic Assessment Test (SAT), more formally known as the SAT I: Reasoning
Trends in College Pricing
 Trends in College Pricing 2009 T R E N D S I N H I G H E R E D U C A T I O N S E R I E S T R E N D S I N H I G H E R E D U C A T I O N S E R I E S Highlights Published Tuition and Fee and Room and Board
Coming in. Coming in. Coming in
 212-213 Report Card for Glenville High School SCHOOL DISTRICT District results under review by the Ohio Department of Education based upon 211 findings by the Auditor of State. Achievement This grade combines
Financing Education In Minnesota
 Financing Education In Minnesota 2016-2017 Created with Tagul.com A Publication of the Minnesota House of Representatives Fiscal Analysis Department August 2016 Financing Education in Minnesota 2016-17
An Empirical Analysis of the Effects of Mexican American Studies Participation on Student Achievement within Tucson Unified School District
 An Empirical Analysis of the Effects of Mexican American Studies Participation on Student Achievement within Tucson Unified School District Report Submitted June 20, 2012, to Willis D. Hawley, Ph.D., Special
Invest in CUNY Community Colleges
 Invest in Opportunity Invest in CUNY Community Colleges Pat Arnow Professional Staff Congress Invest in Opportunity Household Income of CUNY Community College Students
Effective Recruitment and Retention Strategies for Underrepresented Minority Students: Perspectives from Dental Students
 Critical Issues in Dental Education Effective Recruitment and Retention Strategies for Underrepresented Minority Students: Perspectives from Dental Students Naty Lopez, Ph.D.; Rose Wadenya, D.M.D., M.S.;
A Snapshot of the Graduate School
 A Snapshot of the Graduate School Prepared for the Research Council February 6, 2009 John R. Mullin, Ph.D., FAICP Dean of the Graduate School University of Massachusetts Amherst Graduate School Purpose
2012 ACT RESULTS BACKGROUND
 Report from the Office of Student Assessment 31 November 29, 2012 2012 ACT RESULTS AUTHOR: Douglas G. Wren, Ed.D., Assessment Specialist Department of Educational Leadership and Assessment OTHER CONTACT
Communities in Schools of Virginia
 Communities in Schools of Virginia General Information Contact Information Nonprofit Communities in Schools of Virginia Address 413 Stuart Circle, Unit 303 Richmond, VA 23220 Phone 804 237-8909 Fax 804
Update Peer and Aspirant Institutions
 Update Peer and Aspirant Institutions Prepared for Southern University at Shreveport January 2015 In the following report, Hanover Research describes the methodology used to identify Southern University
Teacher Supply and Demand in the State of Wyoming
 Teacher Supply and Demand in the State of Wyoming Supply Demand Prepared by Robert Reichardt 2002 McREL To order copies of Teacher Supply and Demand in the State of Wyoming, contact McREL: Mid-continent
Student Support Services Evaluation Readiness Report. By Mandalyn R. Swanson, Ph.D., Program Evaluation Specialist. and Evaluation
 Student Support Services Evaluation Readiness Report By Mandalyn R. Swanson, Ph.D., Program Evaluation Specialist and Bethany L. McCaffrey, Ph.D., Interim Director of Research and Evaluation Evaluation
New Jersey Institute of Technology Newark College of Engineering
 New Jersey Institute of Technology Newark College of Engineering AND IN ELECTRICAL AND COMPUTER ENGINEERING Program Review Last Update: Nov. 23, 2005 MISSION STATEMENTS DOCTOR OF PHILOSOPHY IN ELECTRICAL
Global Television Manufacturing Industry : Trend, Profit, and Forecast Analysis Published September 2012
 Industry 2012-2017: Published September 2012 Lucintel, a premier global management consulting and market research firm creates your equation for growth whether you need to understand market dynamics, identify
Data Glossary. Summa Cum Laude: the top 2% of each college's distribution of cumulative GPAs for the graduating cohort. Academic Honors (Latin Honors)
") Institutional Research and Assessment Data Glossary This document is a collection of terms and variable definitions commonly used in the universities reports. The definitions were compiled from various
Institutional Research and Assessment Data Glossary This document is a collection of terms and variable definitions commonly used in the universities reports. The definitions were compiled from various
Supply and Demand of Instructional School Personnel
 Supply and Demand of Instructional School Personnel Presentation to the 82 nd Annual Virginia Middle and High School Principals Conference and Exposition Mrs. Patty S. Pitts Assistant Superintendent of
Price Sensitivity Analysis
 Executive Summary The present study set out to determine whether relationships existed between the change in tuition rates, tuition and fees rates, and tuition, fees, and room and board rates at Illinois
SERVICE RETIREMENTS ACKERLY,GEORGE C MAX MORRIS COUNTY ACOSTA,AURELIA MAX JERSEY CITY PUBLIC SCHOOLS
 S T A T E O F N E W J E R S E Y DEPARTMENT OF THE TREASURY DIVISION OF PENSIONS AND BENEFITS BOARD LIST FOR MAY 18, 2016 PUBLIC EMPLOYEES' RETIREMENT SYSTEM SERVICE RETIREMENTS EFFECTIVE OPTION/ SERVICE
FY STATE AID ALLOCATIONS AND BUDGET POLICIES
 Attachment FC 4 FY 2013-14 STATE AID ALLOCATIONS AND BUDGET POLICIES STATE BOARD OF COMMUNITY COLLEGES DIVISION OF FINANCE AND OPERATIONS AUGUST 16, 2013 SBCC 08/16/2013 Version 1.0 Document Revision History
Cooper Upper Elementary School
 LIVONIA PUBLIC SCHOOLS http://cooper.livoniapublicschools.org 215-216 Annual Education Report BOARD OF EDUCATION 215-16 Colleen Burton, President Dianne Laura, Vice President Tammy Bonifield, Secretary
ACHE DATA ELEMENT DICTIONARY as of October 6, 1998
 ACHE DATA ELEMENT DICTIONARY as of October 6, 1998 Element Title: Reference Numbers: Institution FICE Code FICE ST010, GR010 The identification number for each reporting institution will be the institution's
A Comparison of the ERP Offerings of AACSB Accredited Universities Belonging to SAPUA
 Association for Information Systems AIS Electronic Library (AISeL) SAIS 2004 Proceedings Southern (SAIS) 3-1-2004 A Comparison of the ERP Offerings of AACSB Accredited Universities Belonging to SAPUA Ronald
Los Angeles City College Student Equity Plan. Signature Page
 Los Angeles City College Student Equity Plan Signature Page Los Angeles Community College Los Angeles City College President, Board of Trustees Date District Chancellor: College President: Academic Senate
Updated: December Educational Attainment
 Updated: Educational Attainment Among 25- to 29-year olds, the proportions who have attained a high school education, some college, or a bachelor s degree are all rising, according to longterm trends.
TRENDS IN. College Pricing
 2008 TRENDS IN College Pricing T R E N D S I N H I G H E R E D U C A T I O N S E R I E S T R E N D S I N H I G H E R E D U C A T I O N S E R I E S Highlights 2 Published Tuition and Fee and Room and Board
Welcome. Paulo Goes Dean, Eller College of Management Welcome Our region
 Welcome. Paulo Goes Dean, Welcome. Our region Outlook for Tucson Patricia Feeney Executive Director, Southern Arizona Market Chase George W. Hammond, Ph.D. Director, University of Arizona 1 Visit the award-winning
NATIONAL SURVEY OF STUDENT ENGAGEMENT
 NATIONAL SURVEY OF STUDENT ENGAGEMENT (NSSE 2002) Perspectives from USM First-Year and Senior Students Office of Academic Assessment University of Southern Maine Portland Campus 780-4383 January 2003 NSSE:
Australia s tertiary education sector
 Australia s tertiary education sector TOM KARMEL NHI NGUYEN NATIONAL CENTRE FOR VOCATIONAL EDUCATION RESEARCH Paper presented to the Centre for the Economics of Education and Training 7 th National Conference
John F. Kennedy Middle School
 John F. Kennedy Middle School CUPERTINO UNION SCHOOL DISTRICT Steven Hamm, Principal hamm_steven@cusdk8.org School Address: 821 Bubb Rd. Cupertino, CA 95014-4938 (408) 253-1525 CDS Code: 43-69419-6046890
A Diverse Student Body
 A Diverse Student Body No two diversity plans are alike, even when expressing the importance of having students from diverse backgrounds. A top-tier school that attracts outstanding students uses this
About the College Board. College Board Advocacy & Policy Center
 15% 10 +5 0 5 Tuition and Fees 10 Appropriations per FTE ( Excluding Federal Stimulus Funds) 15% 1980-81 1981-82 1982-83 1983-84 1984-85 1985-86 1986-87 1987-88 1988-89 1989-90 1990-91 1991-92 1992-93
BASIC EDUCATION IN GHANA IN THE POST-REFORM PERIOD
 BASIC EDUCATION IN GHANA IN THE POST-REFORM PERIOD By Abena D. Oduro Centre for Policy Analysis Accra November, 2000 Please do not Quote, Comments Welcome. ABSTRACT This paper reviews the first stage of
Trends in Tuition at Idaho s Public Colleges and Universities: Critical Context for the State s Education Goals
 1 Trends in Tuition at Idaho s Public Colleges and Universities: Critical Context for the State s Education Goals June 2017 Idahoans have long valued public higher education, recognizing its importance
Shelters Elementary School
 Shelters Elementary School August 2, 24 Dear Parents and Community Members: We are pleased to present you with the (AER) which provides key information on the 23-24 educational progress for the Shelters
Queens University of Charlotte
 IHE Bachelor Performance Report Queens University of Charlotte 2004-2005 Overview of the Institution Queens University of Charlotte, located in Charlotte, North Carolina, is a private, co-educational,
SCHOOL. Wake Forest '93. Count
 Count ID 43 256 VALID N 256 Q.1A ACTIVITIES YEAR FOLLOWING GRADUATION? Primary Employed full-time 157 61.6% Employed part-time 12 4.7% Unemployed, by choice 3 1.2% Unemployed, seeking employment 7 2.7%
A Guide to Adequate Yearly Progress Analyses in Nevada 2007 Nevada Department of Education
 A Guide to Adequate Yearly Progress Analyses in Nevada 2007 Nevada Department of Education Note: Additional information regarding AYP Results from 2003 through 2007 including a listing of each individual
San Francisco County Weekly Wages
 San Francisco County Weekly Wages Focus on Post-Recession Recovery Q 3 205 Update Produced by: Marin Economic Consulting March 6, 206 Jon Haveman, Principal 45-336-5705 or Jon@MarinEconomicConsulting.com
Massachusetts Juvenile Justice Education Case Study Results
 Massachusetts Juvenile Justice Education Case Study Results Principal Investigator: Thomas G. Blomberg Dean and Sheldon L. Messinger Professor of Criminology and Criminal Justice Prepared by: George Pesta
DUAL ENROLLMENT ADMISSIONS APPLICATION. You can get anywhere from here.
 DUAL ENROLLMENT ADMISSIONS APPLICATION SM You can get anywhere from here. Please print or type: DUAL ENROLLMENT APPLICATION Last Name First Name Maiden/Middle Social Security # Local Address (include apt.
An Introduction to School Finance in Texas
 An Introduction to School Finance in Texas May 12, 2010 Sheryl Pace TTARA Research Foundation space@ttara.org (512) 472-8838 Texas Public Education System 1,300 school districts (#1 in the nation) 1,025
Educational Management Corp Chef s Academy
 Educational Management Corp Chef s Academy Morrisville, North Carolina (Raleigh MSA) Exclusively Offered By: Porthaven Partners 8908 S. Yale Ave. Suite 400 Tulsa, OK 74137 Ryan Carter Partner P: 918.496.1464
Institutional Report. Spring 2014 CLA+ Results. Barton College. cla+
 Spring 2014 CLA+ Results Institutional Report cla+ TABLE OF CONTENTS Your Results 1 Summary Results, by Class p. 2 2 Distribution of Mastery Levels p. 3 3 Value-Added Estimates p. 4 4 CLA+ Subscores p.
JOB OUTLOOK 2018 NOVEMBER 2017 FREE TO NACE MEMBERS $52.00 NONMEMBER PRICE NATIONAL ASSOCIATION OF COLLEGES AND EMPLOYERS
 NOVEMBER 2017 FREE TO NACE MEMBERS $52.00 NONMEMBER PRICE JOB OUTLOOK 2018 NATIONAL ASSOCIATION OF COLLEGES AND EMPLOYERS 62 Highland Avenue, Bethlehem, PA 18017 www.naceweb.org 610,868.1421 TABLE OF CONTENTS
Lucintel. Publisher Sample
 Lucintel http://www.marketresearch.com/lucintel-v2747/ Publisher Sample Phone: 800.298.5699 (US) or +1.240.747.3093 or +1.240.747.3093 (Int'l) Hours: Monday - Thursday: 5:30am - 6:30pm EST Fridays: 5:30am
Culture, Tourism and the Centre for Education Statistics: Research Papers
 Catalogue no. 81-595-M Culture, Tourism and the Centre for Education Statistics: Research Papers Salaries and SalaryScalesof Full-time Staff at Canadian Universities, 2009/2010: Final Report 2011 How to
Trends in Higher Education Series. Trends in College Pricing 2016
 Trends in Higher Education Series Trends in College Pricing 2016 See the Trends in Higher Education website at trends.collegeboard.org for figures and tables in this report and for more information and
A Comparison of State of Florida Charter Technical Career Centers to District Non-Charter Career Centers,
 A Comparison of State of Florida Charter Technical Career to District Non-Charter Career, 2013-14 At a Glance In school year 2013-14, there were 4,502 students enrolled in the state of Florida s charter
4.0 CAPACITY AND UTILIZATION
 4.0 CAPACITY AND UTILIZATION The capacity of a school building is driven by four main factors: (1) the physical size of the instructional spaces, (2) the class size limits, (3) the schedule of uses, and
CAMPUS PROFILE MEET OUR STUDENTS UNDERGRADUATE ADMISSIONS. The average age of undergraduates is 21; 78% are 22 years or younger.
 CAMPUS PROFILE MEET OUR STUDENTS Freshmen are defined here as all domestic students entering in fall quarter from high school. These statistics include information drawn from records available at UC Davis.
University of Arizona
 Annual Report Submission View Questionnaire (Edit) University of Arizona Annual Report Submission for the year 2009. Report has been submitted 1 times. Report was last submitted on 11/30/2009 7:12:09 PM.
Creating Collaborative Partnerships: The Success Stories and Challenges
 Creating Collaborative Partnerships: The Success Stories and Challenges Community College Center of Excellence Building a World Class Workforce Through Community College Partnerships Cari Mallory National
Lesson M4. page 1 of 2
 Lesson M4 page 1 of 2 Miniature Gulf Coast Project Math TEKS Objectives 111.22 6b.1 (A) apply mathematics to problems arising in everyday life, society, and the workplace; 6b.1 (C) select tools, including
Descriptive Summary of Beginning Postsecondary Students Two Years After Entry
 NATIONAL CENTER FOR EDUCATION STATISTICS Statistical Analysis Report June 994 Descriptive Summary of 989 90 Beginning Postsecondary Students Two Years After Entry Contractor Report Robert Fitzgerald Lutz
Race, Class, and the Selective College Experience
 Race, Class, and the Selective College Experience Thomas J. Espenshade Alexandria Walton Radford Chang Young Chung Office of Population Research Princeton University December 15, 2009 1 Overview of NSCE
Segmentation Study of Tulsa Area Higher Education Needs Ages 36+ March Prepared for: Conducted by:
 Segmentation Study of Tulsa Area Higher Education Needs Ages 36+ March 2004 * * * Prepared for: Tulsa Community College Tulsa, OK * * * Conducted by: Render, vanderslice & Associates Tulsa, Oklahoma Project
PROGRAM REVIEW A PROCESS FOR SELF-EVALUATION AND CONTINUOUS IMPROVEMENT HOTEL/RESTAURANT/HOSPITALITY MANAGEMENT. 1 P a g e
 PROGRAM REVIEW A PROCESS FOR SELF-EVALUATION AND CONTINUOUS IMPROVEMENT HOTEL/RESTAURANT/HOSPITALITY MANAGEMENT 1 P a g e CONTENTS List of Tables...3 Program Review Team..4 Overview.5 Focus on Students.7