College & Career Ready and Individual Student Growth
|
|
|
- Ginger Armstrong
- 5 years ago
- Views:
Transcription

1 College & Career Ready and Individual Student Growth Annual Report to the School Board and Community Beaverton School District October 8, 2012 Table of Contents Purpose....2 Summary of Findings What is College and Career Ready? What is Individual Student Growth? Which Students are Included in the Data? Key Questions and Findings Indicator Key Question Pg 1 To what extent are students attaining college and career readiness benchmarks? 12 2 How has student attainment of college and career readiness benchmarks changed over time? 22 3 To what extent are students meeting targets for individual student growth? 26 4 How has student attainment of targets for individual student growth changed over time? 39 5 How does student attainment of college and career readiness benchmarks and 42 targets for individual student growth vary by school poverty level? 6 What progress has the District made in closing achievement and growth gaps? 46 Process for Establishing BSD College and Career Readiness Benchmarks Beaverton School District Individual Student Growth Model and Targets Data Sources and Acknowledgements School Board Goal for : All students will show continuous progress toward their personal learning goals, developed in collaboration with teachers and parents, and will be prepared for post-secondary education and career success. The Beaverton School District recognizes the diversity and worth of all individuals and groups. It is the policy of the Beaverton School District that there will be no discrimination or harassment of individuals or groups based on race, color, religion, gender, sexual orientation, gender identity, gender expression, national origin, marital status, age, veterans'' status, genetic information or disability in any educational programs, activities or employment. 1
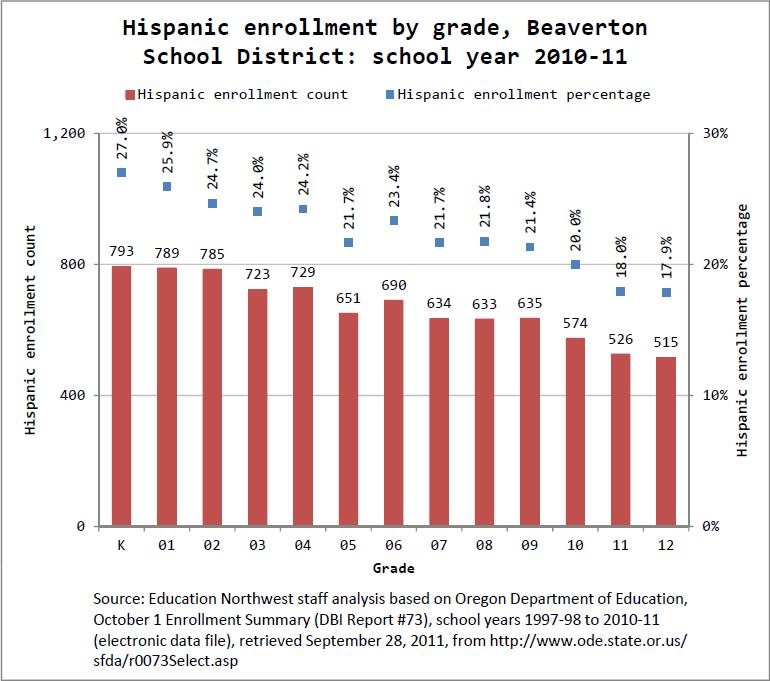
2 Purpose The District s goal for student achievement is that all students will show continuous progress toward their personal learning goals, developed in collaboration with teachers and parents, and will be prepared for post-secondary education and career success. This goal is aligned with the educational reform agenda recently outlined by the Governor. The state s educational goal is for 40% of students graduate with a four year college degree and 40% earn an associate s degree or postsecondary credential by All students are to complete high school as shown in the graphic below. Attainment of this goal should be reflective of all demographic populations of Oregon As their highest level of educational attainment: 20% 40% 40% 40% of adult Oregonians have earned a bachelor's degree or higher (now 30%) 40% of adult Oregonians have earned an associate s degree or postsecondary credential (now 18%) 20% of all adult Oregonians have earned at least a high school diploma, an extended or modified diploma, or the equivalent of a diploma (now 42%) To achieve this goal, districts in Oregon, including Beaverton, must increase the number of graduates who are college and career ready. At the same time, the demographics of the Beaverton School District are changing. An increasing percentage of student in the District are from demographic groups that have traditionally had lower percentages of students who graduate college and career ready. The two graphs below illustrate 1) how the percentage of Hispanic students enrolled in the District has tripled in the last thirteen years and 2) that the percentage of Hispanic students is likely to continue to grow as the percentage of students who are Hispanic is much higher in early grades than later grades. 2
3 3
4 Over the past decade, the percentage of students who are economically disadvantaged (eligible for free or reduced price lunch) has increased from 24% to 40%, a 67% increase. These changing demographics pose an additional challenge to the District. The increasing percentage of students from groups who have traditionally performed below the all students group requires the District to redouble efforts to foster college and career readiness for all students. A strategic plan adopted by the School Board enumerates the core strategies that will contribute to achievement of college and career readiness for all students. The Board has also identified data points in the form of a balanced scorecard that are used to monitor progress toward achievement of these goals. Four data points relate directly to student achievement: Individual Student Achievement Baseline % of College and Career Ready (CCR) graduates 27.3% 27.0% 27.5% % of students on track to be College and Career Ready (CCR) graduates % 50.3% 50.0% Students demonstrate learning readiness, individual growth and success % 43.4% 46.7% Academic success cannot be predicted by traditional demographic analysis (race, ethnicity, income, mobility, disability or initial proficiencies)** (The percentage point gap between the performance of all students and the performance of these demographic groups.) 22.3% 22.0% 21.5% 1 Note: College and Career Readiness targets and individual student growth targets increased for elementary and middle school reading between and This report to the Board and Community provides data related to these key indicators. 4
5 Summary of Findings Indicator Key Question and Findings 1 To what extent are students attaining college and career readiness benchmarks? Nearly half of Beaverton students (46.1%) meet all college and career readiness benchmarks for their grade level. The percentages of Black, Hispanic, Special Education, English Language Learners, Economically Disadvantaged, and Mobile students meeting college and career readiness benchmarks lag the corresponding percentages for all students in the District. Talented and Gifted students significantly outperform their peers at all StEPPs. 2 How has student attainment of college and career readiness benchmarks changed over time? Across all grades, the percentage of students meeting StEPP targets is relatively unchanged over time. The percentage of students meeting the StEPP components at Kindergarten is increasing over time while the percentage of students meeting StEPP components at grade 8 is declining. 3 To what extent are students meeting targets for individual student growth? Four in ten students in grades 4 8 met OAKS growth targets in A greater percentage of students in grades 3-7 meet their individual growth target in reading than in math, while the opposite is true at grade 8. With the exception of grade 5, racial and ethnicity gaps for students meeting their individual student growth target on OAKS Reading are much less pronounced than those for college and career readiness attainment. At most grades, the percentages of Special Education and ELL students meeting individual growth targets in reading are less than for district students as a whole. The percentage of TAG students meeting individual growth targets in reading is similar to district students as a whole until grade. The percentages of black, Hispanic, Special Education, and ELL students meeting their individual growth targets in OAKS Math is somewhat lower than for District students as a whole, with a proportionally large gap at grade 8 for the Special Education and ELL student groups. The percentage of TAG students meeting individual growth targets in math is significantly above the district rate. In reading, students that met the college and career readiness benchmark on OAKS met their individual student growth target at a slightly lower rate (44%) than students who were not college and career ready (45%), reversing last year s comparison. In math, students that met the college and career readiness benchmark on OAKS met their individual student growth target at a much higher rate (46%) than students who were not college and career ready (37%). Roughly half of grade 10 and 11 students met their individual growth target on each subject test ranging from a low of 45% in 11 th grade science to a high of 61% on 10 th grade English. In each tested subject except math, a greater percentage of students in grade 10 meet targets for individual student growth than their grade 11 peers. Hispanic and Special Education students are the least likely to meet their individual student growth targets across subjects and grades. However, greater percentages of 11 th grade ELL students meet their individual student growth target than their 10 th grade peers in each subject. Talented and Gifted students significantly outperform 5
6 their peers in meeting individual student growth expectations on all subjects at both grades. With the exception of grade 10 English, students that were college and career ready on the 8 th grade EXPLORE subject tests were more likely than their peers who were not college and career ready to meet individual student growth targets. The majority of students in grade 10 met their individual growth target in grade 10 whether or not the student was college and career ready in grade 8 with the exception of students who were not college and career ready in math. In grade 11, students who met college and career readiness benchmarks in grade 8 were more than twice as likely to meet their individual student growth target as their peers who were not college and career ready in grade 8. 4 How has student attainment of targets for individual student growth changed over time? In math, a lesser percentage of students met individual student growth targets OAKS in than in the previous year. In reading, the percentage of students meeting individual student growth targets remained about the same as the prior year. A greater percentage of 10 th grade students met individual student growth targets on high school college readiness assessments in compared to the baseline year of Double digit increases from in the percentage of 11 th grade students who met student growth targets were posted in all four subjects and the percentage of students meeting growth targets increased substantially from the baseline year of in all four subjects. 5 How does student attainment of college and career readiness benchmarks and targets for individual student growth vary by school poverty level? The percentage of students meeting college and career readiness benchmarks in reading and math is inversely related to the percentage of students who are economically disadvantaged in the school. The percentage of students meeting individual student growth targets is inversely related to the percentage of students who are economically disadvantaged in the school. The strength of the relationship is weaker than for student achievement. 6 What progress has the District made in closing achievement and growth gaps? The District has made little progress in closing the achievement gaps in college and career readiness. The growth gap between all students and the weighted average of historically underperforming groups narrowed for reading and for math between and

7 What is College and Career Ready? In the Beaverton School District, preparation for postsecondary and career success is defined as follows: College & Career Readiness: The acquisition of the knowledge, skills and behaviors a student needs to enroll and succeed in credit-bearing, first-year courses at a postsecondary institution (such as a two-or four-year college, trade school, or technical school) without the need for remediation. Drawing upon the work of Dr. David Conley, these knowledge, skills, and behaviors are organized in the four domains of the full option graduate profile: Conley, D. T. (2007). Redefining college readiness, Volume 3. Eugene, OR: Educational Policy Improvement Center. Current measures of college and career readiness employed in the District are focused on assessing student acquisition of key content. Many of these assessments are large scale assessments such as the Oregon Assessment of Knowledge and Skills (OAKS) and ACT college readiness testing. As the District continues to implement a standards-based learning system, measures of the other domains of college readiness will be implemented. In a standards-based learning system, evidence from classroom assessments will play a significant role in determining if students are college ready. The use of standardized and classroom measures will result in a balanced assessment system to determine if students are college and career ready. To measure student if students are college and career ready in 12 th grade and if students in early grades are on track to be college and career ready, the District has identified key academic benchmarks shown on the next page. The District is working to embed these benchmarks within an electronic Student Education Plan and Profile (StEPP) in order to promote college and career readiness for all students. 7

8 Getting Students Ready for College and Career The district goal is to prepare all students for post-secondary education and career success. For many years, students in grade 8 and high school have taken ACT college readiness tests. Scores from these tests are one indicator of whether a student is likely to be successful in a first year college course in English, math, science, and social science. Using many years of data from our own students, we have identified college and career readiness (CCR) benchmarks on the OAKS tests in reading and mathematics. (See page 50 for details.) A student that scores at or above the CCR is more likely to meet the ACT college readiness benchmark. Meeting college readiness benchmarks is one indication that a student is on track to succeed in college or in a career training program after graduating. 8
9 MATH READING State Achievement Standard State Achievement Standard BSD CCR BSD CCR Grade Meets Meets benchmark Meets Meets benchmark ACT College and Career Readiness Benchmarks The CCR benchmarks are scores on the ACT subject-area tests that represent the level of achievement required for students to have a 50% chance of obtaining a B or higher or about a 75% chance of obtaining a C or higher in corresponding credit-bearing first-year college courses. These college courses include English composition, college algebra, introductory social science courses, and biology. Based on a nationally representative sample of 98 institutions and more than 90,000 students, the Benchmarks are median course placement values for these institutions and as such represent a typical set of expectations. The ACT College Readiness Benchmarks are: College Course ACT Subject-Area Test EXPLORE Benchmark PLAN Benchmark ACT Benchmark English Composition English Social Sciences Reading College Algebra Mathematics Biology Science Source: Having defined measures of college and career readiness, we now look at another important facet of the district goal, growth for all students. What is Individual Student Growth? 9
10 Growth Model for Students in Grades 10 and 11 The Beaverton School District adopted ACT's growth expectations Based on an analysis of 150,000 students nationally, ACT identified growth targets for three groups of students: 8 th grade students Growth target More than 2 point below college Decrease the college readiness gap on the EXPLORE readiness benchmark on EXPLORE by ½ on the PLAN and by ½ again on the ACT 1 or 2 points below college readiness Meet college readiness benchmark on PLAN and on benchmark on EXPLORE Meeting college readiness benchmark on EXPLORE ACT Demonstrate above average growth from EXPLORE to PLAN and from PLAN to ACT. The EXPLORE test is administered to 8th graders in November. The PLAN and ACT assessments are administered to 10th and 11th grade students in April. The table below shows the growth targets for math for three students, one in each of the groups in the table above. Growth Target Example: Math 8 th Grade EXPLORE Score PLAN Growth Target ACT Growth Target 12 (below) (near) (meeting and above) Growth Model for Students in Grades 4-8 For students in grades 4-8 who are below the State s achievement standard on the OAKS reading or math test the previous year, the State sets annual growth targets to put students on a trajectory to meet the State s achievement standard within three years. The Beaverton School District s Individual Student Growth Model for elementary and middle school students is: 1) For students who did not meet the District s College and Career Readiness benchmark in the prior year, an annual growth target puts the student on a trajectory to meet the District s College and Career Readiness benchmark within three years. 2) For students with scores at the 97 th percentile the previous year (above the District s College and Career Readiness benchmark), growth targets keep the student on a trajectory to be at the 97 th percentile three years out. 3) For students meeting the District s College and Career Readiness benchmark in the previous year but below the 97 th percentile, interpolated growth targets are established based on 1) and 2). These growth expectations are for a student to maintain standing relative to his/her peers. Growth Target Example: OAKS Reading 4 th Grade OAKS Reading Score 5 th Grade Growth Target 212 (below CCR) (CCR) (97 th percentile) 243 Which Students are Included in the Data? 10
11 Data reflects students enrolled on May 1 and are still enrolled at the end of the school year in District-operated schools. For StEPP 6 (grade 12), students who graduated as well as students who are still enrolled are included. Results for Native American and Pacific Islander students should be interpreted with caution since the number of students with data at each grade is usually between 10 and 20 students. Student program participation is defined as follows: Student Group Special Education English Language Learners Talented and Gifted Economically Disadvantaged Mobile Definition Students on an Individualized Education Plan (IEP) Students identified as ELL during the current school year Students identified as talented and gifted Students eligible for free or reduced price lunch at the end of the year Students enrolling in the District after October 1, not enrolled on the first school day of any month, or changing schools between the prior and current school year For cross year comparisons, please note that the following subgroup definitions changed between and : Student Group Definition in Definition in English Language Learners Students identified as ELL at the end of the school year Students identified as ELL during the current school year Mobile Students enrolling in the District after October 1 or changing schools between the prior and current school year Students enrolling in the District after October 1, not enrolled on the first school day of any month, or changing schools between the prior and current school year 11
 meet all college and career readiness benchmarks for their grade level.")
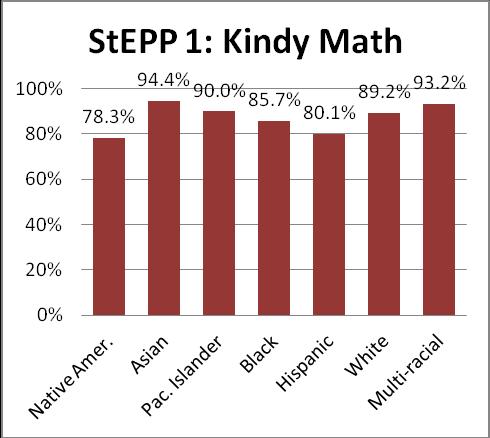
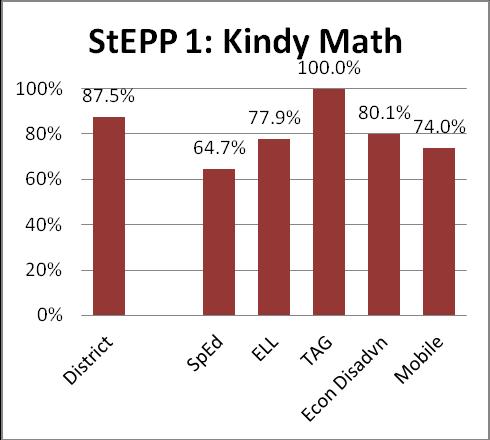
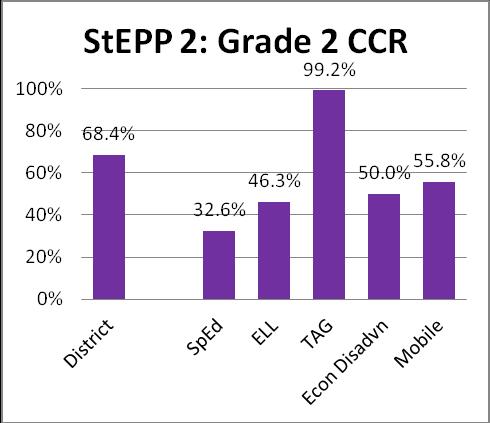
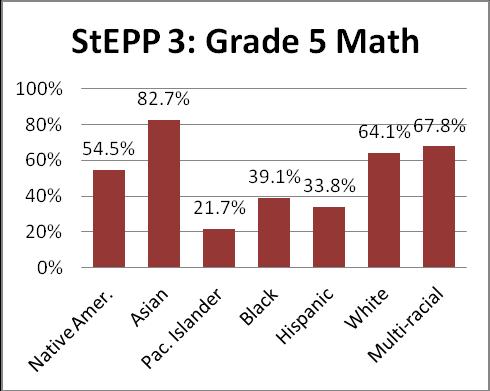
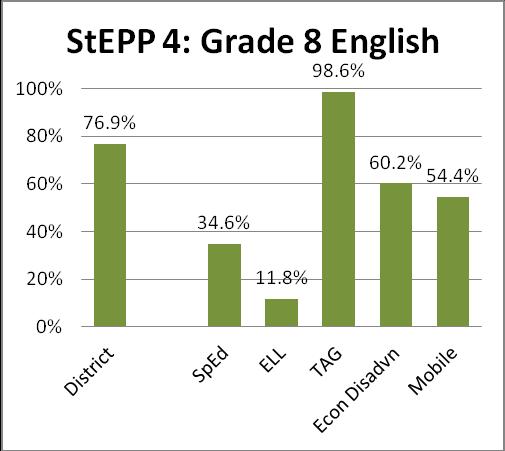
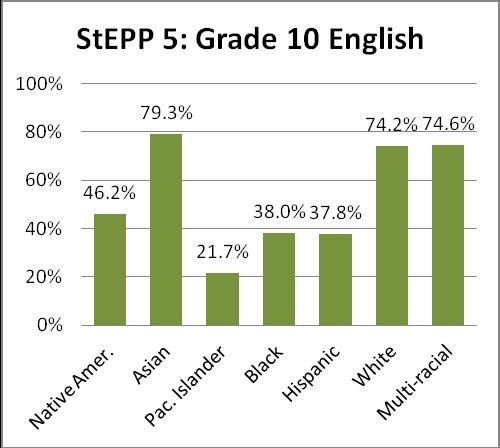
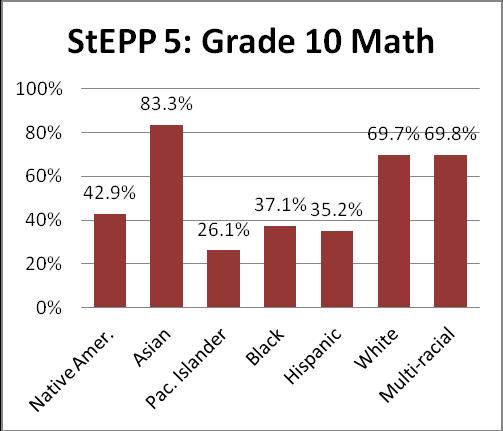
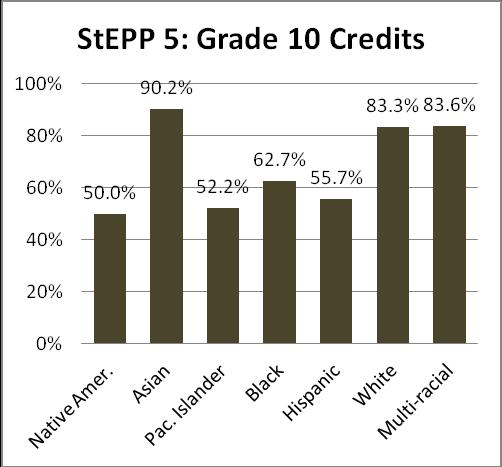
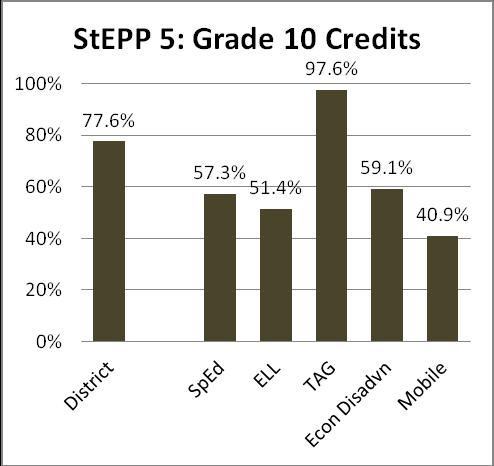
12 Key Question and Findings Indicator Key Question and Findings 1 To what extent are students attaining college and career readiness benchmarks? Nearly half of Beaverton students (46.1%) meet all college and career readiness benchmarks for their grade level. The percentages of Black, Hispanic, Special Education, English Language Learners, Economically Disadvantaged, and Mobile students meeting college and career readiness benchmarks lag the corresponding percentages for all students in the District. Talented and Gifted students significantly outperform their peers at all StEPPs. College and Career Readiness Attainment in Nearly half of Beaverton students (46.1%) meet all college and career readiness benchmarks for their grade level. The percentages of students meeting college and career readiness benchmarks by grade are shown here: College and Career Readiness Attainment in by Student Group and StEPP Component At all grade levels, the percentages of Black, Hispanic, Special Education, English Language Learners, Economically Disadvantaged, and Mobile students meeting college and career readiness benchmarks lag the corresponding percentages for all students in the District. Talented and Gifted students significantly outperform their peers at all StEPPs. The graphs on the following pages illustrate the difference in StEPP attainment by student demographic group and also show differences by content area. 12
13 13
14 14
15 15
16 16
17 17
18 18
19 19
20 20
21 21
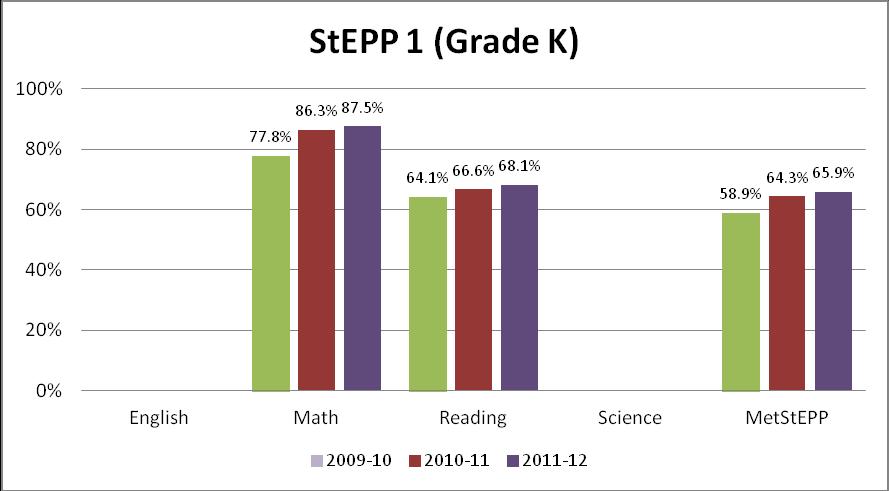
22 Indicator Key Question and Findings 2 How has student attainment of college and career readiness benchmarks changed over time? Across all grades, the percentage of students meeting StEPP targets is relatively unchanged over time. The percentage of students meeting the StEPP components at Kindergarten is increasing over time while the percentage of students meeting StEPP components at grade 8 is declining. Trends in College and Career Readiness Attainment Across all grades, the percentage of students meeting StEPP targets is relatively unchanged over time. The percentage of students meeting the StEPP components at Kindergarten is increasing over time while the percentage of students meeting StEPP components at grade 8 is declining. Little change is noted at the other grade levels from last year to this year. The percentages of students meeting college and career readiness benchmarks at each grade level in , , and are shown in the graphs below: 22
23 23


24 Note: The College and Career Readiness benchmark for OAKS Reading increased one point from to in anticipation of revised state achievement standards effective in the school year. 24

 and have earned at least one math credit.")
25 Note: and data reflect the dispersal of the credit requirement into each StEPP component. For example, to be college and career ready in math, a student must meet essential skills requirements (either through OAKS or PLAN) and have earned at least one math credit. In and , the credit requirement is 12 or more credits earned with at least one credit in science. 25
26 Indicator Key Question and Findings 3 To what extent are students meeting targets for individual student growth? Four in ten students in grades 4 8 met OAKS growth targets in A greater percentage of students in grades 3-7 meet their individual growth target in reading than in math, while the opposite is true at grade 8. With the exception of grade 5, racial and ethnicity gaps for students meeting their individual student growth target on OAKS Reading are much less pronounced than those for college and career readiness attainment. At most grades, the percentages of Special Education and ELL students meeting individual growth targets in reading are less than for district students as a whole. The percentage of TAG students meeting individual growth targets in reading is similar to district students as a whole until grade 8 when the percentage for TAG students meeting individual growth targets (37%) is nearly double the district figure (20%). The percentages of black, Hispanic, Special Education, and ELL students meeting their individual growth targets in OAKS Math is somewhat lower than for District students as a whole, with a proportionally large gap at grade 8 for the Special Education and ELL student groups. The percentage of TAG students meeting individual growth targets in math is significantly above the district rate. In reading, students that met the college and career readiness benchmark on OAKS met their individual student growth target at a slightly lower rate (44%) than students who were not college and career ready (45%), reversing last year s comparison. In math, students that met the college and career readiness benchmark on OAKS met their individual student growth target at a much higher rate (46%) than students who were not college and career ready (37%). Roughly half of grade 10 and 11 students met their individual growth target on each subject test ranging from a low of 45% in 11 th grade science to a high of 61% on 10 th grade English. In each tested subject except math, a greater percentage of students in grade 10 meet targets for individual student growth than their grade 11 peers. Hispanic and Special Education students are the least likely to meet their individual student growth targets across subjects and grades. Greater percentages of 11 th grade ELL students meet their individual student growth target than their 10 th grade peers in each subject. Talented and Gifted students significantly outperform their peers in meeting individual student growth expectations on all subjects at both grades. With the exception of grade 10 English, students that were college and career ready on the 8 th grade EXPLORE subject tests were more likely than their peers who were not college and career ready to meet individual student growth targets. The majority of students in grade 10 met their individual growth target whether or not the student was college and career ready in grade 8, with the exception of students who were not college and career ready in math. In grade 11, students who met college and career readiness benchmarks in grade 8 were more than twice as likely to meet their individual student growth target as their peers who were not college and career ready in grade 8. Individual Student Growth on OAKS 26

27 Four in ten students in grades 4 8 met OAKS growth targets in A greater percentage of students in grades 3-7 meet their individual growth target in reading than in math, while the opposite is true at grade 8. Individual Student Growth on OAKS Disaggregated by Student Group In reading, with the exception of grade 5, racial and ethnicity gaps for students meeting their individual student growth target are much less pronounced than those for college and career readiness attainment. At most grades, the percentages of Special Education and ELL students meeting individual growth targets are less than for district students as a whole. The percentage of TAG students meeting individual growth targets is similar to district students as a whole until grade 8 when the percentage for TAG students meeting individual growth targets (37%) is nearly double the district figure (20%). 27
28 28
29 In math, the percentage of TAG students meeting individual growth targets is significantly above the district rate. The percentages of black, Hispanic, Special Education, and ELL students meeting their individual growth targets is somewhat lower than for District students as a whole, with a proportionally large gap at grade 8 for the Special Education and ELL student groups. 29
30 30
 than students who were not college and career ready (45%), reversing last year s comparison.")
31 Individual Student Growth on OAKS by College and Career Readiness Attainment in the Prior Year In reading, students that met the college and career readiness benchmark on OAKS met their individual student growth target at a slightly lower rate (44%) than students who were not college and career ready (45%), reversing last year s comparison. In math, students that met the college and career readiness benchmark on OAKS met their individual student growth target at a much higher rate (46%) than students who were not college and career ready (37%). 31


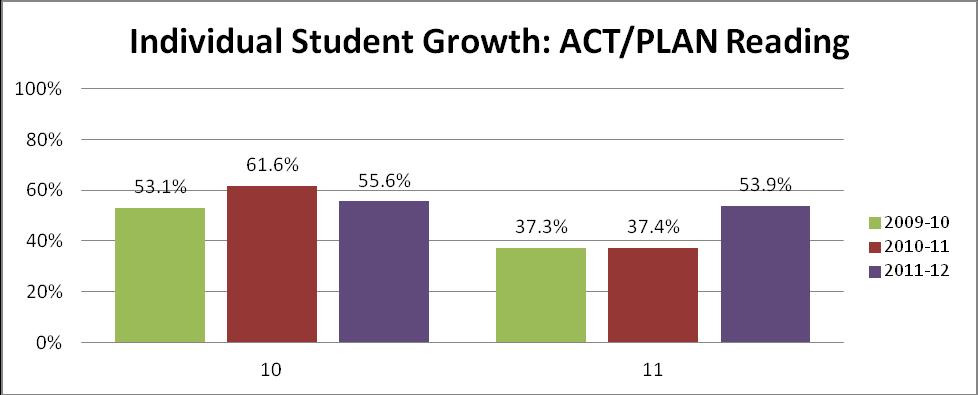
32 Individual Student Growth on High School College Readiness Assessments Roughly half of grade 10 and 11 students met their individual growth target on each subject test ranging from a low of 45% in 11 th grade science to a high of 61% on 10 th grade English. In each tested subject except math, a greater percentage of students in grade 10 meet targets for individual student growth than their grade 11 peers. 32

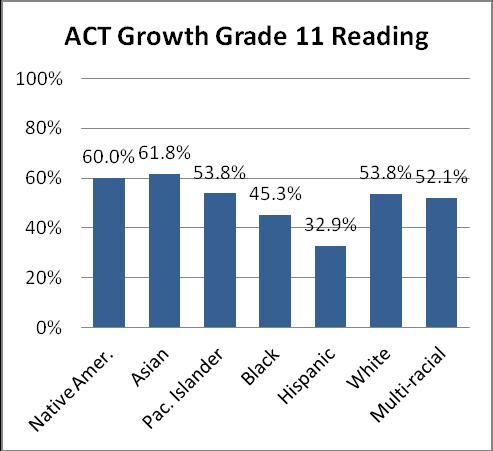
33 Individual Student Growth on High School College Readiness Assessments Disaggregated by Student Group Hispanic and Special Education students are the least likely to meet their individual student growth targets across subjects and grades. Greater percentages of 11 th grade ELL students meet their individual student growth target than their 10 th grade peers in each subject. Talented and Gifted students significantly outperform their peers in meeting individual student growth expectations on all subjects at both grades. 33
34 34
35 35

36 Individual Student Growth on High School College and Career Readiness Assessments by College and Career Readiness Attainment in Grade 8 With the exception of grade 10 English, students who were college and career ready on the 8 th grade EXPLORE subject tests were more likely to meet individual student growth targets than their peers who were not college and career ready. The majority of students in grade 10 met their individual growth target whether or not the student was college and career ready in grade 8, with the exception of students who were not college and career ready in math (41%). In grade 11, students who met college and career readiness benchmarks in grade 8 were more than twice as likely to meet their individual student growth target as their peers who were not college and career ready in grade 8. 36
37 37

38 At grade 11, the gap between the percentage of CCR students meeting growth targets and students who were not CCR in grade 8 increased in English and science, but narrowed for reading and math. At grade 10, the gap between the percentage of CCR students meeting growth targets and students who were not CCR in grade 8 narrowed in reading and science and increased in math. 38

39 Indicator Key Question and Findings 4 How has student attainment of targets for individual student growth changed over time? In math, a lesser percentage of students met individual student growth targets OAKS in than in the previous year. In reading, the percentage of students meeting individual student growth targets remained about the same as the prior year. A greater percentage of 10 th grade students met individual student growth targets on high school college readiness assessments in compared to the baseline year of Double digit increases from in the percentage of 11 th grade students who met student growth targets were posted in all four subjects and the percentage of students meeting growth targets increased substantially from the baseline year of in all four subjects. Trends in Individual Student Growth Attainment on OAKS In math, a lesser percentage of students met individual student growth targets OAKS in than in the previous year. In reading, the percentage of students meeting individual student growth targets remained about the same as the prior year. Percentages of students meeting growth targets in grades 4 7 in are not comparable with the other two years due to changes in CCR benchmarks in grades 5 and 6. 39

40 Trends in Individual Student Growth in High School College Readiness Assessments A greater percentage of 10 th grade students met individual student growth targets on high school college readiness assessments in compared to the baseline year of Double digit increases from in the percentage of 11 th grade students who met student growth targets were posted in all four subjects and the percentage of students meeting growth targets increased substantially from the baseline year of in all four subjects. 40
41 41
42 Indicator Key Question and Findings 5 How does student attainment of college and career readiness benchmarks and targets for individual student growth vary by school? The percentage of students meeting college and career readiness benchmarks in reading and math is inversely related to the percentage of students who are economically disadvantaged in the school. The percentage of students meeting individual student growth targets is inversely related to the percentage of students who are economically disadvantaged in the school. The strength of the relationship is weaker than for student achievement. Attainment of College and Career Readiness Benchmarks by School The percentage of students meeting college and career readiness benchmarks in reading and math is inversely related to the percentage of students who are economically disadvantaged in the school. However, this is not true for 8 th grade mathematics as shown below. The steepness of the trend line is more pronounced in high school in both reading and math. In other words, increasing the percentage of students eligible for free or reduced priced lunch has a greater negative effect on the percentage of students meeting StEPP benchmarks at high school as opposed to middle school. 42
43 Percent Met StEPP Percent Met StEPP 100% Met StEPP Benchmark: Grade 8 Reading 80% 60% 40% 20% Met StEPP Benchmark: Grade 8 Math 100% 80% 60% 40% 20% 0% Percent Economically Disadvantaged 0% Percent Economically Disadvantaged The chart below shows the slope of each of the trend lines for the graphs above and the same graphs for the prior year. For each 1% increase in the percentage of economically disadvantaged students, the percentage of students meeting the StEPP benchmark decreases by the corresponding percentage in the chart. Of note is the change in the slope of the trend line in 8 th grade math. The slope of indicates the percentage of economically disadvantaged students in the school has little relationship with the percentage of student achieving the StEPP benchmark in 8 th grade math in However, if the school at the extreme right is removed as an outlier, the slope of the line of best fit (indicated by an asterisk in the table below), is more negative and follows the results at the other grade levels. Met StEPP Benchmark: Slope of Trend Lines Reading Math Grade /-0.70* /-0.61*
44 Met Growth Target Met Growth Target Attainment of Individual Student Growth Targets by School In elementary and high schools, the percentage of students meeting individual student growth targets is inversely related to the percentage of students who are economically disadvantaged in the school. In middle schools, the opposite is true the percentage of students meeting individual student growth targets increases as the percentage of students who are economically disadvantaged increases. Met Individual Student Growth: Middle School Reading 100% 80% 60% 40% 20% 0% Percent Economically Disadvantaged Met Individual Student Growth: Middle School Math 100% 80% 60% 40% 20% 0% Percent Economically Disadvantaged 44
45 At the elementary and high school levels in both reading and mathematics, the slope of the trend line decreased. In other words, the negative relationship between the percentage of economically disadvantaged students in the school and the percentage of student meeting individual student growth targets weakened. At the middle level, the positive relationship between the percentage of economically disadvantaged students and the percentage of students meeting individual student growth targets in reading and math increased. However, if the school at the extreme right is removed as an outlier, the slope of the line of best fit (indicated by an asterisk in the table below), is negative in both reading and math, but less steep than at the high school level. Met Individual Growth Target: Slope of Trend Lines Reading Math Grade Elem Middle /-0.10* /-0.05* High The slope of line of best fit decreased between and in both English and science. Thus, the negative relationship between the percentage of economically disadvantaged students in the school and the percentage of student meeting individual student growth targets weakened at the high school level in both science, and to a lesser extent, English. 45

46 Indicator Key Question and Findings 6 What progress has the District made in closing achievement gaps? Student academic achievement can be predicted by race/ethnicity, socio-economic status, mobility, disability, and language proficiency. The District has made little progress in closing the achievement gaps in college and career readiness. The growth gap between all students and the weighted average of historically underperforming groups narrowed for reading and for math between and Closing the Achievement Gap Student academic achievement can be predicted by race/ethnicity, socio-economic status, mobility, disability, and language proficiency. The table below shows the gap between the percentage of students in each group meeting all components of college and career readiness and the percentage of students in the all student group meeting all components of the college and career readiness. Native American, Pacific Islander, Black, and Hispanic students are included in the Race/ethnicity category. The number of students in each category is used to determine the weighted average of the achievement gaps in each StEPP. StEPP Race/ethnicity 20.6% 30.2% 16.6% 22.0% 19.9% 14.6% Econ, Disadvantaged 16.5% 25.1% 16.5% 22.6% 18.4% 15.7% Mobility 21.2% 33.7% 12.3% 19.8% 12.6% 19.7% Disability 24.2% 38.5% 20.1% 28.4% 35.5% 29.3% Initial Prof (in English) 25.8% 39.6% 24.5% 25.4% 22.2% 17.0% Weighted Average 19.8% 30.8% 17.0% 23.6% 20.8% 16.9% The graph below compares the weighted average of the achievement gaps at each StEPP and the overall achievement gap for the past three years. The achievement gap continued to narrow slightly across all grades combined for the second year in a row. 46
47 Closing Growth Gaps The table below shows the gap between the percentage of students in each group meeting all components of college and career readiness and the percentage of students in the all student group meeting all components of the college and career readiness. Native American, Pacific Islander, Black, and Hispanic students are included in the Race/ethnicity category. The number of students in each category is used to determine the weighted average of the achievement gaps in each StEPP. Reading Grade 11 Grade 10 Grade 8 Grade 7 Grade 6 Grade 5 Grade 4 Race/ethnicity 15.0% 11.6% 6.8% 6.7% 6.2% 8.8% 3.0% Income 6.4% 6.6% 7.1% 5.4% 3.9% 6.1% 0.8% Mobility -6.3% 7.2% 3.3% 9.9% 2.9% 7.0% -2.4% Disability 14.2% 17.9% 11.5% 19.5% 10.5% 9.8% 7.1% Initial Prof (in English) 2.3% 22.0% 12.3% 10.5% 8.0% 10.3% 9.5% Weighted Average % 11.1% 8.0% 8.7% 6.1% 8.1% 3.0% The growth gap between all students and the weighted average of historically underperforming groups narrowed for reading between and It is important to note that the rules for including students in the mobile students group and especially in the Initial Proficiency (in English) group changed between last year and this year contributed to the overall gap reduction. 47
48 The growth gap between all students and the weighted average of historically underperforming groups also narrowed between and for mathematics. At most all grades, the growth gaps in mathematics are larger than those for reading Math Grade 11 Grade 10 Grade 8 Grade 7 Grade 6 Grade 5 Grade 4 Race/ethnicity 15.3% 19.9% 14.1% 7.5% 8.6% 7.8% 6.3% Income 12.2% 15.6% 14.4% 7.6% 8.3% 10.7% 5.0% Mobility -0.3% 15.5% 21.6% 5.6% 16.7% 7.8% -1.8% Disability 18.7% 16.3% 28.7% 17.5% 13.6% 10.2% 8.2% Initial Prof (in English) 0.8% 19.7% 26.1% 4.9% 4.4% 9.3% 14.5% Weighted Average % 17.3% 18.3% 8.2% 8.5% 9.5% 6.3% 48
49 Process for Establishing BSD College and Career Readiness Benchmarks ACT has established college readiness benchmarks in each subject area test (reading, science, math, and English) for the ACT, PLAN and EXPLORE. Using course grade data from a large sample of colleges, ACT identified the score associated with a 50% probability of a student earning a B or better and a 75% chance of earning a C or better in the associated first-year college course. For reading, this is a freshman Social Science course and for mathematics, College Algebra. Students who meet a college readiness benchmark on EXPLORE or PLAN are likely to have approximately this same chance of earning such a grade in the corresponding college course by the time they graduate from high school. These college readiness scores derived for the PLAN test were used as the basis of establishing college and career readiness benchmarks for students in grades 3 8 based on the OAKS reading and math tests. PLAN was chosen because it is designed for 10 th grade students and provides for a more direct comparison with the 10 th grade OAKS score. A four year cohort of students who had taken both the PLAN and the 10 th grade OAKS was used to establish the OAKS benchmark scores associated with a student having a two in three chance of meeting the corresponding PLAN college readiness benchmark. PLAN college readiness status was compared to 10 th grade OAKS scores to determine the minimum score required to achieve a 66% probability of achieving PLAN college readiness. This score was then established as the 10 th grade college and career readiness (CCR) benchmark. The 8 th grade OAKS scores were then compared to the 10 th grade (CCR) benchmark to determine what 8 th grade scores would result in a 66% probability of achieving the 10 th grade (CCR) benchmark. This score became the 8 th grade (CCR) benchmark. This grade to grade linking process was continued downward until the 3 rd grade (CCR) benchmark was determined for both reading and math. This methodology is similar to that employed by the National Center for Educational Accountability in establishing college readiness standards for Texas students in grades References: ACT (2005). What are ACT s College Readiness Benchmarks? (ACT. Iowa City, IA). Allen J. and Sconing, J (August 2005). Using ACT Assessments Scores to Set College Readiness Benchmarks. (ACT. Iowa City, IA). Dougherty, C, et al (2005). Identifying Appropriate College-readiness Standards for All Students. (NCEA. Austin, TX). 49
50 Beaverton School District Individual Student Growth Model Growth Models for Students in Grades 10 and 11 The Beaverton School District adopted ACT's growth expectations Based on an analysis of 150,000 students nationally, ACT identified growth targets for three groups of students: 8 th grade students Growth target More than 2 point below college Decrease the college readiness gap on the EXPLORE readiness benchmark on EXPLORE by ½ on the PLAN and by ½ again on the ACT 1 or 2 points below college readiness Meet college readiness benchmark on PLAN and on benchmark on EXPLORE ACT Meeting college readiness benchmark Demonstrate above average growth from on EXPLORE EXPLORE to PLAN and from PLAN to ACT. The EXPLORE test is administered to 8th graders in November. 10th and 11th grade students take the PLAN and ACT in April. Growth Model for Students in Grades 4-8 For students in grades 4-8 who are below the State s achievement standard on the OAKS reading or math test the previous year, the State sets annual growth targets to put students on a trajectory to meet the achievement standard within three years. Students are expected to close the gap between their performance and the achievement standard by roughly 40% between their current grade and the next grade. There are no growth targets for high school students. ODE has not yet established growth targets for an individual student who met or exceeded the achievement standard. To develop a growth model which includes all students, the State s methodology for setting growth targets is modified and augmented in the following three ways: a. For students who did not meet the District s College and Career Readiness benchmark in the prior year, an annual growth target puts the student on a trajectory to meet the District s College and Career Readiness benchmark within three years. b. For students with scores at the 97 th percentile the previous year (above the District s College and Career Readiness benchmark), growth targets keep the student on a trajectory to be at the 97 th percentile three years out. c. For students meeting the District s College and Career Readiness benchmark in the previous year but below the 97 th percentile, interpolated growth targets are established based on a. and b. These growth expectations are for a student to maintain standing relative to his/her peers. In some grades, the expected growth is the same as for the student s closest to but not meeting the CCR benchmark and for students at or above the 97 th percentile. In other grades, the growth targets smooth differences between the expected growth for these two groups of students. References: ACT (2009). How Much Growth toward College Readiness Is Reasonable to Expect in High School? (ACT. Iowa City, IA). Oregon Department of Education (2010). School and District Report Card Policy and Technical Manual. (ODE. Salem, OR). 50
51 Beaverton Individual Student Growth Targets Reading Grade 4 Grade 5 Grade 6 Grade 7 Grade 8 CCR Catch CCR Catch CCR Catch CCR Catch CCR Catch Prior Year CCR Keep CCR Keep CCR Keep CCR Keep CCR Keep OAKS Score To 97th To 97th To 97th To 97th To 97th
52 and above
53 Beaverton Individual Student Growth Targets Math Grade 3 Grade 4 Grade 5 Grade 6 Grade 7 CCR Catch CCR Catch CCR Catch CCR Catch CCR Catch CCR Keep CCR Keep CCR Keep CCR Keep CCR Keep To 97th To 97th To 97th To 97th To 97th
54 and above
Iowa School District Profiles. Le Mars
 Iowa School District Profiles Overview This profile describes enrollment trends, student performance, income levels, population, and other characteristics of the public school district. The report utilizes
Miami-Dade County Public Schools
 ENGLISH LANGUAGE LEARNERS AND THEIR ACADEMIC PROGRESS: 2010-2011 Author: Aleksandr Shneyderman, Ed.D. January 2012 Research Services Office of Assessment, Research, and Data Analysis 1450 NE Second Avenue,
Cooper Upper Elementary School
 LIVONIA PUBLIC SCHOOLS http://cooper.livoniapublicschools.org 215-216 Annual Education Report BOARD OF EDUCATION 215-16 Colleen Burton, President Dianne Laura, Vice President Tammy Bonifield, Secretary
Shelters Elementary School
 Shelters Elementary School August 2, 24 Dear Parents and Community Members: We are pleased to present you with the (AER) which provides key information on the 23-24 educational progress for the Shelters
Cooper Upper Elementary School
 LIVONIA PUBLIC SCHOOLS www.livoniapublicschools.org/cooper 213-214 BOARD OF EDUCATION 213-14 Mark Johnson, President Colleen Burton, Vice President Dianne Laura, Secretary Tammy Bonifield, Trustee Dan
2012 ACT RESULTS BACKGROUND
 Report from the Office of Student Assessment 31 November 29, 2012 2012 ACT RESULTS AUTHOR: Douglas G. Wren, Ed.D., Assessment Specialist Department of Educational Leadership and Assessment OTHER CONTACT
Coming in. Coming in. Coming in
 212-213 Report Card for Glenville High School SCHOOL DISTRICT District results under review by the Ohio Department of Education based upon 211 findings by the Auditor of State. Achievement This grade combines
ILLINOIS DISTRICT REPORT CARD
 -6-525-2- Hazel Crest SD 52-5 Hazel Crest SD 52-5 Hazel Crest, ILLINOIS 2 8 ILLINOIS DISTRICT REPORT CARD and federal laws require public school districts to release report cards to the public each year.
Practices Worthy of Attention Step Up to High School Chicago Public Schools Chicago, Illinois
 Step Up to High School Chicago Public Schools Chicago, Illinois Summary of the Practice. Step Up to High School is a four-week transitional summer program for incoming ninth-graders in Chicago Public Schools.
Transportation Equity Analysis
 2015-16 Transportation Equity Analysis Each year the Seattle Public Schools updates the Transportation Service Standards and bus walk zone boundaries for use in the upcoming school year. For the 2014-15
ILLINOIS DISTRICT REPORT CARD
 -6-525-2- HAZEL CREST SD 52-5 HAZEL CREST SD 52-5 HAZEL CREST, ILLINOIS and federal laws require public school districts to release report cards to the public each year. 2 7 ILLINOIS DISTRICT REPORT CARD
Educational Attainment
 A Demographic and Socio-Economic Profile of Allen County, Indiana based on the 2010 Census and the American Community Survey Educational Attainment A Review of Census Data Related to the Educational Attainment
A Guide to Adequate Yearly Progress Analyses in Nevada 2007 Nevada Department of Education
 A Guide to Adequate Yearly Progress Analyses in Nevada 2007 Nevada Department of Education Note: Additional information regarding AYP Results from 2003 through 2007 including a listing of each individual
Kansas Adequate Yearly Progress (AYP) Revised Guidance
 Revised Guidance") Kansas State Department of Education Kansas Adequate Yearly Progress (AYP) Revised Guidance Based on Elementary & Secondary Education Act, No Child Left Behind (P.L. 107-110) Revised May 2010 Revised May
Kansas State Department of Education Kansas Adequate Yearly Progress (AYP) Revised Guidance Based on Elementary & Secondary Education Act, No Child Left Behind (P.L. 107-110) Revised May 2010 Revised May
READY OR NOT? CALIFORNIA'S EARLY ASSESSMENT PROGRAM AND THE TRANSITION TO COLLEGE
 READY OR NOT? CALIFORNIA'S EARLY ASSESSMENT PROGRAM AND THE TRANSITION TO COLLEGE Michal Kurlaender University of California, Davis Policy Analysis for California Education March 16, 2012 This research
The Oregon Literacy Framework of September 2009 as it Applies to grades K-3
 The Oregon Literacy Framework of September 2009 as it Applies to grades K-3 The State Board adopted the Oregon K-12 Literacy Framework (December 2009) as guidance for the State, districts, and schools
Status of Women of Color in Science, Engineering, and Medicine
 Status of Women of Color in Science, Engineering, and Medicine The figures and tables below are based upon the latest publicly available data from AAMC, NSF, Department of Education and the US Census Bureau.
Student Mobility Rates in Massachusetts Public Schools
 Student Mobility Rates in Massachusetts Public Schools Introduction The Massachusetts Department of Elementary and Secondary Education (ESE) calculates and reports mobility rates as part of its overall
5 Programmatic. The second component area of the equity audit is programmatic. Equity
 5 Programmatic Equity It is one thing to take as a given that approximately 70 percent of an entering high school freshman class will not attend college, but to assign a particular child to a curriculum
Wisconsin 4 th Grade Reading Results on the 2015 National Assessment of Educational Progress (NAEP)
") Wisconsin 4 th Grade Reading Results on the 2015 National Assessment of Educational Progress (NAEP) Main takeaways from the 2015 NAEP 4 th grade reading exam: Wisconsin scores have been statistically flat
Wisconsin 4 th Grade Reading Results on the 2015 National Assessment of Educational Progress (NAEP) Main takeaways from the 2015 NAEP 4 th grade reading exam: Wisconsin scores have been statistically flat
An Empirical Analysis of the Effects of Mexican American Studies Participation on Student Achievement within Tucson Unified School District
 An Empirical Analysis of the Effects of Mexican American Studies Participation on Student Achievement within Tucson Unified School District Report Submitted June 20, 2012, to Willis D. Hawley, Ph.D., Special
African American Male Achievement Update
 Report from the Department of Research, Evaluation, and Assessment Number 8 January 16, 2009 African American Male Achievement Update AUTHOR: Hope E. White, Ph.D., Program Evaluation Specialist Department
Rural Education in Oregon
 Rural Education in Oregon Overcoming the Challenges of Income and Distance ECONorthwest )'3231-'7 *-2%2') 40%22-2+ Cover photos courtesy of users Lars Plougmann, San José Library, Jared and Corin, U.S.Department
Race, Class, and the Selective College Experience
 Race, Class, and the Selective College Experience Thomas J. Espenshade Alexandria Walton Radford Chang Young Chung Office of Population Research Princeton University December 15, 2009 1 Overview of NSCE
Instructional Intervention/Progress Monitoring (IIPM) Model Pre/Referral Process. and. Special Education Comprehensive Evaluation.
 Model Pre/Referral Process. and. Special Education Comprehensive Evaluation.") Instructional Intervention/Progress Monitoring (IIPM) Model Pre/Referral Process and Special Education Comprehensive Evaluation for Culturally and Linguistically Diverse (CLD) Students Guidelines and Resources
Instructional Intervention/Progress Monitoring (IIPM) Model Pre/Referral Process and Special Education Comprehensive Evaluation for Culturally and Linguistically Diverse (CLD) Students Guidelines and Resources
Suggested Citation: Institute for Research on Higher Education. (2016). College Affordability Diagnosis: Maine. Philadelphia, PA: Institute for
. College Affordability Diagnosis: Maine. Philadelphia, PA: Institute for") MAINE Suggested Citation: Institute for Research on Higher Education. (2016). College Affordability Diagnosis: Maine. Philadelphia, PA: Institute for Research on Higher Education, Graduate School of Education,
MAINE Suggested Citation: Institute for Research on Higher Education. (2016). College Affordability Diagnosis: Maine. Philadelphia, PA: Institute for Research on Higher Education, Graduate School of Education,
Trends & Issues Report
 Trends & Issues Report prepared by David Piercy & Marilyn Clotz Key Enrollment & Demographic Trends Options Identified by the Eight Focus Groups General Themes 4J Eugene School District 4J Eugene, Oregon
Moving the Needle: Creating Better Career Opportunities and Workforce Readiness. Austin ISD Progress Report
 Moving the Needle: Creating Better Career Opportunities and Workforce Readiness Austin ISD Progress Report 2013 A Letter to the Community Central Texas Job Openings More than 150 people move to the Austin
Data Diskette & CD ROM
 Data File Format Data Diskette & CD ROM Texas Assessment of Academic Skills Fall 2002 through Summer 2003 Exit Level Test Administrations Attention Macintosh Users To accommodate Macintosh systems a delimiter
Bellehaven Elementary
 Overall istrict: Albuquerque Public Schools Grade Range: KN-05 Code: 1229 School Grade Report Card 2013 Current Standing How did students perform in the most recent school year? are tested on how well
EDUCATIONAL ATTAINMENT
 EDUCATIONAL ATTAINMENT By 2030, at least 60 percent of Texans ages 25 to 34 will have a postsecondary credential or degree. Target: Increase the percent of Texans ages 25 to 34 with a postsecondary credential.
The Condition of College & Career Readiness 2016
 The Condition of College and Career Readiness This report looks at the progress of the 16 ACT -tested graduating class relative to college and career readiness. This year s report shows that 64% of students
World s Best Workforce Plan
 2017-18 World s Best Workforce Plan District or Charter Name: PiM Arts High School, 4110-07 Contact Person Name and Position Matt McFarlane, Executive Director In accordance with Minnesota Statutes, section
Longitudinal Analysis of the Effectiveness of DCPS Teachers
 F I N A L R E P O R T Longitudinal Analysis of the Effectiveness of DCPS Teachers July 8, 2014 Elias Walsh Dallas Dotter Submitted to: DC Education Consortium for Research and Evaluation School of Education
Kahului Elementary School
 Kahului Elementary Code: 405 Status and Improvement Report Year 2014-15 Focus On Standards Grades K-5 Focus on Standards Description Contents Setting Student Profile Community Profile Improvement Summary
RAISING ACHIEVEMENT BY RAISING STANDARDS. Presenter: Erin Jones Assistant Superintendent for Student Achievement, OSPI
 RAISING ACHIEVEMENT BY RAISING STANDARDS Presenter: Erin Jones Assistant Superintendent for Student Achievement, OSPI Agenda Introductions Definitions History of the work Strategies Next steps Debrief
Review of Student Assessment Data
 Reading First in Massachusetts Review of Student Assessment Data Presented Online April 13, 2009 Jennifer R. Gordon, M.P.P. Research Manager Questions Addressed Today Have student assessment results in
NCEO Technical Report 27
 Home About Publications Special Topics Presentations State Policies Accommodations Bibliography Teleconferences Tools Related Sites Interpreting Trends in the Performance of Special Education Students
U VA THE CHANGING FACE OF UVA STUDENTS: SSESSMENT. About The Study
 About The Study U VA SSESSMENT In 6, the University of Virginia Office of Institutional Assessment and Studies undertook a study to describe how first-year students have changed over the past four decades.
The Effects of Statewide Private School Choice on College Enrollment and Graduation
 E D U C A T I O N P O L I C Y P R O G R A M R E S E A RCH REPORT The Effects of Statewide Private School Choice on College Enrollment and Graduation Evidence from the Florida Tax Credit Scholarship Program
Hokulani Elementary School
 Hokulani Elementary Code: 109 Status and Improvement Report Year -11 Contents Focus On Standards Grades K-5 This Status and Improvement Report has been prepared as part of the Department's education accountability
SAT Results December, 2002 Authors: Chuck Dulaney and Roger Regan WCPSS SAT Scores Reach Historic High
 ABOUT THE SAT 2001-2002 SAT Results December, 2002 Authors: Chuck Dulaney and Roger Regan WCPSS SAT Scores Reach Historic High The Scholastic Assessment Test (SAT), more formally known as the SAT I: Reasoning
Annual Report to the Public. Dr. Greg Murry, Superintendent
 Annual Report to the Public Dr. Greg Murry, Superintendent 1 Conway Board of Education Ms. Susan McNabb Mr. Bill Clements Mr. Chuck Shipp Mr. Carl Barger Dr. Adam Lamey Dr. Quentin Washispack Mr. Andre
Updated: December Educational Attainment
 Updated: Educational Attainment Among 25- to 29-year olds, the proportions who have attained a high school education, some college, or a bachelor s degree are all rising, according to longterm trends.
UK Institutional Research Brief: Results of the 2012 National Survey of Student Engagement: A Comparison with Carnegie Peer Institutions
 UK Institutional Research Brief: Results of the 2012 National Survey of Student Engagement: A Comparison with Carnegie Peer Institutions November 2012 The National Survey of Student Engagement (NSSE) has
Serving Country and Community: A Study of Service in AmeriCorps. A Profile of AmeriCorps Members at Baseline. June 2001
 Serving Country and Community: A Study of Service in AmeriCorps Cambridge, MA Lexington, MA Hadley, MA Bethesda, MD Washington, DC Chicago, IL Cairo, Egypt Johannesburg, South Africa A Profile of AmeriCorps
EXECUTIVE SUMMARY. Online courses for credit recovery in high schools: Effectiveness and promising practices. April 2017
 EXECUTIVE SUMMARY Online courses for credit recovery in high schools: Effectiveness and promising practices April 2017 Prepared for the Nellie Mae Education Foundation by the UMass Donahue Institute 1
Peer Influence on Academic Achievement: Mean, Variance, and Network Effects under School Choice
 Megan Andrew Cheng Wang Peer Influence on Academic Achievement: Mean, Variance, and Network Effects under School Choice Background Many states and municipalities now allow parents to choose their children
Trends in Tuition at Idaho s Public Colleges and Universities: Critical Context for the State s Education Goals
 1 Trends in Tuition at Idaho s Public Colleges and Universities: Critical Context for the State s Education Goals June 2017 Idahoans have long valued public higher education, recognizing its importance
What Is The National Survey Of Student Engagement (NSSE)?
?") National Survey of Student Engagement (NSSE) 2000 Results for Montclair State University What Is The National Survey Of Student Engagement (NSSE)? US News and World Reports Best College Survey is due next
National Survey of Student Engagement (NSSE) 2000 Results for Montclair State University What Is The National Survey Of Student Engagement (NSSE)? US News and World Reports Best College Survey is due next
Getting Results Continuous Improvement Plan
 Page of 9 9/9/0 Department of Education Market Street Harrisburg, PA 76-0 Getting Results Continuous Improvement Plan 0-0 Principal Name: Ms. Sharon Williams School Name: AGORA CYBER CS District Name:
1.0 INTRODUCTION. The purpose of the Florida school district performance review is to identify ways that a designated school district can:
 1.0 INTRODUCTION 1.1 Overview Section 11.515, Florida Statutes, was created by the 1996 Florida Legislature for the purpose of conducting performance reviews of school districts in Florida. The statute
Statistical Peers for Benchmarking 2010 Supplement Grade 11 Including Charter Schools NMSBA Performance 2010
 Statistical Peers for Benchmarking 2010 Supplement Grade 11 Including Charter Schools NMSBA Performance 2010 September 2010 River Dunavin 1 ALBUQUERQUE PUBLIC SCHOOLS BOARD OF EDUCATION PAULA MAES Vice
Basic Skills Initiative Project Proposal Date Submitted: March 14, Budget Control Number: (if project is continuing)
") Basic Skills Initiative Project Proposal 2016-2017 Date Submitted: March 14, 2016 Check One: New Proposal: Continuing Project: X Budget Control Number: (if project is continuing) Control # 87-413 - EOPS
Basic Skills Initiative Project Proposal 2016-2017 Date Submitted: March 14, 2016 Check One: New Proposal: Continuing Project: X Budget Control Number: (if project is continuing) Control # 87-413 - EOPS
Colorado s Unified Improvement Plan for Schools for Online UIP Report
 Colorado s Unified Improvement Plan for Schools for 2015-16 Online UIP Report Organization Code: 2690 District Name: PUEBLO CITY 60 Official 2014 SPF: 1-Year Executive Summary How are students performing?
Evaluation of a College Freshman Diversity Research Program
 Evaluation of a College Freshman Diversity Research Program Sarah Garner University of Washington, Seattle, Washington 98195 Michael J. Tremmel University of Washington, Seattle, Washington 98195 Sarah
Raw Data Files Instructions
 Raw Data Files Instructions Colleges will report the above information for students in the Main Cohort for each of the reporting timeframes and the system will calculate the sub cohorts and metrics based
Data Glossary. Summa Cum Laude: the top 2% of each college's distribution of cumulative GPAs for the graduating cohort. Academic Honors (Latin Honors)
") Institutional Research and Assessment Data Glossary This document is a collection of terms and variable definitions commonly used in the universities reports. The definitions were compiled from various
Institutional Research and Assessment Data Glossary This document is a collection of terms and variable definitions commonly used in the universities reports. The definitions were compiled from various
Charter School Performance Comparable to Other Public Schools; Stronger Accountability Needed
 April 2005 Report No. 05-21 Charter School Performance Comparable to Other Public Schools; Stronger Accountability Needed at a glance On average, charter school students are academically behind when they
Testimony to the U.S. Senate Committee on Health, Education, Labor and Pensions. John White, Louisiana State Superintendent of Education
 Testimony to the U.S. Senate Committee on Health, Education, Labor and Pensions John White, Louisiana State Superintendent of Education October 3, 2017 Chairman Alexander, Senator Murray, members of the
ADMISSION TO THE UNIVERSITY
 ADMISSION TO THE UNIVERSITY William Carter, Director of Admission College Hall 140. MSC 128. Extension 2315. Texas A&M University-Kingsville adheres to high standards of academic excellence and admits
46 Children s Defense Fund
 Nationally, about 1 in 15 teens ages 16 to 19 is a dropout. Fewer than two-thirds of 9 th graders in Florida, Georgia, Louisiana and Nevada graduate from high school within four years with a regular diploma.
Cuero Independent School District
 Cuero Independent School District Texas Superintendent: Henry Lind Primary contact: Debra Baros, assistant superintendent* 1,985 students, prek-12, rural District Description Cuero Independent School District
2015 High School Results: Summary Data (Part I)
") 1 2015 High School Results: Summary Data (Part I) October 27, 2015 Dr. Gregory E. Thornton CEO, Baltimore City Public Schools Theresa D. Jones Chief Achievement and Accountability Officer HS Data Summary
1 2015 High School Results: Summary Data (Part I) October 27, 2015 Dr. Gregory E. Thornton CEO, Baltimore City Public Schools Theresa D. Jones Chief Achievement and Accountability Officer HS Data Summary
Minnesota s Consolidated State Plan Under the Every Student Succeeds Act (ESSA)
") Minnesota s Consolidated State Plan Under the Every Student Succeeds Act (ESSA) To be submitted to the U.S. Department of Education in September 2017 IMPORTANT NOTE: This is an early draft prepared for
Minnesota s Consolidated State Plan Under the Every Student Succeeds Act (ESSA) To be submitted to the U.S. Department of Education in September 2017 IMPORTANT NOTE: This is an early draft prepared for
BENCHMARK TREND COMPARISON REPORT:
 National Survey of Student Engagement (NSSE) BENCHMARK TREND COMPARISON REPORT: CARNEGIE PEER INSTITUTIONS, 2003-2011 PREPARED BY: ANGEL A. SANCHEZ, DIRECTOR KELLI PAYNE, ADMINISTRATIVE ANALYST/ SPECIALIST
ADDENDUM 2016 Template - Turnaround Option Plan (TOP) - Phases 1 and 2 St. Lucie Public Schools
 - Phases 1 and 2 St. Lucie Public Schools") ADDENDUM 2016 Template - Turnaround Option Plan (TOP) - Phases 1 and 2 St. Lucie Public Schools The district requests an additional year to implement the previously approved turnaround option. Evidence
ADDENDUM 2016 Template - Turnaround Option Plan (TOP) - Phases 1 and 2 St. Lucie Public Schools The district requests an additional year to implement the previously approved turnaround option. Evidence
Fostering Equity and Student Success in Higher Education
 Fostering Equity and Student Success in Higher Education Laura I Rendón Professor Emerita University of Texas-San Antonio Presentation at NTCC 22 nd Annual Fall Leadership Conference Gainsesville, TX September
Like much of the country, Detroit suffered significant job losses during the Great Recession.
 36 37 POPULATION TRENDS Economy ECONOMY Like much of the country, suffered significant job losses during the Great Recession. Since bottoming out in the first quarter of 2010, however, the city has seen
STEM Academy Workshops Evaluation
 OFFICE OF INSTITUTIONAL RESEARCH RESEARCH BRIEF #882 August 2015 STEM Academy Workshops Evaluation By Daniel Berumen, MPA Introduction The current report summarizes the results of the research activities
The Impacts of Regular Upward Bound on Postsecondary Outcomes 7-9 Years After Scheduled High School Graduation
 Contract No.: EA97030001 MPR Reference No.: 6130-800 The Impacts of Regular Upward Bound on Postsecondary Outcomes 7-9 Years After Scheduled High School Graduation Final Report January 2009 Neil S. Seftor
2013 TRIAL URBAN DISTRICT ASSESSMENT (TUDA) RESULTS
 RESULTS") 3 TRIAL URBAN DISTRICT ASSESSMENT (TUDA) RESULTS Achievement and Accountability Office December 3 NAEP: The Gold Standard The National Assessment of Educational Progress (NAEP) is administered in reading
3 TRIAL URBAN DISTRICT ASSESSMENT (TUDA) RESULTS Achievement and Accountability Office December 3 NAEP: The Gold Standard The National Assessment of Educational Progress (NAEP) is administered in reading
EXPANSION PACKET Revision: 2015
 EXPANSION PACKET Revision: 2015 Letter from the Executive Director Dear Prospective Members: We are pleased with your interest in Sigma Lambda Beta International Fraternity. Since April 4, 1986, Sigma
President Abraham Lincoln Elementary School
 Code: 134 President Abraham Lincoln Elementary Status and Improvement Report Year -04 Focus On Standards Grades K-5 Focus on Standards Description Contents p. 1 p. 1 This Status and Improvement Report
Running Head GAPSS PART A 1
 Running Head GAPSS PART A 1 Current Reality and GAPSS Assignment Carole Bevis PL & Technology Innovation (ITEC 7460) Kennesaw State University Ed.S. Instructional Technology, Spring 2014 GAPSS PART A 2
John F. Kennedy Middle School
 John F. Kennedy Middle School CUPERTINO UNION SCHOOL DISTRICT Steven Hamm, Principal hamm_steven@cusdk8.org School Address: 821 Bubb Rd. Cupertino, CA 95014-4938 (408) 253-1525 CDS Code: 43-69419-6046890
Enrollment Trends. Past, Present, and. Future. Presentation Topics. NCCC enrollment down from peak levels
 Presentation Topics 1. Enrollment Trends 2. Attainment Trends Past, Present, and Future Challenges & Opportunities for NC Community Colleges August 17, 217 Rebecca Tippett Director, Carolina Demography
Best Colleges Main Survey
 Best Colleges Main Survey Date submitted 5/12/216 18::56 Introduction page 1 / 146 BEST COLLEGES Data Collection U.S. News has begun collecting data for the 217 edition of Best Colleges. The U.S. News
Psychometric Research Brief Office of Shared Accountability
 August 2012 Psychometric Research Brief Office of Shared Accountability Linking Measures of Academic Progress in Mathematics and Maryland School Assessment in Mathematics Huafang Zhao, Ph.D. This brief
NATIONAL CENTER FOR EDUCATION STATISTICS
 NATIONAL CENTER FOR EDUCATION STATISTICS Palm Desert, CA The Integrated Postsecondary Education Data System (IPEDS) is the nation s core postsecondary education data collection program. It is a single,
Status of Latino Education in Massachusetts: A Report
 University of Massachusetts Boston ScholarWorks at UMass Boston Gastón Institute Publications Gastón Institute for Latino Community Development and Public Policy Publications 3-1-2008 Status of Latino
2012 New England Regional Forum Boston, Massachusetts Wednesday, February 1, More Than a Test: The SAT and SAT Subject Tests
 2012 New England Regional Forum Boston, Massachusetts Wednesday, February 1, 2012 More Than a Test: The SAT and SAT Subject Tests 1 Presenters Chris Lucier Vice President for Enrollment Management, University
Standardized Assessment & Data Overview December 21, 2015
 Standardized Assessment & Data Overview December 21, 2015 Peters Township School District, as a public school entity, will enable students to realize their potential to learn, live, lead and succeed. 2
Student Support Services Evaluation Readiness Report. By Mandalyn R. Swanson, Ph.D., Program Evaluation Specialist. and Evaluation
 Student Support Services Evaluation Readiness Report By Mandalyn R. Swanson, Ph.D., Program Evaluation Specialist and Bethany L. McCaffrey, Ph.D., Interim Director of Research and Evaluation Evaluation
Governors and State Legislatures Plan to Reauthorize the Elementary and Secondary Education Act
 Governors and State Legislatures Plan to Reauthorize the Elementary and Secondary Education Act Summary In today s competitive global economy, our education system must prepare every student to be successful
Graduate Division Annual Report Key Findings
 Graduate Division 2010 2011 Annual Report Key Findings Trends in Admissions and Enrollment 1 Size, selectivity, yield UCLA s graduate programs are increasingly attractive and selective. Between Fall 2001
Samuel Enoka Kalama Intermediate School
 Code: 420 Samuel Enoka Kalama Intermediate Status and Improvement Report Year 2014-15 Focus On Standards Grades 6-8 Contents This Status and Improvement Report has been prepared as part of the Department's
Is Open Access Community College a Bad Idea?
 Is Open Access Community College a Bad Idea? The authors of the book Community Colleges and the Access Effect argue that low expectations and outside pressure to produce more graduates could doom community
About the College Board. College Board Advocacy & Policy Center
 15% 10 +5 0 5 Tuition and Fees 10 Appropriations per FTE ( Excluding Federal Stimulus Funds) 15% 1980-81 1981-82 1982-83 1983-84 1984-85 1985-86 1986-87 1987-88 1988-89 1989-90 1990-91 1991-92 1992-93
Denver Public Schools
 2017 Candidate Surveys Denver Public Schools Denver School Board District 4: Northeast DPS District 4 - Introduction School board elections offer community members the opportunity to reflect on the state
University of Utah. 1. Graduation-Rates Data a. All Students. b. Student-Athletes
 University of Utah FRESHMAN-COHORT GRADUATION RATES All Students Student-Athletes # 2009-10 Graduation Rate 64% 64% Four-Class Average 61% 64% Student-Athlete Graduation Success Rate 87% 1. Graduation-Rates
HIGHLAND HIGH SCHOOL CREDIT FLEXIBILITY PLAN
 HIGHLAND HIGH SCHOOL CREDIT FLEXIBILITY PLAN TABLE OF CONTENTS Overview 1 Eligible Credit Flexibility Plans 2 Earned Credit from Credit Flexibility Plans 2 Student Athletes 3 Application Process 3 Final
Institution-Set Standards: CTE Job Placement Resources. February 17, 2016 Danielle Pearson, Institutional Research
 Institution-Set Standards: CTE Job Placement Resources February 17, 2016 Danielle Pearson, Institutional Research Standard 1.B.3 states: The institution establishes institution-set standards for student
EFFECTS OF MATHEMATICS ACCELERATION ON ACHIEVEMENT, PERCEPTION, AND BEHAVIOR IN LOW- PERFORMING SECONDARY STUDENTS
 EFFECTS OF MATHEMATICS ACCELERATION ON ACHIEVEMENT, PERCEPTION, AND BEHAVIOR IN LOW- PERFORMING SECONDARY STUDENTS Jennifer Head, Ed.S Math and Least Restrictive Environment Instructional Coach Department
National Survey of Student Engagement Spring University of Kansas. Executive Summary
 National Survey of Student Engagement Spring 2010 University of Kansas Executive Summary Overview One thousand six hundred and twenty-one (1,621) students from the University of Kansas completed the web-based
Demographic Survey for Focus and Discussion Groups
 Appendix F Demographic Survey for Focus and Discussion Groups Demographic Survey--Lesbian, Gay, and Bisexual Discussion Group Demographic Survey Faculty with Disabilities Discussion Group Demographic Survey
Evaluation of Teach For America:
 EA15-536-2 Evaluation of Teach For America: 2014-2015 Department of Evaluation and Assessment Mike Miles Superintendent of Schools This page is intentionally left blank. ii Evaluation of Teach For America:
Idaho Public Schools
 Advanced Placement: Student Participation 13.5% increase in the number of students participating between 25 and 26 In 26: 3,79 Idaho Public School Students took AP Exams In 25: 3,338 Idaho Public School
Connecting to the Big Picture: An Orientation to GEAR UP
 Connecting to the Big Picture: An Orientation to GEAR UP About the National Council for Community and Education Partnerships (NCCEP) Our mission is to build the capacity of communities to ensure that underserved
SASKATCHEWAN MINISTRY OF ADVANCED EDUCATION
 SASKATCHEWAN MINISTRY OF ADVANCED EDUCATION Report March 2017 Report compiled by Insightrix Research Inc. 1 3223 Millar Ave. Saskatoon, Saskatchewan T: 1-866-888-5640 F: 1-306-384-5655 Table of Contents