Puerto Rican Post-Maria Relocation by States
|
|
|
- Laura Washington
- 6 years ago
- Views:
Transcription

1 Puerto Rican Post-Maria Relocation by States RESEARCH BRIEF Issued March 2018 By: Jennifer Hinojosa, Nashia Román, and Edwin Meléndez Centro RB This research brief presents findings of the relocation of Puerto Ricans to the U.S. mainland as a result of aftermath of- Hurricane Maria. Data from FEMA and school enrollment data from the selected state s Department of Education were used to analyze Puerto Rican relocation patterns in the U.S. mainland. Prior estimates of the magnitude of this exodus have been based on movement of passengers or statistical projections based on recent migration trends from Puerto Rico to the United States. In this report, we use post-hurricane Maria school enrollment data from Florida, New York, Connecticut, Massachusetts, Pennsylvania, New Jersey and Illinois school districts and FEMA to assess the population flows and relocation from Puerto Rico to the U.S. mainland. In the decades prior to Hurricane Maria, in the post-economic crisis exodus also known as the Millennial Migration, Florida became the preferred destination of Puerto Rican migrants. According to the most recent data available from the U.S. Census Bureau, migration from Puerto Rico to Florida increased significantly from less than half a million at the turn of the new millennium to 1,067,747 by 2016 and after the post Hurricane Maria exodus, the state is expected to have the largest share of Puerto Ricans in the U.S. mainland. Overall, the findings from the FEMA data show that Puerto Ricans have dispersed throughout the United States to a large extent following existing population nodes, showing recent migration flows to the Northeast and to the U.S. south in particular. DATA AND METHODS In this study we use school enrollment and FEMA changeof-addresses data as indicators of the relocation of Puerto Rican migrants to the U.S. mainland. We assume that families that enroll their children in a state s school system are more likely to stay over a longer period of time or to relocate permanently than families that have a shorter time horizon in mind and that chose not to enroll their children in schools. Data from FEMA include self-reported data on any survivor s current mailing address who first registered claims with FEMA in 2017 as a result of Hurricane Maria and Hurricane Irma--it is important to note that addresses are often change and not notified to FEMA. Furthermore, data is divided by the number of households and the number of total household members within a household by county. The data presented here is a snapshot at a point of time. The total number of incoming Puerto Rican migrants and settlement, as projected from FEMA and school enrollment data, changes continuously due to individuals and families moving to other states, moving back to Puerto Rico, or moving to other school districts or counties within the same states. 1
2 SCHOOL ENROLLMENT ESTIMATES The school enrollment data indicates that just five months after the Hurricane Maria catastrophe, the exodus of Puerto Ricans to the states with the largest concentrations of recent emigrants--florida, Massachusetts, Pennsylvania, New York, Connecticut, New Jersey and Illinois--reached the lower bound predication of the prior study for school-age children. The following estimates below shows school enrollment data collected between December 1st and February 22th, 2017 by school districts. According to our survey of seven school districts and data provided by the Governor s office, 11,554 Puerto Rican students enrolled in Florida s school districts, 2,556 in Massachusetts, 2,874 in Pennsylvania, 2,218 in New York, 1,827 in Connecticut, 886 in New Jersey, and 607 in Illinois. Overall, student enrollment in all school districts surveyed for this study exceeded the lower bound estimates, however, Massachusetts, Connecticut and New York surpassed the predicted estimates (see table 1). In the case of Massachusetts and Connecticut, school enrollment was near the upper bound estimates relative to the other states in this study. On the other hand, Florida, Pennsylvania, and New Jersey school enrollment has yet to pass the predicted estimates of incoming school age children (see table 1). Florida According to Florida s Department of Education a total of 11,554 students from Puerto Rico enrolled in Florida s public-school districts, this is a 12% increase since December 5, 2017, when a total of 10,324 students were Table 1. Enrollment of Post-Maria Age Children and Predicted Estimates by Selected States P u e r t o R i c a n C h i l d r e n Population (2016) Average of -Age Children Migrants ( ) Lower Bound Upper Bound Enrollment Data All States 1,220,906 13,050 10,324 11,554 n/a Selected States 972,578 10,732 8,643 9,828 22,247 Florida 227,430 4,955 2,590 3,285 11,554 Pennsylvania 114,620 1,652 1,960 1,619 2,599 Texas 44,204 1, n/a New York 215, ,218 Massachusetts 80, ,556 New Jersey 102, Connecticut 68, ,827 Ohio 32, n/a California 41, n/a Illinois 45, Source: American Community Suvey, various years and survey of selected Department of Education. Note: Lower bound estimates are double the lowest number of migrants registered during the prior three years. Upper bound estimates are three times the highest number of migrants registered during the prior three years. Since the ACS estimates are based on random sampling of the population, the smaller the numbers reported in this table the larger the margin of error for the estimates. 2
3 enrolled. Relative to other states surveyed for this report, Florida s school districts were the most impacted of incoming school age children from Puerto Rico as a result of the exodus after Hurricane Maria. According to our prior estimates reported in October 2017, the total number of school age Puerto Rican children in Florida (11,554), surpassed the predicted lower bound estimates, and is currently between our lower (9,666) and upper bound (15,408) predicted estimates (Meléndez and Hinojosa, 2017). To date, this figure (11,554) represents an increase of 9% over the school enrollment level in 2015 of Puerto Rican students statewide (see table 2). Between December 5th and February 6th, 2018, Florida s school districts continue to show an influx of incoming students from Puerto Rico, especially in school districts in Central and Southeast regions (see figure 1). As of February 6th, 2018, at least 60% of Puerto Rican school age children from Puerto Rico who relocated to Central Florida alone, and are enrolled primarily in the following counties: 22% in Orange County school districts, 19 percent in Osceola, 8% in Hillsborough, and 7% in Polk County. Compared to school enrollment data reported in December 5, 2017, Central Florida showed an increase from 53% to 60%, a 7-percentage point increase. Osceola County school districts (-341), Lee (-192), and Hillsborough (-88) were among the counties to show student enrollment decline since December. On the other hand, Orange County school districts showed the highest increase from 2,590 students in December to 3,285 students in February, an increase of 700 students. In addition to Orange County school districts located in central Florida, Lake (293) Polk (154), Seminole (123), and Volusia (104), showed increase of one hundred students or more during the three-month period. districts located in the south region of the state also showed a slight increase from 19% from December 2017 to 20 percent in February 2018, an addition of 337 students. In absolute terms, Miami-Dade County school districts showed the largest increase of student enrollment from 788 to 911 students from Puerto Rico, a difference of 123 students. Broward County school districts also showed an increase of 123 students (from 642 to 735 students). Table 2. Puerto Rican Student Enrollment in Florida Districts K-12 Puerto Rican S t u d e n t E n r o l l m e n t (2015) Enrollment as of 12/5/2018 Enrollement as of 2/6/2018 % Increase of Over Enrollment Level in 2015 Statewide Totals 210,004 10,324 11,554 6% Selected Counties 146,947 8,643 9,828 - Orange 36,143 2,590 3,285 9% Osceola 19,991 1,960 1,619 8% Miami-Dade 19, % Polk 10, % Hillsborough 23, % Broward 15, % Seminole 8, % Florida Virtual NA NA Palm Beach 9, % Lake 3, % Source: U.S. Census Bureau, 2015 American Community Survey 1-Year Estimates and Florida Deparment of Education 3
 in Florida Districts Source: Florida Deparment of Education Source: Florida Deparment of Education Massachusetts As of February 18th, 2018,")
4 Figure 1. Post-Hurricane Maria Puerto Rican Student Enrollment (K-12) in Florida Districts Source: Florida Deparment of Education Source: Florida Deparment of Education Massachusetts As of February 18th, 2018, a total of 2,556 students displaced by Hurricane Maria enrolled in Massachusetts school districts, an increase from 2,298 students since January 22, 2018, an 11% change. To date, this figure represents an increase of 3% over the school enrollment level in As shown in table 1, our prior estimates reported in October 2017, the total number of school age Puerto Rican children in Massachusetts (2,556), is almost as high as the predicted upper bound (2,580) estimate (Meléndez and Hinojosa, 2017). Between January 2017 and February 2018, in terms of absolute change, Worcester County school districts showed an increase of 68 students from Puerto Rico (from 477 to 545 students) followed by 51 in Hampden (from 815 to 866 students), 49 in Essex County (from 201 to 250 students), and 17 students in Suffolk. On the other hand, a few school districts showed no change or a slight decline of student enrollment. 4

5 Table 3. Puerto Rican Student Enrollment in Massachusetts Districts K-12 Puerto Rican S t u d e n t E n r o l l m e n t (2015) Enrollment as of 1/22/2018 Enrollement as of 2/18/2018 Source: U.S. Census Bureau, 2015 American Community Survey 1-Year Estimates and Massachusetts Deparment of Education % Increase of Over Enrollment Level in 2015 Statewide Total 77,325 2,298 2,556 3% Selected Counties Total 153,555 4,456 4,896 - Hampden 24, % Worcester 12, % Bristol 6, % Essex 10, % Suffolk 9, % Middlesex 7, % Plymouth 2, % Norfolk 2, % Hampshire % Franklin % Figure 2. Post-Hurricane Maria Puerto Rican Student Enrollment (K-12) in Massachusetts Source: Pennsylvania Deparment of Education 5
6 Pennsylvania As of February 22, 2018 a total of 2,874 student from Puerto Rico displaced by Hurricane Maria enrolled in Pennsylvania s school districts. This was an 8% increase from January 16, 2018, when a total of 2,407 Puerto Rican school age children enrolled in the state s school districts. To date, this figure (2,874) represents an increase of 3% over the school enrollment level in 2015 (see table 1). As shown in table 1, our prior estimates reported in October 2017, the total number of school age Puerto Rican children in Pennsylvania (2,874), surpassed the predicted lower bound estimates (880) (Meléndez and Hinojosa, 2017). Overall, school districts located in the southeast region of the state had the largest influx of Puerto Rican school age children (see figure 3). As of January 30, 2018, counties with the largest intake of Puerto Rican school age children were Lehigh County school districts (481 students) followed by Philadelphia (414), Berks (367), Dauphin (254), York (254), Lancaster (225), Northampton (213), and Lebanon (193). As show in figure 3, student enrollment from Puerto Rico was seen a lower rate on the western and central regions of the state like: Erie County (39 students), Franklin (26), Northumberland (26), Montgomery (31 students), Allegheny (23 students), and Schuylkill (14 students). In a one month span, Dauphin County school districts showed the largest absolute change of Puerto Rican student enrollment from 138 to 254 students followed by 88 students in Lehigh, 84 in Berks, and 49 in York. While Luzerne, Indiana, Northumberland, Carbon, Potter, and Lycoming showed slight decline of Puerto Rican student enrollment displaced by Hurricane Maria. Table 4. Puerto Rican Student Enrollment in Pennsylvania Districts K-12 Puerto Rican S t u d e n t E n r o l l m e n t (2015) Enrollment as of 1/16/2018 Enrollement as of 2/22/2018 % Increase of Over Enrollment Level in 2015 Statewide Total 108,390 2,407 2,874 3% Selected Counties 84,098 2,101 2,532 - Lehigh 11, % Philadelphia 31, % Berks 11, % Dauphin 3, % York 4, % Lancaster 9, % Northampton 5, % Lebanon 3, % Luzerne 1, % Lackawanna 1, % Source: U.S. Census Bureau, 2015 American Community Survey 1-Year Estimates and Pennsylvania Deparment of Education 6
 in Pennsylvania Source: Pennsylvania Deparment of Education New York 4 As of January 29th, 2018, a total of 2,218 students displaced from")
7 Figure 3. Post-Hurricane Maria Puerto Rican Student Enrollment (K-12) in Pennsylvania Source: Pennsylvania Deparment of Education New York 4 As of January 29th, 2018, a total of 2,218 students displaced from Puerto Rico have enrolled in New York State s school districts, this is an 8% increase since the total count of 2,052 in January 4th, To date, this figure (2,218) represents an increase of 1% over the school enrollment level in 2015 of Puerto Rican students (K-12) statewide. As shown in table 1, our prior estimates reported in October 2017, the total number of school age Puerto Rican children in New York (2,218), surpassed the predicted lower bound estimates and the predicted estimate (2,095) (Meléndez and Hinojosa, 2017). Overall, the proportion of displaced students from Puerto Rico who enrolled in upstate region school districts located in upstate regions of the state exceeded to students who enrolled in New York City school districts. Among the top 5 school districts, at least 21% of students from Puerto Rico enrolled in Rochester City schools (547 students) followed by 19% in Buffalo (455), 4% in New York City (411), 4% in Yonkers (98), and 2% in Syracuse (81). In terms of absolute change, 6 out of the 39 school districts reported by New York State s Department of Education, showed an increase of student enrollment of displaced students from Puerto Rico, while the 33 remaining school districts remained the same since the last time the data was collected. districts with significant increases included Dunkirk City (from 26 to 40 students) Syracuse City (from 53 to 81 students), Buffalo City school districts (from 374 to 455 students), and Rochester City (from 512 to 547 students). On the other hand, displaced students enrolled in New York City school districts remained at 411 7
8 Table 5. Puerto Rican Student Enrollment in New York Districts K-12 Puerto Rican Student Enrollment (2015) Enrollment as of 1/4/2018 Enrollement as of 1/29/2018 Source: U.S. Census Bureau, 2015 American Community Survey 1-Year Estimates and New York Deparment of Education % Increase of Over Enrollment Level in 2015 Statewide Total 231,384 2,052 2,218 1% Selected Counties Total 164,019 1,594 1,757 - Rochester City 8, % Buffalo City 6, % New York City 138, % Yonkers Public s 4, % Syracuse City 2, % Amsterdam City 1, % Dunkirk City % Binghamton City % * Mount Morris Central, Victor Central, East Ramapo, and Rensselaer City Utica City 1, % between both periods, as well as the remaining 33 school districts in the state. Connecticut As of February 9, 2018, Connecticut school districts received a total of 1,827 students from Puerto Rico as a result of Hurricane Maria, a 54% change compared to student enrollment reported in January 22, As shown in table 1, our prior estimates reported in October 2017, the total number of school age Puerto Rican children in Connecticut (1,827), surpassed the predicted lower bound estimates, and is currently near the upper bound (1,860) predicted estimate (Meléndez and Hinojosa, 2017). At least 39% of Puerto Rican students displaced by the storm were enrolled in Hartford County s school districts followed by 33% in New Haven, 9% in Fairfield, 5% in New London, 5% in Windham, and 1% in Middlesex. In a four-week span of school enrollment data reported on January 22 and February 9th, 2018, Connecticut s school districts showed an increase of 639 students. Unlike other states reported in this study, Puerto Rican student enrollment increased across all school districts in Connecticut. In absolute change, Hartford County school districts (from 494 to 710 students) showed the highest gain of Puerto Rican students displaced by the storm followed by New Haven (from 402 to 208 students), Fairfield (from 139 to 169 students), New London (from 76 to 91 students), Windham (from 65 to 86 students), and Middlesex (from 12 to 14 students). 8
 Enrollment as of 1/22/2018 Enrollement as of 2/18/2018 % Increase of Over")
9 Table 6. Puerto Rican Student Enrollment in Connecticut Districts K-12 Puerto Rican S t u d e n t E n r o l l m e n t (2015) Enrollment as of 1/22/2018 Enrollement as of 2/18/2018 % Increase of Over Enrollment Level in 2015 Statewide Total 71,538 1,188 1,827 3% Selected Counties Total 140,953 2,376 3,507 - Hartford 27, % New Haven 22, % Fairfield 12, % New London 4, % Windham 2, % Middlesex 1, % Source: U.S. Census Bureau, 2015 American Community Survey 1-Year Estimates and Connecticut Deparment of Education Figure 4. Post-Hurricane Maria Puerto Rican Student Enrollment (K-12) in Connecticut Source: Connecticut Deparment of Education 9
 Enrollment as of 2/22/2018 % Increase of Over Enrollment Level in 2015 Statewide")
10 Table 7. Puerto Rican Student Enrollment in New Jersey Districts K-12 Puerto Rican S t u d e n t E n r o l l m e n t (2015) Enrollment as of 2/22/2018 % Increase of Over Enrollment Level in 2015 Statewide 104, % Selected Counties 75, Camden 11, % Essex 12, % Cumberland 5, % Union 6, % Middlesex 9, % Passaic 9, % Atlantic 5, % Hudson 11, % Burlington 3, % Source: U.S. Census Bureau, 2015 American Community Survey 1-Year Estimates and New Jersey Deparment of Education Figure 5. Post-Hurricane Maria Puerto Rican Student Enrollment (K-12) in New Jersey Districts Source: New Jersey Deparment of Education 10
11 New Jersey 6 As of February 22, 2018, a total of 886 students displaced from Puerto Rico enrolled in New Jersey s school districts. To date, this figure (886) represents an increase of 1% over the school enrollment level in 2015 of Puerto Rican students (K-12) statewide. As shown in table 1, our prior estimates reported in October 2017, the total number of school age Puerto Rican children in New Jersey (866), surpassed the predicted lower bound estimates (Meléndez and Hinojosa, 2017). A large proportion of student enrollment relocated to Camden County school districts (139 students) followed by 10% in Essex (109 students), 9% in Cumberland (85 students), 8% in Union (82 students), 7% in Middlesex (71 students), 5% in Passaic County (61 students), and 5% in Atlantic (43 students). Illinois 7 A total of 607 students from Puerto Rico enrolled in Illinois school districts from September 20, 2017 to February 7, About half (50.1%) of Puerto Rican students enrolled in Chicago s public school districts. The remain ing students from Puerto Rico enrolled in Illinois s school districts are not reported in this study due restriction of reporting less than 10 students in school districts. FEMA RELOCATION ESTIMATES According to data provided by FEMA a total of 40,013 household members and 19,271 households, who changed their mailing address since they first registered with FEMA, re-located to the U.S. mainland as a result of Hurricane Maria. As shown in figure 6, Florida and other U.S. southern states received a majority of the Puerto Rican migrants. Yet, traditional states of settlements such as New York, Pennsylvania, Massachusetts, Connecticut, Illinois, Ohio, and California are currently experiencing population growth, and more importantly dispersed settlement patterns within their respective states when compared to existing Puerto Rican settlements (see figure 6). Post-Hurricane Maria Puerto Rican migrants are also relocating in areas beyond central cities of traditional states of settlement. enrollment data also show this trend, particularly in New York State, whereby Puer- Table 8. Distribution of FEMA Evacuees and Millennial Migrants ( ) in Selected States Total Puerto Rican Population 2016 % of Puerto Rican Population Millennial Migration % Millennial Migration Total FEMA Evacuees % FEMA Evacuees All States Total 5,450, % 64, % 40, % Selected States Total 4,423,107 81% 53,429 82% 35,584 89% Florida 1,067,747 20% 24,221 37% 18,013 45% Pennsylvania 444,263 8% 6,333 10% 2,954 7% Texas 196,460 4% 5,500 8% 1,361 3% New York 1,081,110 20% 3,822 6% 3,683 9% New Jersey 470,143 9% 3,251 5% 1,690 4% Massachusetts 319,042 6% 3,109 5% 3,399 8% Connecticut 298,245 5% 2,614 4% 2,281 6% Ohio 122,204 2% 2,420 4% 460 1% California 214,255 4% 1,145 2% 419 1% Illinois 209,638 4% 1,015 2% 1,324 3% Source: FEMA and U.S. Census Bureau, American Community Survey 1-year estimates 11
12 to Rican school-age children showed higher enrollment rates in New York State s upstate region than in school districts located in New York City (see table 7). Regionally, more than half of post-maria Puerto Rican migrants relocated in the South (55%) followed by 35% in the Northeast, 7% in Midwest, and 3% in West (see figure 6). In terms of total household members, Florida (18,013) received the most Puerto Rican evacuees followed by New York (3,683), Massachusetts (3,399), Pennsylvania (2,954), Connecticut (2,281), New Jersey (1,690), Texas (1,361), Illinois (1,324), Georgia (530), and Virginia (479). As shown in figure 6, Orange County (4,503) followed by Osceola (2,839), Miami-Dade (1,610), Polk (1,490), Hillsborough (1,366), Broward (1,122), and Seminole (815) counties showed the highest number of Puerto Rican evacuees. However, counties located in traditional states of settlements were also among the top counties with the most Puerto Rican evacuees, a total of: 1,290 evacuees relocated in Hampden (Massachusetts) followed by 1,289 in Philadelphia (Pennsylvania), 1,116 in Cook (Illinois), 1,001 in Hartford (Connecticut), 841 in Bronx (New York), 719 in New Haven (Connecticut), 589 in Worcester (Massachusetts), 587 in Monroe (Upstate New York), and 450 in Kings County (New York). Table 8 shows the population distribution by state of the total Puerto Rican population in 2016, the average number of Puerto Ricans who arrived between 2013 and 2016 (also known as the Millennial migration), and recent data from FEMA of the total household members evacuees in the selected states. It is evident that post-hurricane Puerto Rican migration is and continues to be driven by Millennial migration, in terms of relocating to similar states, located in both U.S. South, particularly Florida, and in traditional states of settlement. More importantly, Puerto Ricans showed dispersion within both states of new and traditional states, by residing in counties outside central cities. As shown in table 8, 45% of FEMA evacuees relocated to Florida followed by 9% in New York, 8% in Massachusetts, 7% in Pennsylvania, 6% in Connecticut, 4% in New Jersey, 3% in Texas, 3% in Illinois, 3% in Illinois, 1% in Georgia, and 1% in Virginia. On the other hand, Millennial migration also showed similar, if not close predicated estimates to the FEMA evacuee relocation. For example, during the Millennial migration period, at least 37% relocated to Florida followed by 10% in Pennsylvania, 8% in Texas, 6% in New York, 5% in New Jersey, 5% in Massachusetts, 4% in Connecticut, 4% in Ohio, 2% in California, and 2% in Illinois (see table 8). Eight out of the top 10 states discussed in this report are the same between the distribution of FEMA evacuees and millennial migrants (with the exception of Georgia and Virginia). DISCUSSION AND CONCLUSIONS To some extent, based on student enrollment and FEMA data, post-hurricane Maria migrants, generally followed the distribution and predication made from the average of the last three years of settlement from Puerto Rico as result of the Island s economic crisis. In other words, post-maria Puerto Rican migrants relocated to states where millennial migrants settled between 2013 and However, three states of traditional settlement like Massachusett, Connecticut, and New York whereby the magnitude of post-hurricane Maria Puerto Rican school age children arrivals was over what we had expected in our previous study (Meléndez and Hinojosa, 2017). For example, school age children in all three states surpassed our predicted estimates and it is expected to be greater than our upper bound estimates in the coming months. It is also important to note, that families and friends who lived in these traditional states like the Northeast (e.g., New York, Massachusetts, Connecticut, and New Jersey) and Midwest (e.g., Illinois), not identified through FEMA or school enrollment data, also played a major role in relocation by housing their friends and relatives displaced by Hurricane Maria. Puerto Ricans in the military service (inactive, active and veterans) also played a role in also relocating their friends and relatives in the New South, West and Midwest regions (Franqui-Riveria, 2017). According to Franqui-Riveria, top destination for Island-born active duty personnel included Texas, North Carolina, 12
13 Virginia, Florida, and Georgia (Franqui-Rivera, 2017). Overall, data from FEMA confirms that Puerto Rican evacuees are settling in almost every state and every region of the county (see figure 6). However, this trend is a continuation of the Millennial migration from Puerto Rico, stateside Puerto Ricans who were moving from state to state, and natural growth (Vargas-Ramos & Hinojosa, 2017). As discussed by Hinojosa and Vargas-Ramos (2017), between 2000 and 2014, the Puerto Rican population showed notable population growth in the U.S. south, particularly, in states like: North Carolina, Texas, Georgia, Virginia, and Florida, while states like Pennsylvania and Ohio, were among the only traditional states of settlement to show population growth. On the other hand, Puerto Rican population decline were observed in the following states of traditional settlement: New York, New Jersey, Illinois, and California. Lastly, Puerto Ricans in Connecticut and Massachusetts showed, at the time, no population growth or decline and instead remained steady between 2000 and However, this narrative of Puerto Rican population growth and decline change and has been intensified by the incoming Puerto Rican newcomers during the 2017 post-hurricane Maria wave. 13


")

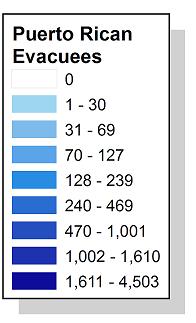
14 14 Figure 6. FEMA Evacuees (Total Household Members)


15 Figure 7. FEMA Evacuees in Selected Northeast States Figure 8. FEMA Evacuees in Florida 15
16 Notes 1. Edwin Meléndez and Jennifer Hinojosa, Estimates of Post-Hurricane Maria Exodus from Puerto Rico, Centro RB , Issued October As of February 18, Edwin Meléndez and Jennifer Hinojosa, Estimates of Post-Hurricane Maria Exodus from Puerto Rico, Centro RB , Issued October Due to unavailable data and numerous merges of school districts, mapping and comparative analysis is not discussed in this report for New York State. The most recent data, January 29, 2018 is analyzed and discussed in this research brief. 5. A total of 1,188 students were reported to have relocated to Connecticut s school districts on January 22, New Jersey s Department of Education cannot confirm that these aggregated counts at the county level include every student enrolled who was displaced from Puerto Rico by Hurricane Maria. Comparative analysis is not discussed in this report as the most recent data, 7. Due to unavailable data and numerous merges of school districts, mapping and comparative analysis is not discussed in this report for Illinois. The most recent data, February 7, 2018 is analyzed and discussed in this research brief. More importantly, students are not distinguished between who newly enrolled directly from Puerto Rico. 8. Add FEMA disclosure and data information. 9. According to the author he describes the New South as the former original confederate states. References Franqui-Rivera, Harry Migration and Military Service: a Pathway to the Middle Class. In State of Puerto Ricans 2017, eds.edwin Meléndez and Carlos Vargas-Ramos New York: Centro Press. Meléndez, Edwin, Hinojosa, Jennifer, and Roman, Nashia Post-Hurricane Maria Exodus from Puerto Rico and Enrollment in Florida. Research Brief. Center for Puerto Rican Studies, Hunter College,CUNY. Meléndez, Edwin and Hinojosa, Jennifer Estimates of Post-Hurricane Maria Exodus from Puerto Rico. Research Brief. Center for Puerto Rican Studies, Hunter College, CUNY. Vargas-Ramos, Carlos and Hinojosa, Jennifer Introduction. In The Almanac of Puerto Ricans in the United States, eds. Carlos Vargas-Ramos and Jennifer Hinojosa New York: Centro Press. The Center for Puerto Rican Studies (Centro) is the nation s leading university-based institution devoted to the interdisciplinary study of the Puerto Rican experience in the United States. Centro is dedicated to understanding, preserving and sharing the Puerto Rican experience in the United States. Centro invites Centro Voices contributors to make use of the extensive archival, bibliographic and research material preserved in its Library and Archives. The Centro Library and Archives is devoted to collecting, preserving and providing access to resources documenting the history and culture of Puerto Ricans. The Centro Library and Archives was established in 1973 as a component of the Center for Puerto Rican Studies. The collections include books, current and historic newspapers and periodicals, audio, film & video, manuscripts, photographs, art prints, and recorded music. The Library and Archives provides services and programs to the scholarly community as well as the general public. Constituents are diverse and come from the United States and abroad. The Library and Archives facilitates access to information on its holdings through the City University s online public catalog or CUNY+. It also provides research and information assistance via phone and . Centro Library and Archives Silberman Building, 2180 Third Avenue at 119th Street, Room 121, New York, N.Y Library: Archives: centropr.hunter.cuny Follow Hunter College, The City University of New York 695 Park Avenue, E1429 New York, N.Y Voic Fax: Center for Puerto Rican Studies Hunter College, CUNY 695 Park Avenue New York, NY , centropr.hunter.cuny.edu
Average Loan or Lease Term. Average
 Auto Credit For many working families and individuals, owning a car or truck is critical to economic success. For most, a car or other vehicle is their primary means of transportation to work. For those
BUILDING CAPACITY FOR COLLEGE AND CAREER READINESS: LESSONS LEARNED FROM NAEP ITEM ANALYSES. Council of the Great City Schools
 1 BUILDING CAPACITY FOR COLLEGE AND CAREER READINESS: LESSONS LEARNED FROM NAEP ITEM ANALYSES Council of the Great City Schools 2 Overview This analysis explores national, state and district performance
medicaid and the How will the Medicaid Expansion for Adults Impact Eligibility and Coverage? Key Findings in Brief
 on medicaid and the uninsured July 2012 How will the Medicaid Expansion for Impact Eligibility and Coverage? Key Findings in Brief Effective January 2014, the ACA establishes a new minimum Medicaid eligibility
46 Children s Defense Fund
 Nationally, about 1 in 15 teens ages 16 to 19 is a dropout. Fewer than two-thirds of 9 th graders in Florida, Georgia, Louisiana and Nevada graduate from high school within four years with a regular diploma.
Higher Education. Pennsylvania State System of Higher Education. November 3, 2017
 November 3, 2017 Higher Education Pennsylvania s diverse higher education sector - consisting of many different kinds of public and private colleges and universities - helps students gain the knowledge
2017 National Clean Water Law Seminar and Water Enforcement Workshop Continuing Legal Education (CLE) Credits. States
 Credits. States") t 2017 National Clean Water Law Seminar and Water Enforcement Workshop Continuing Legal Education (CLE) Credits NACWA has applied to the states listed below for Continuing Legal Education (CLE) credits.
t 2017 National Clean Water Law Seminar and Water Enforcement Workshop Continuing Legal Education (CLE) Credits NACWA has applied to the states listed below for Continuing Legal Education (CLE) credits.
STATE CAPITAL SPENDING ON PK 12 SCHOOL FACILITIES NORTH CAROLINA
 STATE CAPITAL SPENDING ON PK 12 SCHOOL FACILITIES NORTH CAROLINA NOVEMBER 2010 Authors Mary Filardo Stephanie Cheng Marni Allen Michelle Bar Jessie Ulsoy 21st Century School Fund (21CSF) Founded in 1994,
A Profile of Top Performers on the Uniform CPA Exam
 Marquette University e-publications@marquette Accounting Faculty Research and Publications Business Administration, College of 8-1-2014 A Profile of Top Performers on the Uniform CPA Exam Michael D. Akers
Two Million K-12 Teachers Are Now Corralled Into Unions. And 1.3 Million Are Forced to Pay Union Dues, as Well as Accept Union Monopoly Bargaining
 FACT SHEET National Institute for Labor Relations Research 5211 Port Royal Road, Suite 510 i Springfield, VA 22151 i Phone: (703) 321-9606 i Fax: (703) 321-7342 i research@nilrr.org i www.nilrr.org August
Reaching the Hispanic Market The Arbonne Hispanic Initiative
 Reaching the Hispanic Market The Arbonne Hispanic Initiative Hispanic Initiative Overview 2002 Arbonne en Español Started 2006 Initiated Hispanic Initiative 2007 Market Study & Survey Field Support» Jael
1.0 INTRODUCTION. The purpose of the Florida school district performance review is to identify ways that a designated school district can:
 1.0 INTRODUCTION 1.1 Overview Section 11.515, Florida Statutes, was created by the 1996 Florida Legislature for the purpose of conducting performance reviews of school districts in Florida. The statute
The following tables contain data that are derived mainly
 APPENDIX Medical Schools in the United s, 2012-2013 Barbara Barzansky, PhD; Sylvia I. Etzel The following tables contain data that are derived mainly from the 2012-2013 Liaison Committee on Medical Education
CHAPTER 4: REIMBURSEMENT STRATEGIES 24
 CHAPTER 4: REIMBURSEMENT STRATEGIES 24 INTRODUCTION Once state level policymakers have decided to implement and pay for CSR, one issue they face is simply how to calculate the reimbursements to districts
Educational Attainment
 A Demographic and Socio-Economic Profile of Allen County, Indiana based on the 2010 Census and the American Community Survey Educational Attainment A Review of Census Data Related to the Educational Attainment
The College of New Jersey Department of Chemistry. Overview- 2009
 The College of New Jersey Department of Chemistry Overview- 2009 Faculty Heba Abourahma John Allison Michelle Bunagan Lynn Bradley Benny Chan Don Hirsh Jinmo Huang David Hunt Stephanie Sen (plus currently
State of New Jersey
 OVERVIEW 1213 GRADE SPAN KG6 116946 GALLOWAY, NEW JERSEY 85 This school's academic performance is about average when compared to schools across the state. Additionally, its academic performance is very
The Value of English Proficiency to the. By Amber Schwartz and Don Soifer December 2012
 The Value of English Proficiency to the United States Economy By Amber Schwartz and Don Soifer December 2012 Also by the Lexington Institute: English Language Learners and NAEP: Progress Through Inclusion,
Iowa School District Profiles. Le Mars
 Iowa School District Profiles Overview This profile describes enrollment trends, student performance, income levels, population, and other characteristics of the public school district. The report utilizes
Price Sensitivity Analysis
 Executive Summary The present study set out to determine whether relationships existed between the change in tuition rates, tuition and fees rates, and tuition, fees, and room and board rates at Illinois
Wilma Rudolph Student Athlete Achievement Award
 Wilma Rudolph Student Athlete Achievement Award CRITERIA FOR NOMINATION The N4A Wilma Rudolph Student Athlete Achievement Award is intended to honor student athletes who have overcome great personal, academic,
Junior (61-90 semester hours or quarter hours) Two-year Colleges Number of Students Tested at Each Institution July 2008 through June 2013
 Two-year Colleges Number of Students Tested at Each Institution July 2008 through June 2013") Number of Students Tested at Each Institution July 2008 through June 2013 List of Institutions Number of School Name Students AIKEN TECHNICAL COLLEGE, SC 119 ARKANSAS NORTHEASTERN COLLEGE, AR 66 ASHLAND
Number of Students Tested at Each Institution July 2008 through June 2013 List of Institutions Number of School Name Students AIKEN TECHNICAL COLLEGE, SC 119 ARKANSAS NORTHEASTERN COLLEGE, AR 66 ASHLAND
Housekeeping. Questions
 Housekeeping To join us on audio, dial the phone number in the teleconference box and follow the prompts. Please dial in with your Attendee ID number. The Attendee ID number will connect your name in WebEx
Disciplinary action: special education and autism IDEA laws, zero tolerance in schools, and disciplinary action
 National Autism Data Center Fact Sheet Series March 2016; Issue 7 Disciplinary action: special education and autism IDEA laws, zero tolerance in schools, and disciplinary action The Individuals with Disabilities
SAT Results December, 2002 Authors: Chuck Dulaney and Roger Regan WCPSS SAT Scores Reach Historic High
 ABOUT THE SAT 2001-2002 SAT Results December, 2002 Authors: Chuck Dulaney and Roger Regan WCPSS SAT Scores Reach Historic High The Scholastic Assessment Test (SAT), more formally known as the SAT I: Reasoning
NATIONAL CENTER FOR EDUCATION STATISTICS
 NATIONAL CENTER FOR EDUCATION STATISTICS The Integrated Postsecondary Education Data System (IPEDS) is the core postsecondary education data collection program for the NCES. It is a single, comprehensive
Charter School Performance Comparable to Other Public Schools; Stronger Accountability Needed
 April 2005 Report No. 05-21 Charter School Performance Comparable to Other Public Schools; Stronger Accountability Needed at a glance On average, charter school students are academically behind when they
Like much of the country, Detroit suffered significant job losses during the Great Recession.
 36 37 POPULATION TRENDS Economy ECONOMY Like much of the country, suffered significant job losses during the Great Recession. Since bottoming out in the first quarter of 2010, however, the city has seen
EDUCATIONAL ATTAINMENT
 EDUCATIONAL ATTAINMENT By 2030, at least 60 percent of Texans ages 25 to 34 will have a postsecondary credential or degree. Target: Increase the percent of Texans ages 25 to 34 with a postsecondary credential.
Standardized Assessment & Data Overview December 21, 2015
 Standardized Assessment & Data Overview December 21, 2015 Peters Township School District, as a public school entity, will enable students to realize their potential to learn, live, lead and succeed. 2
cover Private Public Schools America s Michael J. Petrilli and Janie Scull
 cover America s Private Public Schools Michael J. Petrilli and Janie Scull February 2010 contents introduction 3 national findings 5 state findings 6 metropolitan area findings 13 conclusion 18 about us
ELLEN E. ENGEL. Stanford University, Graduate School of Business, Ph.D. - Accounting, 1997.
 ELLEN E. ENGEL September 2016 University of Illinois at Chicago Department of Accounting 601 S. Morgan Street Chicago, IL 60607 Office Phone: (312)-413-3418 Mobile Phone: (847) 644-2961 Email: elleneng@uic.edu
Invest in CUNY Community Colleges
 Invest in Opportunity Invest in CUNY Community Colleges Pat Arnow Professional Staff Congress Invest in Opportunity Household Income of CUNY Community College Students
Enrollment Trends. Past, Present, and. Future. Presentation Topics. NCCC enrollment down from peak levels
 Presentation Topics 1. Enrollment Trends 2. Attainment Trends Past, Present, and Future Challenges & Opportunities for NC Community Colleges August 17, 217 Rebecca Tippett Director, Carolina Demography
A Comparison of the ERP Offerings of AACSB Accredited Universities Belonging to SAPUA
 Association for Information Systems AIS Electronic Library (AISeL) SAIS 2004 Proceedings Southern (SAIS) 3-1-2004 A Comparison of the ERP Offerings of AACSB Accredited Universities Belonging to SAPUA Ronald
Susanna M Donaldson Curriculum Vitae
 Susanna M Donaldson Curriculum Vitae Department of Sociology and Anthropology 307 Knapp Hall Phone: (304) 293-8844 West Virginia University Fax: (304) 293-5994 Morgantown, WV 25606-6326 smdonaldson@mail.wvu.edu
Trends in Tuition at Idaho s Public Colleges and Universities: Critical Context for the State s Education Goals
 1 Trends in Tuition at Idaho s Public Colleges and Universities: Critical Context for the State s Education Goals June 2017 Idahoans have long valued public higher education, recognizing its importance
Kenya: Age distribution and school attendance of girls aged 9-13 years. UNESCO Institute for Statistics. 20 December 2012
 1. Introduction Kenya: Age distribution and school attendance of girls aged 9-13 years UNESCO Institute for Statistics 2 December 212 This document provides an overview of the pattern of school attendance
Higher Education Six-Year Plans
 Higher Education Six-Year Plans 2018-2024 House Appropriations Committee Retreat November 15, 2017 Tony Maggio, Staff Background The Higher Education Opportunity Act of 2011 included the requirement for
EDUCATIONAL ATTAINMENT
 EDUCATIONAL ATTAINMENT By 2030, at least 60 percent of Texans ages 25 to 34 will have a postsecondary credential or degree. Target: Increase the percent of Texans ages 25 to 34 with a postsecondary credential.
VOL VISION 2020 STRATEGIC PLAN IMPLEMENTATION
 VOL VISION 2020 STRATEGIC PLAN IMPLEMENTATION CONTENTS Vol Vision 2020 Summary Overview Approach Plan Phase 1 Key Initiatives, Timelines, Accountability Strategy Dashboard Phase 1 Metrics and Indicators
Stetson University College of Law Class of 2012 Summary Report
 Stetson University College Law Class 2012 Summary Report Full-time Long-term Salaries # with Salary 25th Median 75th Mean Total = 341 Gender : Women Men Subtotal Race : Minority Nonminority Subtotal Gender
HOUSE OF REPRESENTATIVES AS REVISED BY THE COMMITTEE ON EDUCATION APPROPRIATIONS ANALYSIS
 BILL #: HB 269 HOUSE OF REPRESENTATIVES AS REVISED BY THE COMMITTEE ON EDUCATION APPROPRIATIONS ANALYSIS RELATING TO: SPONSOR(S): School District Best Financial Management Practices Reviews Representatives
University of Essex Access Agreement
 University of Essex Access Agreement Updated in August 2009 to include new tuition fee and bursary provision for 2010 entry 1. Context The University of Essex is academically a strong institution, with
2013 donorcentrics Annual Report on Higher Education Alumni Giving
 213 donorcentrics Annual Report on Higher Education Alumni Giving Summary of Annual Fund Key Performance Indicators July 212-June 213 214 2 Daniel Island Drive, Charleston, SC 29492 T 8.443.9441 E solutions@blackbaud.com
The Demographic Wave: Rethinking Hispanic AP Trends
 The Demographic Wave: Rethinking Hispanic AP Trends Kelcey Edwards & Ellen Sawtell AP Annual Conference, Las Vegas, NV July 19, 2013 Exploring the Data Hispanic/Latino US public school graduates The Demographic
JOSHUA GERALD LEPREE
 JOSHUA GERALD LEPREE University of Colorado-Boulder, Department of Sociology 195 Ketchum, 327 UCB, Boulder, CO 80309-0327 (305) 484-1065 Joshua.LePree@colorado.edu http://sociology.colorado.edu/people/lepree-josh
U VA THE CHANGING FACE OF UVA STUDENTS: SSESSMENT. About The Study
 About The Study U VA SSESSMENT In 6, the University of Virginia Office of Institutional Assessment and Studies undertook a study to describe how first-year students have changed over the past four decades.
Jon N. Kerr, PhD, CPA August 2017
 JON NATHAN KERR, PhD, CPA ASSISTANT PROFESSOR THE OHIO STATE UNIVERSITY FISHER COLLEGE OF BUSINESS 2100 NEIL AVENUE 400 FISHER HALL COLUMBUS, OH 43210 Email: kerr.360@osu.edu Office: Fax: EDUCATION Columbia
The Ohio State University Library System Improvement Request,
 The Ohio State University Library System Improvement Request, 2005-2009 Introduction: A Cooperative System with a Common Mission The University, Moritz Law and Prior Health Science libraries have a long
Update Peer and Aspirant Institutions
 Update Peer and Aspirant Institutions Prepared for Southern University at Shreveport January 2015 In the following report, Hanover Research describes the methodology used to identify Southern University
Continuing Education Seminar for New York & New Jersey Licensed Opticians
 Continuing Education Seminar for New York & New Jersey Licensed Opticians April 20, 2011 Hilton Garden Inn & Hampton Inn 270 West Route 59 Nanuet, New York 10954 (845) 623-0600 Both Courses Are OANJ &
Teacher Supply and Demand in the State of Wyoming
 Teacher Supply and Demand in the State of Wyoming Supply Demand Prepared by Robert Reichardt 2002 McREL To order copies of Teacher Supply and Demand in the State of Wyoming, contact McREL: Mid-continent
EVIDENCE BASED DESIGN FOR ELEMENTARY & SECONDARY SCHOOLS. PETER C. LIPPMAN, Assoc. AIA, REFP JCJ Architecture
 EVIDENCE BASED DESIGN FOR ELEMENTARY & SECONDARY SCHOOLS PETER C. LIPPMAN, Assoc. AIA, REFP JCJ Architecture CEFPI is a Registered Provider with The American Institute of Architects Continuing Education
Curriculum Vitae Sheila Gillespie Roth Address: 224 South Homewood Avenue Pittsburgh, Pennsylvania Telephone: (412)
") Curriculum Vitae Sheila Gillespie Roth Address: 224 South Homewood Avenue Pittsburgh, Pennsylvania 15208 Telephone: (412) 256-0341 EDUCATION 1991 Ph.D. Administration and Policy Studies University of Pittsburgh
Curriculum Vitae Sheila Gillespie Roth Address: 224 South Homewood Avenue Pittsburgh, Pennsylvania 15208 Telephone: (412) 256-0341 EDUCATION 1991 Ph.D. Administration and Policy Studies University of Pittsburgh
An Introduction to School Finance in Texas
 An Introduction to School Finance in Texas May 12, 2010 Sheryl Pace TTARA Research Foundation space@ttara.org (512) 472-8838 Texas Public Education System 1,300 school districts (#1 in the nation) 1,025
Miami-Dade County Public Schools
 ENGLISH LANGUAGE LEARNERS AND THEIR ACADEMIC PROGRESS: 2010-2011 Author: Aleksandr Shneyderman, Ed.D. January 2012 Research Services Office of Assessment, Research, and Data Analysis 1450 NE Second Avenue,
NORTH CAROLINA VIRTUAL PUBLIC SCHOOL IN WCPSS UPDATE FOR FALL 2007, SPRING 2008, AND SUMMER 2008
 E&R Report No. 08.29 February 2009 NORTH CAROLINA VIRTUAL PUBLIC SCHOOL IN WCPSS UPDATE FOR FALL 2007, SPRING 2008, AND SUMMER 2008 Authors: Dina Bulgakov-Cooke, Ph.D., and Nancy Baenen ABSTRACT North
Discussion Papers. Assessing the New Federalism. State General Assistance Programs An Urban Institute Program to Assess Changing Social Policies
 State General Assistance Programs 1998 L. Jerome Gallagher Cori E. Uccello Alicia B. Pierce Erin B. Reidy 99 01 Assessing the New Federalism An Urban Institute Program to Assess Changing Social Policies
2014 State Residency Conference Frequently Asked Questions FAQ Categories
 2014 State Residency Conference Frequently Asked Questions FAQ Categories Deadline... 2 The Five Year Rule... 3 Statutory Grace Period... 4 Immigration... 5 Active Duty Military... 7 Spouse Benefit...
University-Based Induction in Low-Performing Schools: Outcomes for North Carolina New Teacher Support Program Participants in
 University-Based Induction in Low-Performing Schools: Outcomes for North Carolina New Teacher Support Program Participants in 2014-15 In this policy brief we assess levels of program participation and
1GOOD LEADERSHIP IS IMPORTANT. Principal Effectiveness and Leadership in an Era of Accountability: What Research Says
 B R I E F 8 APRIL 2010 Principal Effectiveness and Leadership in an Era of Accountability: What Research Says J e n n i f e r K i n g R i c e For decades, principals have been recognized as important contributors
FY year and 3-year Cohort Default Rates by State and Level and Control of Institution
 Student Aid Policy Analysis FY2007 2-year and 3-year Cohort Default Rates by State and Level and Control of Institution Mark Kantrowitz Publisher of FinAid.org and FastWeb.com January 5, 2010 EXECUTIVE
Shelters Elementary School
 Shelters Elementary School August 2, 24 Dear Parents and Community Members: We are pleased to present you with the (AER) which provides key information on the 23-24 educational progress for the Shelters
OVERVIEW Getty Center Richard Meier Robert Irwin J. Paul Getty Museum Getty Research Institute Getty Conservation Institute Getty Foundation
 OVERVIEW LOS ANGELES Since opening its doors in 1997, the Getty Center has welcomed over 15 million visitors and become a cultural destination that has played a key role in helping Los Angeles become an
Effective Recruitment and Retention Strategies for Underrepresented Minority Students: Perspectives from Dental Students
 Critical Issues in Dental Education Effective Recruitment and Retention Strategies for Underrepresented Minority Students: Perspectives from Dental Students Naty Lopez, Ph.D.; Rose Wadenya, D.M.D., M.S.;
Trends in College Pricing
 Trends in College Pricing 2009 T R E N D S I N H I G H E R E D U C A T I O N S E R I E S T R E N D S I N H I G H E R E D U C A T I O N S E R I E S Highlights Published Tuition and Fee and Room and Board
Wings of Change. 12th Annual ALAS Education Summit. In This Issue. October 14-17, 2015 Albuquerque, New Mexico. Leading for Equity and Empowerment
 Volume 8 Number 3 Fall 2015 12th Annual ALAS Education Summit October 14-17, 2015 Albuquerque, New Mexico Leading for Equity and Empowerment The 2015 Education Summit convened education leaders from throughout
JOB OUTLOOK 2018 NOVEMBER 2017 FREE TO NACE MEMBERS $52.00 NONMEMBER PRICE NATIONAL ASSOCIATION OF COLLEGES AND EMPLOYERS
 NOVEMBER 2017 FREE TO NACE MEMBERS $52.00 NONMEMBER PRICE JOB OUTLOOK 2018 NATIONAL ASSOCIATION OF COLLEGES AND EMPLOYERS 62 Highland Avenue, Bethlehem, PA 18017 www.naceweb.org 610,868.1421 TABLE OF CONTENTS
National Survey of Student Engagement Spring University of Kansas. Executive Summary
 National Survey of Student Engagement Spring 2010 University of Kansas Executive Summary Overview One thousand six hundred and twenty-one (1,621) students from the University of Kansas completed the web-based
Virtual Learning in Virginia
 Virtual Learning in Virginia Programs Report and Expansion Proposal February 23, 2016 1 Virtual Learning Options in Virginia Virginia Department of Education Virtual Learning Programs Virtual Virginia
PIAA DISTRICT III POWER RANKINGS
 CLASS 6A GIRLS BASKETBALL Top 12 teams qualify for the 2016-2017 PIAA District III M&T Bank Class 6A Girls Basketball Championships 6A School W L T Rating TWP OWP 1 Cumberland Valley 17-1- 0 0.838316 0.965596
Suffolk County Civil Service Dispatcher Exam
 Suffolk County Dispatcher Exam Free PDF ebook Download: Suffolk County Dispatcher Exam Download or Read Online ebook suffolk county civil service dispatcher exam in PDF Format From The Best User Guide
Student Mobility Rates in Massachusetts Public Schools
 Student Mobility Rates in Massachusetts Public Schools Introduction The Massachusetts Department of Elementary and Secondary Education (ESE) calculates and reports mobility rates as part of its overall
ARSENAL OF DEMOCRACY
 ARSENAL OF DEMOCRACY Preview of Main Idea Between 1910 and 1930, Detroit became a major industrial center of the United States, indeed, the world. The ability of the automobile industry to produce an extraordinarily
Suggested Citation: Institute for Research on Higher Education. (2016). College Affordability Diagnosis: Maine. Philadelphia, PA: Institute for
. College Affordability Diagnosis: Maine. Philadelphia, PA: Institute for") MAINE Suggested Citation: Institute for Research on Higher Education. (2016). College Affordability Diagnosis: Maine. Philadelphia, PA: Institute for Research on Higher Education, Graduate School of Education,
MAINE Suggested Citation: Institute for Research on Higher Education. (2016). College Affordability Diagnosis: Maine. Philadelphia, PA: Institute for Research on Higher Education, Graduate School of Education,
Executive Summary. DoDEA Virtual High School
 New York/Virginia/Puerto Rico District Dr. Terri L. Marshall, Principal 3308 John Quick Rd Quantico, VA 22134-1752 Document Generated On February 25, 2015 TABLE OF CONTENTS Introduction 1 Description of
Spanish Users and Their Participation in College: The Case of Indiana
 and Their Participation in College: The Case of Indiana CAROLINA PELAEZ-MORALES Purdue University Spanish has become a widely used second language in the U.S. As the number of Spanish users (SUs) continues
A Snapshot of the Graduate School
 A Snapshot of the Graduate School Prepared for the Research Council February 6, 2009 John R. Mullin, Ph.D., FAICP Dean of the Graduate School University of Massachusetts Amherst Graduate School Purpose
2/3 9.8% 38% $0.78. The Status of Women in Missouri: 2016 ARE WOMEN 51% 22% A Comprehensive Report of Leading Indicators and Findings.
 A Missouri WOMAN WORKING FULL-TIME EARNS ONLY $0.78 FOR EACH DOLLAR A MAN EARNS 2/3 OF Missouri SENIORS LIVING IN POVERTY ARE WOMEN 9.8% The Status of Women in Missouri: 2016 A Comprehensive Report of
Instrumentation, Control & Automation Staffing. Maintenance Benchmarking Study
 Electronic Document Instrumentation, Control & Automation Staffing Prepared by ITA Technical Committee, Maintenance Subcommittee, Task Force on IC&A Staffing John Petito, Chair Richard Haugh, Vice-Chair
Status of Women of Color in Science, Engineering, and Medicine
 Status of Women of Color in Science, Engineering, and Medicine The figures and tables below are based upon the latest publicly available data from AAMC, NSF, Department of Education and the US Census Bureau.
Student Admissions, Outcomes, and Other Data
 Student Admissions, Outcomes, and Other Data Data on Incoming Class UNL Clinical Psychology Training Program (CPTP) August Academic Year of Entry 7 8 9 Number of Applicants 9 7 8 8 8 Number Interviewed
Beyond The Forest Jewish Presence In Eastern Europe, by Loli Kantor
 1 LOLI KANTOR EXHIBITION PROPOSAL To coincide with the forthcoming publication, book signing and lecture presentation, Beyond The Forest Jewish Presence In Eastern Europe, 2004-2012 by Loli Kantor A Forthcoming
Focus Groups and Student Learning Assessment
 Focus Groups and Student Learning Assessment What is a Focus Group? A focus group is a guided discussion whose intent is to gather open-ended ended comments about a specific issue For student learning
FOR TEACHERS ONLY RATING GUIDE BOOKLET 1 OBJECTIVE AND CONSTRUCTED RESPONSE JUNE 1 2, 2005
 FOR TEACHERS ONLY THE UNIVERSITY OF THE STATE OF NEW YORK GRADE 8 INTERMEDIATE-LEVEL TEST SOCIAL STUDIES RATING GUIDE BOOKLET 1 OBJECTIVE AND CONSTRUCTED RESPONSE JUNE 1 2, 2005 Updated information regarding
2016 Match List. Residency Program Distribution by Specialty. Anesthesiology. Barnes-Jewish Hospital, St. Louis MO
 2016 Match List Residency Program Distribution by Specialty Anesthesiology Cleveland Clinic Foundation - Ohio, Cleveland OH University of Arkansas Medical School - Little Rock, Little Rock AR University
MS-431 The Cold War Aerospace Technology Oral History Project. Creator: Wright State University. Department of Archives and Special Collections
 MS-431 The Cold War Aerospace Technology Oral History Project Collection Number: MS-431 Title: The Cold War Aerospace Technology Oral History Project Creator: Wright State University. Department of Archives
A LIBRARY STRATEGY FOR SUTTON 2015 TO 2019
 A LIBRARY STRATEGY FOR SUTTON 2015 TO 2019 Page 15 Agenda Item 4 INTRODUCTION AND SUMMARY Library services provided in the London Borough of Sutton have been at the forefront of innovative and customer
NASWA SURVEY ON PELL GRANTS AND APPROVED TRAINING FOR UI SUMMARY AND STATE-BY-STATE RESULTS
 NASWA SURVEY ON PELL GRANTS AND APPROVED TRAINING FOR UI SUMMARY AND STATE-BY-STATE RESULTS FINAL: 3/22/2010 Contact: Yvette Chocolaad Director, Center for Employment Security Education and Research National
CLASS EXODUS. The alumni giving rate has dropped 50 percent over the last 20 years. How can you rethink your value to graduates?
 The world of advancement is facing a crisis in numbers. In 1990, 18 percent of college and university alumni gave to their alma mater, according to the Council for Aid to Education. By 2013, that number
Western Australia s General Practice Workforce Analysis Update
 Western Australia s General Practice Workforce Analysis Update NOVEMBER 2015 PUBLISHED MAY 2016 Rural Health West This work is copyright. Apart from any use as permitted under the Copyright Act 1968, no
Graduate Division Annual Report Key Findings
 Graduate Division 2010 2011 Annual Report Key Findings Trends in Admissions and Enrollment 1 Size, selectivity, yield UCLA s graduate programs are increasingly attractive and selective. Between Fall 2001
ADVANCED PLACEMENT STUDENTS IN COLLEGE: AN INVESTIGATION OF COURSE GRADES AT 21 COLLEGES. Rick Morgan Len Ramist
 February 1998 Report No. SR-98-13 ADVANCED PLACEMENT STUDENTS IN COLLEGE: AN INVESTIGATION OF COURSE GRADES AT 21 COLLEGES Rick Morgan Len Ramist Unpublished Statistical Report This is a limited distribution
THE ECONOMIC IMPACT OF THE UNIVERSITY OF EXETER
 THE ECONOMIC IMPACT OF THE UNIVERSITY OF EXETER Report prepared by Viewforth Consulting Ltd www.viewforthconsulting.co.uk Table of Contents Executive Summary... 2 Background to the Study... 6 Data Sources
All Hands on Deck! Engaging Faculty Voices to Rise Above the Storm!
 All Hands on Deck! Engaging Faculty Voices to Rise Above the Storm! Introduction Five R s to Diversify Engineering Faculties Recruiting Faculty Colleagues Relating to Faculty Colleagues Retaining Colleagues
Alan D. Miller Faculty of Law and Department of Economics University of Haifa Mount Carmel, Haifa, 31905, Israel
 Alan D. Miller Faculty of Law and Department of Economics University of Haifa Mount Carmel, Haifa, 31905, Israel Until 2016 at: Searle Center on Law, Regulation, and Economic Growth Northwestern University
Giving in the Netherlands 2015
 Giving in the Netherlands 2015 Prof. R.H.F.P. Bekkers, Ph.D., Prof. Th.N.M. Schuyt, Ph.D., & Gouwenberg, B.M. (Eds., 2015). Giving in the Netherlands: Donations, Bequests, Sponsoring and Volunteering.
University of California, Irvine - Division of Continuing Education
 Waseda University, Study Abroad 2017 Waseda CS-L (Customized Study - Language Focused Program) at University of California, Irvine - Division of Continuing Education Location: P.O. Box 6050, Irvine, California
The University of Tennessee at Martin. Coffey Outstanding Teacher Award and Cunningham Outstanding Teacher / Scholar Award
 The University of Tennessee at Martin Coffey Outstanding Teacher Award and Cunningham Outstanding Teacher / Scholar Award Instructions Nominations and Submissions DESCRIPTION OF AWARDS The Coffey Outstanding
State Limits on Contributions to Candidates Election Cycle Updated June 27, PAC Candidate Contributions
 State Limits on to Candidates 2017-2018 Election Cycle Updated June 27, 2017 Individual Candidate Alabama Ala. Code 17-5-1 et seq. Unlimited Unlimited Unlimited Unlimited Unlimited Alaska 15.13.070, 15.13.072(e),