FUNDING PATTERN OF SPONSORED RESEARCH BY SCIENTIFIC AGENCIES
|
|
|
- Corey Allison
- 6 years ago
- Views:
Transcription
 NEW DELHI 110 016 MAY.")
1 FUNDING PATTERN OF SPONSORED RESEARCH BY SCIENTIFIC AGENCIES MINISTRY OF SCIENCE & TECHNOLOGY DEPARTMENT OF SCIENCE & TECHNOLOGY NATIONAL SCIENCE TECHNOLOGY MANAGEMENT INFORMATION SYSTEM (NSTMIS) NEW DELHI MAY. 2014
2
3 ISBN
4 PREFACE Extramural Research and Development (R&D) projects support by the Central Government agencies is aimed at promoting, catalyzing and advancing R&D and innovation in the country by providing special encouragement to research scientists. The present report is fifth in the series of five-yearly reports brought out by the National Science & Technology Management Information System (NSTMIS) Division of the Department of Science & Technology (DST). It provides an analysis of 20,497 projects approved for funding by 23 Central Government Departments/ Agencies spread across 2,634 performing S&T institutions and 117 individual entrepreneurs aggregating to a value of Rs crores during the period The report also contains a state-wise list of institutions funded during the period, institute-wise number of projects and approved cost and addresses and website addresses of funding agencies. NSTMIS is inter-alia responsible for collecting, compiling, analyzing and disseminating information on Extramural (sponsored) Research and Development (R&D) projects funded by various agencies in the country. As a part of this effort the NSTMIS maintains an extended database of extramural R&D approved by the central S&T departments/agencies. The database contains information on projects approved by these agencies from onwards. Based on this database, annual directories of the projects approved for funding by various agencies are being brought out every year. The NSTMIS also supports research projects on key science policy issues including S&T human resource development. It is hoped that this report on sponsored research, as the earlier reports, would be useful for scientists, funding agencies, planners and policy makers. The NSTMIS welcomes comments/ suggestions on the report. The DST is grateful to all the central government departments/ agencies including members of the Programme Advisory Committee for their significant contribution in making this report highly resourceful. (Dr. Parveen Arora) Advisor & Head NSTMIS Division, DST New Delhi May, 2014
5 I N D E X Chapters Page No. -- Introduction 1 -- Scope & Coverage Overall Findings at a Glance & Comparison with Earlier Periods Executive Summary Funding by Major Scientific Departments / Agencies Funding by Subject Areas Funding by Types of Institutions Region wise Distribution of Sponsored LIST OF TABLES Tables Page No. 1.1 Period wise Extramural R&D Support Department / Agency wise Support to Extramural Research Year wise Extramural R&D Support during the Period Percentage Increase/Decrease in Funding Support in over Funding by Type of Agencies during Cost Pattern of during and Agency wise Number of of Cost > Rs. 1 crore during Number of Institutions Supported during Outreach of R&D Support to PIs during Period Subject Area wise R&D Support Since Subject Area wise Change in Percentage Share in R&D in over Subject Area wise Average Project Cost Subject Area wise Range of Cost of EMR Agency wise Two Most Preferred Subject Areas by Percentage of 37 during Extramural R&D Support by Types of Institutions during Number of funded Institution wise during Period wise Change in Institutional Outreach R&D Support to Top Ten Institutes of National Importance during Funding Agency wise Distribution of among Academic 46 Sector Institutions during Funding Agency wise Distribution of for Various Sectors other than Academic Sector during Top Ten Institutions by Number of Agency wise Dispersal of and Funding among Institutions Distribution of R&D Funding by Type of Cities during Distribution of EMR by Cities having 50 or More Region wise Distribution of EMR during (of cities 54 having 50 or more projects) 4.3 Distribution of Number of EMR and Funding by States/UTs during , , and Ranking of State/UTs by R&D Funding during State wise Number of Universities Receiving R&D Support during State wise List of Institutions and Funded During
6 LIST OF CHARTS Figures Page No. 1.1 A Period wise Number of B Period wise Cost Department / Agency wise Support to Extramural Research 22 during the period A Year wise Extramural EMR B Year wise Extramural R&D Cost Percentage Increase in funding support in over A Percentage Distribution of during (Nos.) B Percentage Distribution of Funds during (Rs. 26 Crores) 1.6 Cost Pattern of during and Year wise Cost Pattern of during Agency wise Number of of Cost Rs. 1 crore and above 29 during Subject Area wise Number of EMR during Subject Area wise Distribution of Extramural R&D Funding Support 34 during Subject Area wise Average Project Cost during Subject Area wise Range of Cost of EMR Institution wise Number of Funded during Institution wise Cost during A Average per Institution during (Nos.) B Average R&D Funding per institution during Period wise Change in Institutional Outreach R&D Support to Top Ten INIs during Distribution of among Academic Sector Institutions Distribution of among Other Sector Institutions Region wise Distribution of Cities having 50 or More Ranking of Top Five States by Percentage of Funding State wise Number of Universities receiving R&D Support during State wise Number of for Universities Receiving R&D 59 Support during State wise Funding of Universities during LIST OF ANNEXURES Annexures Page No. I State wise List of Institutions Supported II Institute wise Number of Supported III R&D Support to Institutes of National Importance 155 IV R&D Support to National Laboratories V R&D Support for State Government Institutions / S&T Councils VI R&D Support to SIROs 163 VII R&D Support to Corporate Sector VIII R&D Support to Voluntary Sector IX Funding Agency-wise Top Ten Most Preferred Institutions X City wise Distribution of having 50 or More
7 List of Abbreviations AICTE AYUSH CIL CS CSIR DAE DBT DOC DOD DRDO DSIR DST EMR ICMR INI ISRO MNRE MOCIT MOEF MOES MOP MOS MOSJE MOWR NL NO PCRA PROJ UGC VS All India Council for Technical Education Department of Ayurveda, Yoga, Unani, Siddha & Homeopathy Coal India Limited Corporate Sector Council of Scientific and Industrial Research Department of Atomic Energy Department of Bio-Technology Department of Coal Department of Ocean Development Defence Research and Development Organisation Department of Scientific and Industrial Research* Department of Science and Technology Extramural Research Indian Council of Medical Research Institutes of National Importance Indian Space Research Organisation Ministry of New & Renewable Energy Ministry of Communications & IT Ministry of Environment and Forests Ministry of Earth Sciences Ministry of Power Ministry of Steel Ministry of Social Justice and Empowerment Ministry of Water Resources National Laboratories Number Petroleum Conservation Research Association University Grants Commission Voluntary Sector
8
9 1 Introduction In India, the Central Government is the main agency of scientific and industrial research contributing about 71% of the total investment towards national Research and Development (R&D) activities. All the major scientific agencies of Central Government support R&D work in the form of extramural or sponsored EMR to individual scientists / institutions to carry out specific time-bound research projects in the areas of their interest. The purpose of this extramural R&D funding is to build substantial research capability and infrastructure in the country. In the central sector, scientific research is carried out mainly under number of government departments and autonomous agencies, which are specifically engaged with various R&D activities. In the category of R&D organizations, there are two types of departments/ agencies: I. R&D performing bodies such as Department of Atomic Energy (DAE), Department of Space (DOS), Council of Scientific and Industrial Research (CSIR), Indian Council of Agricultural Research (ICAR) among others. II. R&D sponsoring bodies such as the Department of Science and Technology (DST), Department of Biotechnology (DBT), Ministry of Earth Sciences (MOES, formerly Department of Ocean Development) among others. R&D performing bodies also support extramural research; but it is the R&D sponsoring bodies, which play major role in the promotion of scientific research through time-bound EMR. With the co-operation of all the R&D funding departments/ agencies, the National Science Technology Management Information System (NSTMIS) Division of the Department of Science and Technology (DST) has been compiling information annually on extramural EMR approved by major central funding agencies. This information is maintained as a computerized database from onwards. Starting from onwards, NSTMIS has been annually publishing a directory of extramural EMR approved by the central S&T agencies during the year. So far, 21 directories giving details of the approved EMR have been brought out. Based on this information, NSTMIS has already published four reports on the funding pattern of sponsored research by scientific agencies for the various periods viz , , and In continuation of the above efforts of NSTMIS, the present report, fifth in the series, provides an analysis of the funding pattern of sponsored research during the period ( ). The analysis is based on the inputs received from various central government departments/agencies.
10 2 Departments/ Agencies Covered Scope & Coverage The analysis is based on the data on the extramural R&D funding spent by 23 Central Government Departments/Agencies: All India Council for Technical Education (AICTE) Council of Scientific and Industrial Research (CSIR) Coal India Limited (CIL) Defence Research and Development Organization (DRDO) Department of Atomic Energy (DAE) Department of Ayurveda, Yoga, Unani, Siddha and Homeopathy (AYUSH) Department of Bio-Technology (DBT) Department of Coal (DOC) Ministry of Earth Sciences (MOES) (formerly Department of Ocean Development DOD) Department of Science and Technology (DST) Department of Scientific and Industrial Research (DSIR) Indian Council of Medical Research (ICMR) Indian Space Research Organisation (ISRO) Ministry of Communications and Information Technology (MOCIT) Ministry of Environment and Forests (MOEN) Ministry of Food Processing Industries (MOFPI) Ministry of New and Renewable Energy (MNRE) (formerly Ministry of Non- Conventional Energy Sources) Ministry of Power (MOP) Ministry of Social Justice and Empowerment (MOSJE) Ministry of Steel (MOS) Ministry of Water Resources (MOWR) Petroleum Conservation Research Association (PCRA) University Grants Commission (UGC) Subject Areas EMR are classfisied into the following eight major subject areas:- Agricultural Sciences Biological Sciences Chemical Sciences Earth Sciences Engineering and Technology Mathematics Medical Sciences Physical Sciences This Classification is based on the subject areas indicated by the agencies and also on the title of the projects. Some of the funded projects are multi-disciplinary in nature but have been classified in one of the above areas depending on their major thematic emphasis.
11 3 Classification by Type of Institutions Various institutions who received funding during the period have been classified into 11 categories as given below. Note: - It may be noted that in contrast with earlier reports of and , in this report like , the classification has been extended by including six separate categories viz science colleges, engineering colleges, medical/pharmacy colleges/hospitals, state government departments/state S&T councils, corporate sector (public and private) companies and their research organisations and voluntary organisations. In the period under review ( ), data analyzed also includes details of 117 nos. of individual entrepreneurs funded by DSIR during the period (65 Nos. Rs. Crores 4.47) and (52 Nos. --Rs. Crores 3.37). Sl. Nos. Type of Institutions 1. Universities 2. Deemed Universities 3. Science Colleges 4. Engineering & Technological Colleges (including Management Colleges) 5. Medical/Pharmacy Colleges/Hospitals 6. Institutes of National Importance like:- - Indian Institutes of Technologies and National Institutes of Technologies - All India Institute of Medical Sciences - P.G. Institute of Medical Education & Research 7. National Research Laboratories like:- - Laboratories under CSIR, ICAR, ICMR, DRDO and autonomous institutions under Central Government Ministries/Departments 8. Scientific and Industrial Research Organisations (SIROs) recognised by the Department of Scientific and Industrial Research 9. State Government Departments/State S&T Councils 10. Corporate Sector (Public and Private) 11. Voluntary Sector NGOs, Registered Societies The institutions under (1), (2), (3), (4), (5) and (6) together form the academic sector. Data Limitations The project cost referred to in this document is the total initially approved cost of the project applicable for the initially approved duration of the project. In line with the analysis carried out for , CSIR institute laboratories have been shown under National Labs. and not as Academic Institutes in the analysis for also.
12 4 Salient Findings at a Glance ( ) EMR (Nos.) * (637 Cities) 2634 Institutes Individual Entrepreneurs 2. R&D Funding (Rs. Crores) Average Cost of R&D Project (Rs. Lakhs) Number of High Cost (Rs. 25 Lakhs and Above) Number of Ultra High Cost (Rs. 1 Crore and Above) Number of PIs Reached Out Gender Representation Among PIs (Females) 23% 16% Coverage of Institutions 1773 (408 Cities) 1491 (426 Cities) 1095 Funding Agency Main Sponsors of R&D by Numbers of DST UGC DBT ICMR CSIR Percentage Share of Main Sponsors of R&D by Funding Support (Rs. Crores) DST DBT MOCIT ICMR UGC Percentage Share of R&D Funding Subject Areas 11. Subject Area-wise Distribution of Funding Support (%age) Biological Sciences Engineering & Technology Medical Sciences Chemical Sciences Percentage Share of EMR Funding
13 5 Type of Institution R&D Support Coverage by Types of Institution (Nos.) Universites Science Colleges Engineering, Technology and Management Colleges 682* Includes all types of colleges 443* Includes all types of colleges Voluntary Sector National Laboratories Medical Colleges and Hospitals Individual Entreprenures Corporate Sector Deemed Universities State Government Departments/ S&T Councils * Includes Corporate Sector also 261* Includes Corporate Sector also Institute of National Importance SIROs Share of Academic Sector (%) (Nos.) R&D Funding (Rs. Crores) Share of National Laboratories (%) (Nos.) R&D Funding (Rs. Crores) Funding Agency 15. Main R&D Patrons for Academic Sector UGC -- DST -- DBT CSIR -- ICMR AICTE -- Percentage Share of for Academic Sector (including ICAR) 16. Main R&D Patrons for Institutes of National Importance (Nos.) DST DBT Funding Agency CSIR ICMR DRDO Percentage Share of for Institutes of National Importance
14 6 Funding Agency Main R&D Patrons for National Laboratories (Nos.) DST DBT ICMR CSIR Percentage Share of for National Laboratories (including ICAR) Institution 18. Most Preferred Top Ten Institutions of All The Funding Agencies IISc Bangalore -- IIT Kharagpur -- AIIMS (Delhi) BHU -- IIT Madras -- IIT Delhi -- IIT Kanpur -- IIT Bombay -- Delhi University Jadavpur University Dispersal of Among Institutions Very good, 42% of 2751 institutions accounted for 50% of projects. Very good, 41% of 2751 institutions accounted for 50% of toal R&D funding. Extremely narrow; only 4% of 1773 institutions accounted for 50% of projects. Extremely narrow; only 5% of 1491 institutions accounted for 50% of projects 20. Dispersal of R&D Funding Among Institutions Extremely narrow; only 2% of 1491 Extremely narrow; only 3% of institutions the institutions accounted for accounted for 50% 50% of total R&D funding. of total R&D funding. States Main Beneficiary States by (Nos.) Andhra Pradesh Delhi Karnataka Maharashtra Tamil Nadu Uttar Pradesh West Bengal Percentage Share of Main Beneficiary States by R&D Funding (Rs. Crores) Andhra Pradesh Delhi Karnataka Maharashtra Tamil Nadu -- --
15 7 States Uttar Pradesh West Bengal Percentage Share of R&D Funding (including Bihar) 23. Share of North-Eastern States in Sponsored NE States 6.6% 3.70% 3.90% 2.10% 24. Dispersal of Among States Extremely narrow; Extremely narrow; Extremely narrow; only Extremely narrow; only 16% only 13% of the only 17% of the 16% of the states of the states accounted for states accounted states accounted accounted for 50% of 50% of the projects. for 50% of the for 50% of the the projects. projects. projects. 25. Number of Cities Getting 50 or More (Nos.) Note: - Applicable
16 8 Executive Summary National Science & Technology Management Information Systems (NSTMIS), Department of Science & Technology, Govt. of India, is inter-alia responsible for collecting, compiling, analyzing and disseminating information on Extramural (Sponsored) Research & Development (R&D) projects funded by various agencies in the country. As a part of this effort, NSTMIS maintains an extended data base of Extramural (EMR) approved by the central S&T departments / agencies. The data base contains information on projects approved by these agencies from onwards. Based on this data base, annual directories of the projects approved for funding by various agencies are being brought out every year. In addition, five year analyses are also undertaken by NSTMIS. Analysis of the five year data has been carried out in the following broad areas:- Funding by Scientific Agencies Funding by Subject Areas Funding by Types of Institutions Region wise Distribution of The present analysis of five years is for the period Following is the executive summary of the analysis:- 1. OVERVIEW A total of EMR costing Rs crores, covering a total of 2751 institutions (2634 institutions individual entrepreneurs), were approved by 23 central government departments/agencies during the period During this period, the number of projects sponsored in a year varied from 4828 in to 3569 in The total approved cost varied per year from Rs crores to Rs crores. This shows an increasing trend in both the number of projects and approved cost (Table 1.2 & Table 1.3 & Fig. 1.1A & Fig 1.2). On an overall basis, for all the funding agencies taken together, the quantum of funding in Rs. Crores increased by 201% in the period as comparied with (Table 1.4 & Fig. 1.4) R&D support reached out to scientists as principal investigators (PIs) spread over a total of 2634 institutions plus 117 individual entrepuners ( 2751) located in 32 states in 637 cities / towns in the country (Table 1.9, Table 4.1 & Table 4.5). Various institutions funded were from 288 universities, 890 science colleges, 360 engineering / technology and management colleges, 255 medical and pharmacy colleges/hospitals, 65 deemed universities, 40 institutes of national importance, 266 national laboratories, 67 state government departments/state S&T councils, 20 Scientific and Industrial Research Organizations (SIRO), 106 corporate sector companies/research institutions and 277 voluntary organizations (Table 3.1)
17 9 The average cost of EMR project during was Rs lakhs, while during the period it was Rs lakhs. Thus, the average cost of a project in increased by about 76% as compared with (Table 2.3). 2. FUNDING BY SCIENTIFIC AGENCIES (a) Number of (Table 1.2) Maximum number of projects 6676 (32.6%) were approved by Department of Science & Technology (DST), followed by 4781 (23.3%) University Grants Commission (UGC), 2349 (11.5%) Department of Bio-Technology (DBT), 1527 (7.5%) Indian Council of Medical Research (ICMR) and 1380 (6.7%) Council of Scientific and Industrial Research (CSIR). These Five agencies accounted for about 81.5% of the total sponsored projects during the period On an average, every year 1335 new projects were approved by DST, 956 by UGC, 470 by DBT, 305 by ICMR and 276 projects by CSIR. On overall basis per year 4100 new projects were approved and value wise Rs. Crores (b) R&D Funding (Table 1.2) Extramural R&D funding support by the Department of Science & Technology was the highest with Rs crores (40.8%), followed by the Department of Biotechnology Rs crores (20.2%), Ministry of Communication & Information Technology Rs crores (10.2%), Indian Council of Medical Research Rs crores (6.2%) and University Grants Commission (UGC) Rs. Crores (3.8%). These five agencies accounted for about 81.8% of the total funding. (c) Increase in Funding in over (Table 1.4 & Fig. 1.4) As compared to the period (in which the number of approved projects were with total cost of Rs. Crores ), there was an increase of 63.7% in the number of projects and phenomenal increase of 188% in total approved funding support during For the period , MNRE witnessed phenomenal increase of 537% over the funding of Rs. Crores in the period The increase for other agencies varies from 11% to 335%, overall increase for all the agencies taken together 201%. However, DOD and MOSJE witnessed downward trend of 94.7% and 80.7% respectively (d) Funding by Type of Agencies (Table 1.5 & Fig. 1.5A & 1.5B) Maximum number of projects (49.8%) were approved by Departments, followed by 8334 (40.7%) by Councils / Commissions. Funding wise maximum Rs. Crores (66%) amount was approved by Departments, followed by Rs. Crores (15.6%) by Ministries. Other special agencies namely CIL, DRDO, ISRO, IMD, PCRA and SAIL approved 1182 (5.8%) number of projects totaling to Rs. Crores (5.2%)
18 10 (e) Cost Pattern of (Table 1.6 & Fig. 1.6 & Fig ) 606 (3%) projects were in the cost range of above Rs. 100 lakhs. Maximum number of EMR 4825 (23.5%) were in the cost range of 5-10 lakhs, followed by 3637 (17.7%) in the cost range of lakhs (41.3%) projects were in the cost range of above Rs. 15 lakhs and 3567 (17.4%) were in the range less than 5 lakhs. The period under review, witnessed substantial increase in Ultra High Cost (Rs. 25 lakhs & above) over from 1428 to 4158 i.e. 189% increase (f) Agency-wise Distribution of Ultra High-Cost (above Rs. 1 crore) (Table 1.7 & Fig. 1.7) Out of total of projects, in , 606 (3%) projects of individual cost of Rs. 1 crore and above were funded by 14 agencies against 220 (1.8%) from total projects in Out of total of 606 projects of cost above Rs. 1 Crores, maximum 259 (42.7%) ultra high cost projects were funded by DST, followed by 120 (19.8%) by MOCIT, 109 (18%) by DBT. DST, MOCIT and DBT together funded 488 (80.5%) projects. This indicates that these 3 Agencies give special emphasis on R&D. (g) Coverage of Institutions (Table 1.8) During the period , 23 scientific agencies funded projects for 2751 institutes (This includes 117 individual entrepreneurs funded by DSIR in & 52 in ). Individually funding agency wise, 2136 institutions were supported by DST, followed by 1927 UGC, 1007 DBT, 699 ICMR, 597 CSIR, 546 AICTE, 468 DRDO etc, the coverage of institutions was very low (less than 50 institutions) in the case of MOP, MOES, DOC, DAYUSH, DOD, MOSJE, MOS and CIL (h) Outreach of R&D Support to PIs (Table 1.9) A total of principal investigators (PI's) were involved in sponsored EMR. Funding agencies wise, the outreach to the PIs was the highest in the case of DST 5379 (32%), followed by UGC 4159 (25%), DBT 1797 (11%), ICMR 1254 (8%). (i) Gender Representation among PIs (Table 1.9) The gender representation female / male among the PI's during the period under review ( ) was 23%, as compared to 16% during It is noted that participation of female PI's in the period increased by 44%.
19 11 3. FUNDING BY SUBJECT AREAS (a) Subject Area-wise Number of and R&D Funding (Table 2.1 & Fig. 2.1, & Fig ) Maximum 4994 (24.4%) projects were approved in the subject area of biological sciences, followed by 4051 (19.8%) in engineering and technology. These two subject areas together contributed for 9045 (44%) projects out of total of projects. In case of Biological Sciences, Mathematics and Medical Sciences, the %age of projects in showed marginal increase varying from 0.7% to 7%. However, in case of other subject area, there was decrease in %age of projects in over varying from 0.4% to 4.8%. Maximum Rs. Crores (30.6%) total approved cost was in the subject area of engineering & technology, followed by medical sciences Rs. Crores (23.6%). These two subject areas together contributed for Rs. Crores (54%) out of total approved cost of Rs. Crores As regards number of projects, in , as compared with , number of projects in engineering & technology registered a growth from 2776 to 4051 (46%) and 2158 to 4994 (131%) in biological sciences. Similarly, cost wise engineering & technology registered a growth from Rs. crores to (202%) and from Rs. crores to (351%) in biological sciences. The extramural R&D support like , was least both number wise and cost wise in the subject area of mathematics. (b) Subject Area-wise Percentage Share in R&D Support from to (Table 2.2) In , biological sciences registered maximum positive 7% change over , followed by 5% in medical sciences, while chemical sciences registered maximum decline 6%, followed by 5% in agricultural sciences. However in absolute terms in approved cost in Rs. crores, maximum change in over was registered in case of biological sciences (351%), followed by (269%) in medical sciences, engineering & technology (202%), mathematics (201%), physical sciences (164%) and least (42%) in agricultural sciences (c) Subject area-wise Average Project Cost (Table 2.3 & Fig. 2.2) The average per project cost of engineering & technology project was the highest (Rs lakhs), followed by medical sciences (Rs lakhs), agricultural sciences (Rs lakhs). The average cost of a project in the area of mathematics was the least (Rs.8.36 lakhs). (d) Cost Range of (Table 2.4 & Fig. 2.3) On overall basis, maximum projects 4825 (24%) are within the cost range of Rs. Lakhs Subject area wise medical sciences accounted for 1115 (27%) out of 4158 very high cost projects (Rs. 25 lakhs and above), followed by 924 (22%) in biological sciences. As regards low cost projects i.e. less than Rs. 1 Lakhs, maximum 420 (33%)
20 12 out of 1290 projects are in biological sciences, followed by 316 (25%) in chemical sciences. (e) Most Preferred Subject Areas (Table 2.5) With reference to number of projects, out of 23 funding agencies, maximum 14 (61%) have reported engineering & technology as the first preferred subject area and 6 (26%) biological sciences. 4 (17%) have reported chemical sciences as the second best preferred area. 4. FUNDING BY TYPES OF INSTITUTIONS (a) Academic Sector (Tables 3.1 & & Fig. 3.1, 3.1.1) In terms of number of projects, the outreach of the R&D support was the highest in the case of the academic sector (universities/colleges, deemed universities, science, engineering and medical colleges and the institutes of national importance) accounting for (79%) or more than three-fourth of the total projects, approximately 3.5% more as compared with the pervious period This sector got Rs. Crores (60%) of the total funding, witnessing percentage-wise an increase of about 2% over the period In the academic sector, maximum projects 7030 (34%) were funded from universities totaling to a value of Rs. crores (21%), followed by 5183 (25%) colleges totaling to a value of Rs. Crores (13%). Similarly, maximum total approved cost of Rs. crores (26%) was in National Laboratories totaling to 266 institutions (10%) and total projects 3074 (15%), followed by Rs. crores (21%) in 288 (10%) universities totaling to 7030 (34%) projects. 288 (10.46%) universities were granted 7030 (34%) projects of total value of Rs. crores (21%), while 65 (2%) deemed universities were granted 911 (4%) projects with an aggregate value of Rs. Crores (5%). 890 (32%) science colleges were granted 2873 (14%) projects of value of Rs. crores (5%), 362 (13%) engineering & management colleges in the country received funding support of Rs. crores (3%) for 1388 (7%) projects (9%) medical colleges and hospitals received support for 970 (5%) projects of value of Rs. Crores (4%). 41 (1.5%) institutes of national importance received Rs. Crores (20%) as total R&D funding for 2966 (14%) projects, witnessing an overwhelming increase of as high as 304% over the funding of Rs crores in Among these institutions, IIT (B) gained the largest grant of Rs. Crores (15%), followed by IIT (M) Rs. Crores (14%), IIT (K) Rs. Crores (14%), IIT (KH) Rs. Crores (12%) and IIT (D) Rs. Crores (11%). These top five institutes out of top ten institutes contributed Rs. Crores (73%). (b) National Laboratories (Table 3.1) 266 (10%) national laboratories including the central government institutions of the scientific agencies/ministries received support for 3074 (15%) projects valued at Rs
21 13 crores (26%). As compared with , this group of institutions witnessed decrease of about 15% in number of institutions receiving support; but number of projects increased by 24% and funding support by 114%. (c) State Government Departments/S&T Councils (Table 3.1) Under this group, 67 (2%) institutions were approved 203 (1%) projects of total value of Rs. Crores (1%). As compared with , this group of institutions witnessed increase of 22% in number of institutions receiving support, number of projects by 24% and funding support by 111%. (d) Scientific and Industrial Research Organizations (SIROs) (Table 3.1) During , 20 Scientific and Industrial Research Organizations (SIROs) received funding support of Rs. Crores (0.5%) for 74 (0.4%) projects. As compared with , this group of witnessed decrease of 57% in number of institutions receiving support, number of projects by 44% and funding support by 10%. (e) Corporate Sector (Table 3.1) 106 (4%) corporate sector enterprises received research grants of value of Rs. Crores (8%) for 141 (0.7%) projects. As compared with , this group witnessed increase of 14% in number of institutions receiving support, funding increased by 516%; but number of projects decreased by 5%. (f) Voluntary Sector (Table 3.1) 277 (10%) enterprise in the voluntary sector received funding support of Rs. Crores (5%) for 750 (4%) projects. As compared with , this group witnessed increase of 154% in number of institutions receiving support, number of project 331% and funding 987%. (g) Average Number of per Institution (Table 3.1) As compared to other groups of institutions, the institutes of national importance had the highest average number of projects per institution (72) during the five-year period ( ) under review, followed by 24 for universities, 17 for deemed universities, 12 national laboratories, engineering, management, medical hospitals and SIROs 4 each, science colleges, state government organizations and voluntary sector 3 each and 1 each for corporate sector & individual entrepreneurs. Considering all the institutions together, on an average, 7 projects were approved to an institution during the five-year period , same as during (h) Average Funding per Institution (Table 3.1) Like average project per institution, the average funding per institution for the five-year period under study was the highest in the case of institutes of national importance - Rs. Crores 29.30, which means each of these institutions, on an average, obtained a research grant of Rs. Crores 5.86 in a year, witnessing a marginal decrease of 14.95% over For other sectors, the average funding per institution varied from 1 crore to 6 crore and lowest in case of individual entrepreneurs (0.07 crore). On an
22 14 overall basis, taking all the sectors together, this value works to 2.30 crores. As against Rs Crores during (85% increased) (i) Change in Institutional Outreach from to (Table 3.2 & Fig. 3.3) As compared to , the period witnessed an increase of about 55% in the number of institutions receiving R&D support from 1773 to Maximum increase (344%) was for Institutes of National Importance, followed by (102%) in Others, (Constitute corporate sector, individual entrepreneurs, SIROs, state government departments / S&T councils, voluntary sector and hospitals). Only, National Laboratories witnessed decrease of 13%. The increase in case of universities was 85%, colleges (science, engineering and medical) 66% and deemed universities 44% (j) R&D Support to Top Ten INIs (Table 3.3 & Fig. 3.4) During , out of total R&D funding to INIs, maximum Rs. Crores (16%) was received by IIT - Bombay, followed by Rs. Crores (15%) IIT Madras. (Table 3.3 & Fig.3.4). The total funding for all the 40 INIs was Rs. Crores as per details in Annexure III (k) Agency-wise Distribution of among Institutions (Tables 3.4, & Fig. 3.5, 3.5.1) For the academic sector, UGC (4767), DST (4752), DBT (1360), CSIR (1157), ICMR (1047) and AICTE (970) were the main agencies funding the various projects, accounting for 87% of the total number of approved projects for this sector. With in this sector, universities got maximum funding for 7030 projects UGC (2384), DST (2203), DBT (681), CSIR (579) and others (1183), followed by 2877 Institutes of National Importance DST (1277), DBT (273), CSIR (345), ICMR (343) and others (639), accounting for together more than 70% of the total projects sponsored for the academic sector during as compared with 9433 in Other than academic sector, National Laboratories got maximum 3074 projects DST (1426), DBT (694), ICMR (346), CSIR (187) and others (421), accounting for 70% of projects awarded. Voluntary sector was awarded 750 projects DST (315), DBT (213), ICMR (83), CSIR (26) and others (113), accounting for 17% of projects awarded. (l) Top 10 Institutions (Table 3.5) Top 10 institutions were awarded 3355 (16%) projects amounting to Rs. crores (24%). Maximum 468 (2%) projects totaling to a value of Rs. crores (6%) were approved for Indian Institute of Science, Bangalore, followed by Indian Institute of Technology (Kh), 376 (2%) projects totaling to a value of Rs. crores (2%). IISc Bangalore and the five IITs together accounted for 19% of total R&D funding. (m) Dispersal of among Institutions (Table 3.6) The extent to which the agencies disperse projects among the institutions can be assessed by using the indicator called project dispersal ratio. This ratio for a particular funding agency is therefore defined as the ratio of the number of institutions accounting
23 15 for 50% of the projects to the total number of institutions getting support from that agency. Considering all the funding agencies together, for the period under review, , total number of unique institutions comes to 2751 and number of unique institutions accounting for 50% of projects comes to Therefore, the overall project dispersal ratio is 1153/2751=0.42. This means that 42% of the institutions accounted for 50% of the projects approved against 4% for the period The project dispersal ratio for the period has shown great improvement as compared with This ratio is lowest in case of Ministry of Earth Sciences (0.14) and highest in case of Ministry of Steel (1) but we can ignore this since they funded only one project and the next highest is Ministry of Social Justice and Empowerment (0.75). (n) Dispersal of Funding among Institutions (Ref, Table 3.6) Similarly, the dispersal of R&D funding among the institutions can be assessed by using the indicator called funding dispersal ratio. This ratio for a particular agency is therefore defined as the ratio of the number of institutions accounting for 50% of the funding to the total number of institutions getting support from that agency. As regards dispersal of funding, the overall ratio comes to 0.41 this means that 41% of the institutions accounted for 50% of the funding against 3% for the period The project dispersal ratio for funding for the period has shown great improvement as compared with This ratio is lowest in case of Ministry of Earth Sciences (0.07) and highest in case of Ministry of Steel ( 1) but we can ignore this since they funded only one project and the next highest is Ministry of Social Justice (0.75) and Empowerment and Ministry of Environment and Forests (0.75). 5. REGION-WISE DISTRIBUTION OF PROJECTS (a) City-wise Distribution (Table 4.1 & 4.2) During the period , the R&D funding was dispersed among the institutions located in 637 cities / towns against 408 in in the country. Among these locations, the institutions based in eight metropolitan cities received 56% of the total funding, those in 25 state capitals/uts 11% and the rest in other 604 cities and towns 31% of the total funding support. Among total of 637 locations in the country, 82 cities had 50 or more projects. These accounted for (82%) projects and Rs. Crore (90%) of total R&D funding during the period under review. Among these cities, maximum 30 (37%) cities were located in northern region, followed by 20 (24%) in southern region. Maximum funding Rs. Crores (14%) of total funding during ( ) was received by the institutions located in Delhi, followed by Rs. Crores (10%) by the institutions located in Bangalore. Similarly maximum 2286 (11%) of total number of projects approved during ( ) were from Delhi, followed by 1172 (6%) from Bangalore
24 16 (b) Comparison with the period (Table 4.3 & Fig 4.1) The dispersal of R&D funding for cities having 50 or more projects increased by 31 (61%) in as compared with , number of projects by 7214 (75%) and the approved funding by Rs. crores 3866 (209%) (c) State-wise Distribution (Table 4.4, 4.5 & Fig. 4.2) Maximum funding (14%) was received by institutes in Delhi, followed by (13%) in Maharashtra and least in (0.10%) in Mizoram. About 70% of the projects were approved for the institutions located in seven states viz. Andhra Pradesh, Delhi, Karnataka, Maharashtra, Tamil Nadu, Uttar Pradesh and West Bengal. The share of these states witnessed a marginal decrease of 0.67% in number of projects as compared with the period These seven states contributed 76% of the total funds approved and as compared with , 2% increase. Five states namely, Andaman & Nicobar, Arunachal Pradesh, Mizoram, Nagaland and Sikkim, each had less than 50 projects and in total contributed only 177 (0.86%) projects for a total funding of Rs. crores (0.67%) (d) Project Funding for North-Eastern Region (Table 4.4) During , the north-eastern region consisting of eight states (Arunachal Pradesh, Assam, Manipur, Meghalaya, Mizoram, Nagaland, Sikkim and Tripura) accounted for only 7% of the projects and 3% of the total funding of Rs. crores This period witnessed a slight increase in the percentage number of projects allocated to this region over that in (3%) and funding wise (0.7%). (e) State Funding Dispersal Ratio (Table 4.5) The extent to which the project funding was dispersed among the states/uts can be assessed by using the indicator, state funding dispersal ratio. This ratio is defined as ratio of the number of states/uts accounting for more than 50% of the projects to the total number of states/uts in the country. Five states Andhra Pradesh, Delhi, Karnataka, Maharashtra and Tamil Nadu accounted 60% of the total funding of Rs. crores Since the total number of states/uts is 32, the state funding dispersal ratio is 5/32 = This means the dispersal of project funding among the states during the period was extremely low and it is same as during the period (f) State-wise Number of Universities receiving R&D Support (Table 4.6 & Fig. 4.3, 4.4 & 4.4.1) Maximum 73 (25%) universities funded were situated in the state of Maharashtra, followed by 26 (9%) in Tamil Nadu.However maximum number of projects 1030 (15%) were approved form the state of Tamil Nadu, followed by 841 (12%) from Uttar Pradesh. Money wise maximum Rs. crores (17%) were approved for the state of Delhi, followed by Rs. crores (15%) for Tamil Nadu.
25 17 (g) State wise List of Institutions and Funded During For details, pls refer Table 4.6.
26 18 Chapter 1 Funding by Scientific Departments / Agencies Many departments / agencies of Government of India fund various EMR in the country annually. This chapter deals with analysis of R&D funding for the period on the following parameters:- Number of projects with total approved cost sanctioned during the period by various councils / commissions, departments, ministries and other specialist agencies of the central government and comparison with previous periods , and %age increase / decrease in funding support by central S&T departments / agencies in over Cost pattern of projects from Rs. Lakhs < 1 to > Rs. Lakhs 100 in various range Ranking of funding agencies according to number of projects and number of institutions supported Outreach of R&D support to scientists during the period Quantum of During the period under review ( ), maximum number of projects 6676 (32.6%) were approved by Department of Science & Technology (DST), followed by %) University Grants Commission (UGC), 2349 (11.5%) Department of Bio-Technology (DBT), 1527 (7.5%) Indian Council of Medical Research (ICMR) and 1380 (6.7%), Council of Scientific and Industrial Research (CSIR). These Five agencies accounted for about 82% of the total sponsored projects during the period As compared with the period , during the period , quantum of funding in terms of number of projects approved has gone-up 3 times (6791 to 20380) and 12 times (Rs. Crores to Rs. Crores ) (Table 1.1 & 1.2 & Fig. 1.1A, 1.1B & 1.2).

 Period wise Cost Rs. Crores Years")
27 19 Chapter 1 Table 1.1 Period wise Extramural R&D Support Sl. No. Number Rs. Crores. Number Rs. Crores. Number Rs. Crores. Number Rs. Crores Fig. 1.1 (A) Period wise Number of Numbers Years Fig. 1.1 (B) Period wise Cost Rs. Crores Years
28 Sl. No. Table 1.2 Department / Agency wise Support to Extramural Research during , , & Department / Agency Periods Number of Cost (Rs. In Crores) Number of Cost (Rs. In Crores) Number of Cost (Rs. In Crores) Number of Cost (Rs. In Crores) Councils / Commissions 1. All India Council for Technical Education Council of Scientific and Industrial Research Indian Council of Agricultural Research Indian Council of Medical Research University Grants Commission Departments 6. Department of Atomic Energy Department of Ayurveda, Yoga, Unani, Siddha and Homeopathy Department of Bio-Technology Department of Coal Department of Mines Department of Ocean Development* Department of Science and Technology Department of Scientific and Industrial Research# Department of Secondary and Higher Education*** Ministries 15. Ministry of Communications & IT Ministry of Earth Sciences Chapter 1 20
29 Sl. No. Department / Agency Continued- Period Number of Cost (Rs. In Crores) Number of Cost (Rs. In Crores) Number of Cost (Rs. In Crores) Number of Cost (Rs. In Crores) Ministries 17. Ministry of Environment and Forests Ministry of Food Processing Industries Ministry of Non-Conventional Energy Sources** Ministry of Power***** Ministry of Steel Ministry of Social Justice and Empowerment****** Ministry of Water Resources Ministry of Urban Affairs and Employment Other Specialist Agencies 25. Coal India Limited (CIL) Defence Research and Development Organisation Indian Space Research Organisation Indian Meteorological Department Petroleum Conservation Research Association Steel Authority of India Note:- *DOD has now been renamed as the Ministry of Earth Sciences (MOES), **MNES as the Ministry of New and Renewable Energy (MNRE)., ***For the period , information pertains to Department of Education., ****Formerly Ministry of Information Technology for , and Department of Electronics for , *****For and , information pertains to Central Board of Irrigation and Power., ****** For and , information pertains to Department of Welfare., # includes 117 Individual Entrepreneurs. Chapter 1 21
30 Department / Agency DS T UGC DBT IC MR CSIR AICTE DRDO DAE MOE N / MOE F MOC IT DS IR IS R O MOWR PCRA MNE S / MNR E MOP ME S DOC DAY US H DOD / MOE S MOS J E MOS CIL Figure 1.2 Department / Agency wise Support to Extramural Research during the period Number of Chapter 1 22
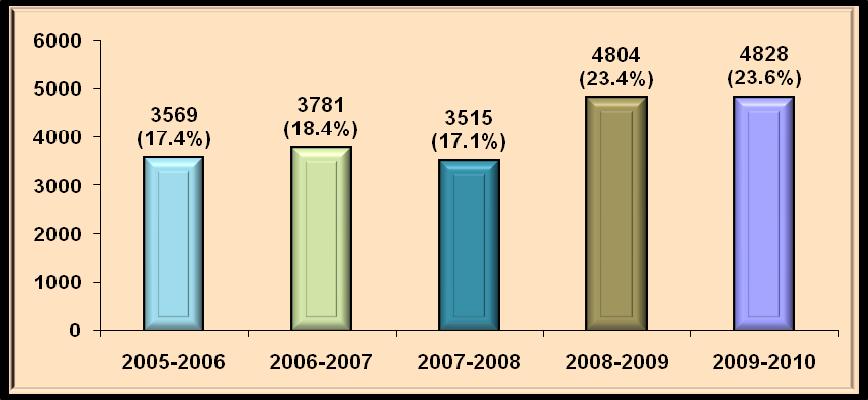
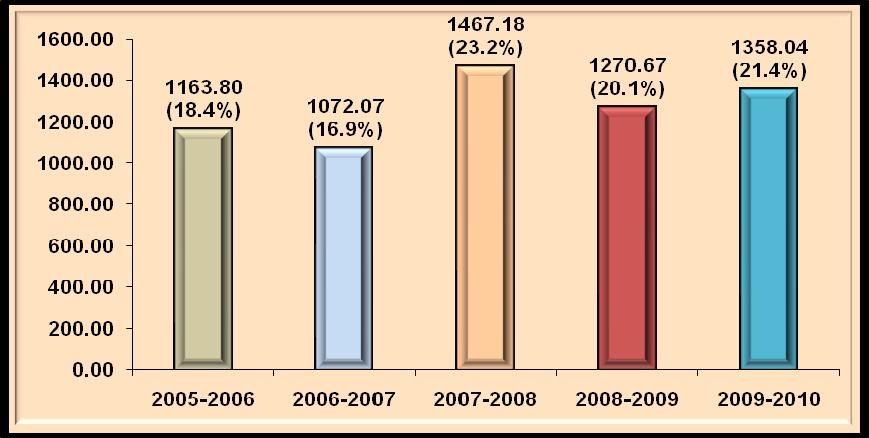
31 zzzzzzzzzzzzzzzzzzzzzzzzzzzzzzzzzzzzzzzzzzzzzzzzzzzzzzzzzzzzzzzzzzzzzzzzzzzzzzzzzzzzzzzzzzzzzzzzzzzzzzzzzzzzzzzzzzzzzzzzzzzzzzzzzzzzzzzzzzzzzzzzzzzzzzzzzzzzzzzzzzzzzzzzzzzzzzzzzzzzzzzzzzzzzzzzzzzzzzzzzzz 23 Chapter Year wise R&D Support During Year wise during the period , maximum number of projects 4828 (23.6%) were approved during the year , followed by 4804 (23.4%) during However project approved cost wise, maximum Rs. Crores (23.2%) were approved during the year , followed by Rs. Crores (21.4%) during (Table 1.3 & Fig. 1.3A & 1.3B) Sl. No. Table 1.3 Year wise Extramural R&D Support during the Period Years Cost Number %age Rs. Crores %age Figure 1.3 (A) Year wise Extramural EMR Nos. Years Figure 1.3 (B) Year wise Extramural R&D Support Rs. Crores Years
32 Chapter Percentage Increase in Funding in over For the period , MNRE witnessed phenomenal increase of 537% over the funding of Rs crores in the period The increase for other agencies varies from 11% to 335%, and the overall increase for all the agencies taken together workout to 201%. However, DOD and MOSJE witnessed downward trend of 95% and 81% respectively (Table 1.4 & Fig. 1.4) Table 1.4 Percentage Increase/Decrease in Funding Support by Central S&T Departments/ Agencies in over Sl. No. Department / Agency Funding (Rs. in Crores) Percentage Increase in over All India Council for Technical Education Council of Scientific and Industrial Research Defence Research and Development Organisation Department of Atomic Energy Department of Ayurveda, Yoga, Unani, Siddha and Homeopathy Department of Bio-Technology Department of Coal Department of Ocean Development Department of Science and Technology Department of Scientific and Industrial Research Indian Council of Medical Research Indian Space Research Organisation Ministry of Communications & IT Ministry of Environment and Forests Ministry of Non-Conventional Energy Sources Ministry of Power Ministry of Social Justice and Empowerment Ministry of Water Resources Petroleum Conservation Research Association University Grants Commission Note: - Only those departments / ministries / agencies have been taken in the above table which have funded in both the periods i.e and

33 25 Chapter 1 Fig. 1.4 Percentage Increase in Funding Support in over MNES / MNRE PCRA MOCIT DBT UGC DST ICMR DRDO DAYUSH MOWR CSIR ISRO DAE AICTE DOC MOEN / MOEF MOP DSIR Overall MOSJE DOD Percentage (%) Department / Agency 1.4 Funding by Type of Agencies Maximum number of projects (49%) were approved by Departments, followed by 8334 (40%) by Councils / Commissions. Funding wise maximum Rs. Crores (66 %) amount was approved by Departments, followed by Rs. Crores (15 %) by Ministries. Other special agencies namely CIL, DRDO, ISRO, IMD, PCRA and SAIL approved 1182 (6%) number of projects totaling to Rs. Crores (5%) (Table 1.5 & Fig. 1.5A & 1.5B) Table 1.5 Funding by Type of Agencies during Sl. No. Types of Funding Agencies Funding Number %age Rs. Crores %age 1. Councils / Commissions Departments Ministries Other Specialist Agencies
 were in the cost range of 5-10 lakhs, followed by 3637 (17%) in the cost range of 10-15 lakhs.")
 were in the range less than 5 lakhs. The period under review, witnessed substantial increase in Ultra High Cost (Rs.")
34 Chapter 1 26 Fig. 1.5 (A) Percentage Distribution of during (Nos.) Fig. 1.5 (B) Percentage Distribution of Funds during (Rs. Crores) 1.5 Cost Pattern of Maximum number of EMR 4825 (24%) were in the cost range of 5-10 lakhs, followed by 3637 (17%) in the cost range of lakhs. 606 (3%) projects were in the cost range of above Rs. 100 lakhs (41%) projects were in the cost range of above Rs. 15 lakhs and 3567 (17%) were in the range less than 5 lakhs. The period under review, witnessed substantial increase in Ultra High Cost (Rs. 25 lakhs & above) over from 1428 to 4158 i.e. 191% increase. (Table 1.6 & Fig. 1.6 & 1.6.1)


35 27 Chapter 1 Sl. No. Cost Range of Individual (Rs. Lakhs) Table 1.6 Cost Pattern of during and Number of (Fig ) (Fig. 2.5) Number %age Number %age 1. < > Fig. 1.6 Cost Pattern of during and Numbers Numbers
 Out of total of 20497 projects, in 2005-2010, 606 (3%) projects of individual cost of Rs.")
 ultra high cost projects were funded by DST, followed by 120 (20%) by MOCIT, 109 (18%) by DBT.")
36 Chapter 1 28 Fig Year wise Cost Pattern of during Agency wise Distribution of Ultra High Cost (Rs. 1 Crores and Above) Out of total of projects, in , 606 (3%) projects of individual cost of Rs. 1 crore and above were funded by 14 agencies against 220 (2%) from total projects in Maximum 259 (43%) ultra high cost projects were funded by DST, followed by 120 (20%) by MOCIT, 109 (18%) by DBT. DST, MOCIT and DBT together funded 488 (81%) projects. This indicates that these 3 Agencies give special emphasis on R&D. (Table 1.7 & Fig. 1.7)

37 29 Chapter 1 Table 1.7 Agency wise Number of of Cost above Rs. 1 Crore funded during ( Number of in & in ) Number of (Fig. 2.6) Sl. Department / No. Agency Nos. %age Nos. %age 1. CIL DAE DBT DOC DRDO DSIR DST ICMR ISRO MNRE / MNES MOCIT MOEN / MOEF MOES MOS Note: - Departments / Agencies namely ICAR (5), MFPI (1) and MOWR (1) not shown in the above table since they did not fund any project of individual value of Rs. 1 crore and above but during , Departments / Agencies namely CIL (1), ISRO (4) and MOS (4) funded, the total number of agencies providing funds remaining same at 14 during both the periods i.e and (-) No Project Sanctioned. Fig. 1.7 Agency wise Number of of Cost Rs. 1 Crore and Above during Department / Agency Number of
38 Chapter Number of Institutions Supported During the period , 23 scientific agencies funded projects for 2751institutes (This includes 117 individual entrepreneurs funded by DSIR in & 52 in ). Individually funding agency wise, 2136 institutions were supported by DST, followed by 1927 UGC, 1007 DBT, 699 ICMR, 597 CSIR, 546 AICTE, 468 DRDO etc, the coverage of institutions was very low (less than 50 institutions) in the case of MOP, MOES, DOC, DAYUSH, DOD, MOSJE, MOS and CIL. (Table 1.8) Sl. No. Table 1.8 Number of Institutions Supported during Funding Agency Number Institutions 1. Department of Science and Technology University Grants Commission Department of Bio-Technology Indian Council of Medical Research Council of Scientific and Industrial Research All India Council for Technical Education Defence Research and Development Organisation Department of Atomic Energy Ministry of Environment and Forests Ministry of Communications & IT Department of Scientific and Industrial Research* Indian Space Research Organisation Ministry of Water Resources Petroleum Conservation Research Association Ministry of New & Renewable Energy Ministry of Power Ministry of Earth Sciences Department of Coal Department of AYUSH Department of Ocean Development Ministry of Social Justice and Empowerment Ministry of Steel Coal India Limited 2 2 ** **Note: - For overall total of number of institutions supported, pls refer Table 3.1. For arriving at the overall total of number of institutions supported, each institute has been treated as a unique institute e.g. if a institute has been supported by more than one funding agency, the number of institutions supported is counted as one *Includes 117 individual entrepuners 1.8 Outreach of R&D Support to PIs and Gender Representation A total of principal investigators (PI's) were involved in sponsored R&D. Among the funding agencies, the outreach to the scientists was the highest in the case of DST 5379 (32%), followed by UGC 4159 (25%). The gender representation of females among the PI's during the period under review ( ) was 23%, as compared to 16% during
39 31 Chapter 1 Therefore, the participation of female PI's in the period has increased by 1.44 times. (Table 1.9). Table 1.9 Outreach of R&D Support to PIs and Gender Representation during the Period Sl. No. Funding Agency Number of Funded Number of PI s Male Female (Male + Female) %age (Female) Avg. PI s Per Year (Number) 1 Department of Science and Technology University Grants Commission Department of Bio-Technology Indian Council of Medical Research Council of Scientific and Industrial Research All India Council for Technical Education Defence Research and Development Organisation Department of Atomic Energy Ministry of Environment and Forests Ministry of Communications & IT Indian Space Research Organisation Department of Scientific and Industrial Research Ministry of Water Resources Petroleum Conservation Research Association Ministry of New & Renewable Energy Ministry of Power Department of Coal Department of AYUSH Ministry of Earth Sciences Department of Ocean Development Ministry of Steel Ministry of Social Justice and Empowerment Coal India Limited State-wise List of Institutions Supported During Overall list of state wise institutions supported by various funding agencies during the period under analysis ( ) enclosed as Annexure I 1.10 Institutions-wise Number of Supported During Overall list of number of projects institutions wise supported by various funding agencies during the period under analysis ( ) enclosed as Annexure II
40 32 Chapter 2 Funding by Subject Areas Many departments / agencies of Government of India fund EMR in various subject areas viz agriculture sciences, biological sciences, chemical sciences, earth sciences, engineering & technology, mathematics, medical sciences and physical sciences. This chapter therefore deals with analysis of R&D funding subject area wise for the period on the following parameters:- Subject area wise extramural R&D support since 1990 Subject area wise change in %age share in extramural R&D support in over Subject area wise average project cost Subject area wise range of approved cost from Rs. Lakhs < 1 to > Rs. Lakhs 100 Funding agency wise two most preferred subject areas by %age of total projects during the period Subject Area wise Number of and R&D Funding Maximum 4994 (24.4%) projects were approved in the subject area of biological sciences, followed by 4051 (19.8%) in engineering and technology. These two subject areas together contributed for 9045 (44.2%) projects out of total of projects. In case of Biological Sciences, Mathematics and Medical Sciences, the %age of projects in showed marginal increase varying from 0.7% to 7%. However, in case of other subject area, there was decrease in %age of projects in over varying from 0.4% to 4.8%. Maximum approved cost of Rs. Crores (30.6%) was in the subject area of engineering & technology, followed by medical sciences Rs. Crores (23.6%). These two subject areas together contributed for Rs. Crores (54.2%) out of total approved cost of Rs. Crores As regards number of projects, in , as compared with , number of projects in engineering & technology registered a growth from 2776 to 4051 (46%) and 2158 to 4994 (131%) in biological sciences. Similarly, cost wise engineering & technology registered a growth from Rs. crores to (202%) and from Rs. crores to (351%) in biological sciences. The extramural R&D support like , was least both number wise and cost wise in the subject area of mathematics. (Table 2.1 & Fig. 2.1 & 2.1.1)

41 33 Chapter 2 Sl. No. Subject Area Table 2.1 Subject Area wise R&D Support Since Cost Cost Nos. %age Rs. Crores %age Nos. %age Rs. Crores %age 1. Agricultural Sciences Biological Sciences Chemical Sciences Earth Sciences Engineering & Technology Mathematics Medical Sciences Physical Sciences Cost Cost Sl. No. Subject Area Rs. Rs. %age %age %age %age Nos. Crores Nos. Crores 1. Agricultural Sciences Biological Sciences Chemical Sciences Earth Sciences Engineering & Technology Mathematics Medical Sciences Physical Sciences Fig. 2.1 Subject Area wise Number of EMR during Number Subject Area

42 Chapter 2 34 Fig Subject Area wise Distribution of Extramural R&D Funding Support during Rs. Crores Subject Area 2.2 Subject Area wise Change in Percentage in R&D Support In , biological sciences registered maximum positive 7.1% change over , followed by 5.2% in medical sciences, while chemical sciences registered maximum decline 5.7%, followed by 5.3% in agricultural sciences. However in absolute terms in approved cost in Rs. crores, maximum change in over was registered in case of biological sciences (351%), followed by (269%) in medical sciences, engineering & technology (202%), mathematics (201%), physical sciences (164%) and least (42%) in agricultural sciences. (Table 2.1 & 2.2) Table 2.2 Subject Area wise Change in Percentage Share in Extramural R&D Support in over Sl. No. Subject Area Percentage of R&D Percentage Change in Support over Agricultural sciences Biological sciences Chemical sciences Earth sciences Engineering and technology Mathematics Medical sciences Physical sciences Subject Area wise Average Project Cost The average per project cost of engineering & technology project was the highest (Rs lakhs), followed by medical sciences (Rs lakhs), agricultural sciences (Rs lakhs). The average cost of a project in the area of mathematics was the least (Rs.8.37
 Cost (Rs. Lakhs) 1. Engineering and Technology 1937.71 4051 47.83 2. Medical sciences 1492.")
43 35 Chapter 2 lakhs). The average project cost on overall basis for all the subject areas taken together comes to Rs Lakhs. (Table 2.3 & Fig. 2.2) Table 2.3 Subject Area wise Average Project Cost Sl. No. Subject Area Number of Average Project Cost (Rs. Crores) Cost (Rs. Lakhs) 1. Engineering and Technology Medical sciences Agricultural sciences Biological sciences Physical sciences Earth Sciences Chemical sciences Mathematics Fig. 2.2 Subject Area wise Average Project Cost during Avg. Project Cost (Rs. Lakhs) Subject Area 2.4 Cost Range of On overall basis, maximum projects 4825 (23.5%) are within the cost range of Rs. Lakhs Subject area wise medical sciences accounted for 1115 (26.8%) out of 4158 very high cost projects (Rs. 25 lakhs and above), followed by 924 (22.2%) in biological sciences. As regards low cost projects i.e. less than Rs. 1 Lakhs, maximum 420 (32.6%) out of 1290 projects are in biological sciences, followed by 316 (24.5%) in chemical sciences. (Table 2.4 & Fig. 2.3) 2.5 Most Preferred Subject Areas With reference to number of projects, out of 23 funding agencies, maximum 14 (61%) agencies have reported engineering & technology as the first preferred subject area and 6 (26%) biological sciences. 4 (17%) agencies have reported chemical sciences as the second best preferred area. (Table 2.5)


44 Chapter 2 36 Table 2.4 Subject Area wise Range of Cost of EMR Sr. Number of by Cost Range (Rs. Lakhs) Subject Area No. < >25 1. Agricultural sciences Biological sciences Chemical sciences Earth sciences Engineering & Technology Mathematics Medical sciences Physical sciences Fig. 2.3 Subject Area wise Range of Cost of EMR Subject Area Number of Number of Subject Area
45 37 Chapter 2 Table 2.5 Agency wise Two Most Preferred Subject Areas by Percentage of during Sl. No. Funding Agency Number of Maximum Subject Areas Followed By 1. AICTE 980 Engineering & Technology 715(73%) Medical Sciences 209(21.3%) 2. CIL 2 Engineering & Technology 2(100) CSIR 1380 Chemical Sciences 451(32.7%) Biological Sciences 349(25.3%) 4. DRDO 921 Engineering & Technology 553(60%) Physical Sciences 122(13.3%) 5. DAE 573 Engineering & Technology 178(31.1%) Chemical Sciences 97(17%) 6. DAYUSH 32 Medical Sciences 29(91%) Biological Sciences 2(6.3%) 7. DBT 2349 Biological Sciences 1098(47%) Medical Sciences 623(26.6%) 8. DOC 38 Engineering & Technology 29(76.3%) Chemical Sciences 9(23.7%) 9. DOD 7 Biological Sciences 5(73%) Earth Sciences 2(28.6%) 10. DST 6676 Biological Sciences 1356(20.3%) Engineering & Technology 1326 (20%) 11. DSIR 171 Engineering & Technology 116(68%) Medical Sciences 21(12.3%) 12. ICMR 1527 Medical Sciences 1527(100%) ISRO 166 Engineering & Technology 70(42.2%) Physical Sciences 63(38%) 14. MOCIT 272 Engineering & Technology 206(75.7%) Biological Sciences 46(17%) 15. MOES 39 Biological Sciences 26(66.7%) Earth Sciences 10(25.6%) 16. MOEF 286 Biological Sciences 132(46.2%) 17. MNES /MNRE 73 Engineering & Technology 73(100%) MOP 55 Engineering & Technology 55(100%) MOSJE 5 Engineering & Technology 5(100%) MOS 4 Engineering & Technology 4(100%) MOWR 81 Engineering & Technology 81(100%) ---- Engineering & Technology 42(14.7%) 22. PCRA 79 Engineering & Technology 68(86.1%) Chemical Sciences 5(6.3%) 23. UGC 4781 Biological Sciences 1855(38.8%) Chemical Sciences 1036 (21.7%)
46 38 Chapter 3 Funding by Types of Institutions Many departments / agencies of Government of India fund EMR to various institutions depending upon their type viz corporate sector, deemed universities, engineering & technological and management colleges, individual entrepreneurs, institutes of national importance, medical / pharmaceutical colleges and hospitals, national laboratories, science colleges, SIROs, state government departments / S&T councils, universities and voluntary sector. This chapter therefore deals with analysis of R&D funding by type of institutions for the period on the following parameters:- Extramural R&D support during the period by type of Institution ( number of projects approved and approved cost) Period wise change in institutional outreach Growth in number of institutions funded type & period wise Average R&D funding per institution during Average projects funded per institution during Average funding to top ten institutes of national importance during the period Overall comparison of extramural R&D support by types of institutions during and Outreach of R&D support by various type of institutions:- Academic Sector National Laboratories State Government Departments / S&T Councils SIROs Corporate Sector Voluntary Sector Most preferred institutions of funding agencies (Annexure IX) Funding agency wise distribution of projects among institutions Top ten institutions by number of approved projects Agency wise dispersal of projects and funding among institutions
47 39 Chapter Extramural R&D Support by Type of Institutions during During the period under review, 2751 institutions were supported for R&D for a total value of Rs crores comprising of projects. Institutions wise, maximum institutions funded were science colleges 890 (32.4%) totaling to 2873 projects (14%) for a value of Rs. crores (5.3%). Maximum total approved cost of Rs. crores (25.7%) was in the area of National Laboratories totaling to 266 institutions (9.7%) and total projects 3074 (15%). Maximum average number of projects funded per institution was in Institutes of National Importance (INIs) with a average R&D funding per institution at Rs. crores 29.30, and maximum average R&D funding per project was in the Corporate Sector at Rs. Crores On a overall basis, the average R&D funding per institution works out to Rs. Crores 2.30 and average R&D funding per project Rs. Crores 0.31 (31 Lakh) (Table 3.1) Sl. No. Table 3.1 Extramural R&D Support by Types of Institutions during Type of Institutions Institutions Avg. Number %age Number %age / Institution (Number) 1. Corporate Sector Deemed Universities Engineering & Technological and Management Colleges 4 4. Individual Entrepreneurs Institutes of National Importance Medical//Pharmaceutical Colleges and Hospitals 4 7. National Laboratories Science Colleges SIROs State Government Departments / S&T Councils Universities Voluntary Sector Avg. R&D Avg. R&D Sl. Cost Funding / Funding / Type of Institutions No. (Rs. Institution Project %age Crores) (Rs. Crores) (Rs. Crores) 1. Corporate Sector Deemed Universities Engineering & Technological and Management Colleges Individual Entrepreneurs Institutes of National Importance Medical//Pharmaceutical Colleges and Hospitals National Laboratories Science Colleges SIROs State Government Departments / S&T Councils Universities Voluntary Sector
 all colleges (E&T, Mgt, Medi / Pharma and Sci) totaling to a value of Rs. Crores 737.16 (11.6%) (Table 3.1.1 & Fig.3.1.1) Cost wise, maximum total approved cost of Rs. crores 1624.55 (25.")
48 Chapter 3 40 wise, maximum projects 7030 (34.3%) were funded for universities totaling to a value of Rs. crores (21.5%), followed by 5104 (24.9%) all colleges (E&T, Mgt, Medi / Pharma and Sci) totaling to a value of Rs. Crores (11.6%) (Table & Fig.3.1.1) Cost wise, maximum total approved cost of Rs. crores (25.7%) was in National Laboratories totaling to 266 institutions (9.7%) and total projects 3074 (15%), followed by Rs. crores (21.5%) in 288 (10.57%) universities totaling to 7030 (34.3%) projects. (Tables 3.1 & & Fig.3.1 & 3.1.1) Table Number of funded and Cost Institution wise during Sl. Cost Type of Institutions No. Number %age Rs. Crores %age 1. Colleges (science, engineering and medical) Deemed Universities Institutes of National Importance National Laboratories Universities Others* Note:- *Others include corporate sector, individual entrepreneurs, SIROs, state government departments / S&T councils, voluntary sector and hospitals Fig. 3.1 Institution wise Number of Funded during
49 41 Chapter 3 Fig Institution wise Cost during (Rs. Crores) 3.2 Average R&D Funding per institution & Average per Institution during Maximum (29.30) average R&D funding per institution in Rs. Crores was in Institutes of National Importance (INIs), followed by Deemed Universities (7.74). Maximum (72) average projects per institution was also in Institutes of National Importance (INIs), followed by Universities (24) (Table 3.1 & Fig.3.2) Fig. 3.2 (A) Average per Institution during (Nos.) Number Institutions

50 Chapter 3 42 Fig. 3.2 (B) Average R&D Funding per Institution during Rs. Crore Institutions 3.3 Period wise Change in Institutional Outreach As compared to , witnessed on overall basis increase of 55% in the number of institutions receiving R&D funding, maximum increase (344%) was for Institutes of National Importance (INIs), followed by (102%) by Others. Only National Laboratories witnessed decrease (13%). (Table 3.2 & Fig.3.3) Sl. No Type of Institutions Colleges (science, engineering & medical) Deemed University (DU) Institute of National Importance (INIs) National Table 3.2 Period wise Change in Institutional Outreach Number of Institutions Funded Percentage change in over Percentage change in over Percentage change in over Laboratories 5. Others* Universities Note: - *Others include corporate sector, individual entrepreneurs, SIROs, state government departments / S&T councils, voluntary sector and hospitals
 was received by IIT - Bombay, followed by Rs. Crores 181.27 (15%) IIT - Madras. Top ten INIs taken together contributed 93.9% (Rs. Crores 1100.41) of total funding of 40 INIs. (Table 3.")
51 43 Chapter 3 Fig. 3.3 Period wise Change in Institutional Outreach Numbers 1479 Type of Institutions 3.4 R&D Support to Top Ten INIs During , maximum Rs. Crores (16%) was received by IIT - Bombay, followed by Rs. Crores (15%) IIT - Madras. Top ten INIs taken together contributed 93.9% (Rs. Crores ) of total funding of 40 INIs. (Table 3.3 & Fig.3.4) For details of all the identified 40 INIs, refer Annexure - III Table 3.3 R&D Support to Top Ten INIs during Funding for All 40 INIs Rs Crores Sl. R&D Funding Name of Institution %age No. (Rs. Crores) 1. Indian Institute of Technology (Bombay) Indian Institute of Technology (Madras) Indian Institute of Technology (Kanpur) Indian Institute of Technology (Kharghpur) Indian Institute of Technology (Delhi) All India Institute of Medical Sciences (Delhi) P.G.I of Medical Education & Research (Chandigarh) Indian Institute of Technology (Rourkela) Indian Institute of Technology (Guwahati) NIPER (Mohali)

52 Chapter 3 44 Fig. 3.4 R&D Support to Top Ten INIs during R&D Support Institutes 3.5 Outreach of R&D Support by Various type of Institutions Sector wise details are as follows: _ 1. Academic Sector Maximum (78.5%) projects were awarded to the academic sector, which comprises of universities, deemed universities, science, engineering, management, medical colleges and institute of national importance. They contributed more than 75% of total projects awarded during the period under review, nearly the same as it was during the period (75.3%). In terms of R&D funding this sector got Rs. crores (81%) during as compared to Rs. crores in i.e. and increase of 306% 288 Universities were granted 7030 (34.3%) projects for a total R&D funding of Rs. crores (21.5%). Similarly 65 deemed universities were granted 1079 (5%) projects with R&D funding of (8%) 890 Science colleges were granted 2873 (14%) projects for a total R&D funding of Rs. crores (5%). 362 engineering and management colleges were granted 1309 (6.4%) projects with R&D funding of (2.3%) 255 Medical colleges and hospitals were granted 970 (4.7%) projects for a total R&D funding of Rs. crores (4.3%). 40 Institutes of National Importance (INIs) were granted 2877 (14%) projects for a total R&D funding of Rs. crores (18.5%). This sector witnessed phenomenal increase over during which only 9 INIs were supported for 1678 projects totaling to a value of Rs. crores (Table 3.1 & & Fig. 3.1 & 3.1.1) 2. National Laboratories 266 National Laboratories were granted 3074 (15%) projects for a total R&D funding of Rs. crores (25.7%) against 306 laboratories totaling to 2471 projects for a value of Rs. Crores in Although number of institutes decreased from
53 45 Chapter to 266 but the number of projects went up from 2471 to 3074 and also value in Rs. crores from to i.e. an increase of 114.5% in terms of value in (Annexure IV) 3. State Government Departments / S&T councils In , 67 State Government Departments / S&T councils were granted 203 (1%) projects for a total R&D funding of Rs. crores (1%). against 55 State Government Departments / S&T councils granted 164 projects for a value of Rs. Crores in (Annexure V) 4. Scientific and Industrial Research Organisations (SIROs) In , 20 SIROs were granted 74 (0.36%) projects for a total R&D funding of Rs. crores (0.54%). against 47 SIROs granted 132 projects for a value of Rs. Crores in (Annexure VI) 5. Corporate Sector In , 106 Enterprises were granted 141 (0.7%) projects for a total R&D funding of Rs. crores (7.8%). against 93 enterprises granted 149 projects for a value of Rs. Crores in (Annexure VII) 6. Voluntary Sector In , 277 Enterprises were granted 750 (3.7%) projects for a total R&D funding of Rs. crores (5.1%). against 109 enterprises granted 174 projects for a value of Rs. Crores in (Annexure VIII) 7. Most Preferred Institutions of Funding Agencies The total approved cost of 10 most preferred institutions of 19 funding agencies taken together comes to Rs. Crores (39%) for 4343 (21%) number of projects. IISc Bangalore was among the most 10 preferred institutions of maximum number of 10 funding agencies, followed by 9 for IIT (Kh), 8 each for IIT (B) & IIT (D) and 7 for IIT (K). Overall 190 institutions in the country emerged as the 10 most preferred institutions of the funding agencies for the period against 230 during Annexure IX) Note: - Out of 23 funding agencies only 19 funding agencies had individually funded 10 or more than 10 projects during the period Agencies namely, DOD, MOS, MOSJE and CIL funded less than 10 projects during the period under review. 3.6 Funding Agency wise Distribution of (Nos.) For the academic sector, UGC (4767), DST (4752), DBT (1360), CSIR (1157), ICMR (1047) and AICTE (970) were the main agencies funding the various projects, accounting for 87.4% of the total number of approved projects for this sector. With in the academic sector, universities got maximum funding for 7030 projects UGC (2384), DST (2203), DBT (681), CSIR (579) and others (1762), followed by 2877 Institutes of National Importance DST (1277), DBT (273), CSIR (345), ICMR (343) and others (621), together universities and INIs account for more than 61% of the total projects funded for the academic sector.
54 Chapter 3 46 Other than academic sector, National Laboratories got maximum 3074 projects DST (1426), DBT (694), ICMR (346), CSIR (187) and others (421), accounting for 69.8% of projects awarded. Voluntary sector was awarded 750 projects DST (315), DBT (213), ICMR (83), CSIR (26) and others (113). (Table 3.4 & & Fig 3.5 & 3.5.1) Table 3.4 Funding Agency wise Distribution of among Academic Sector Institutions during Number Sl. Academic Sector Funding Agency No. Univ. DU SC E&T MGT MC INI 1. University Grants Commission Department of Science and Technology Department of Bio-Technology Council of Scientific and Industrial Research Indian Council of Medical Research All India Council for Technical Education Defence Research and Development Organisation Department of Atomic Energy Ministry of Environment and Forests Ministry of Communications & IT Indian Space Research Organisation Ministry of Water Resources Ministry of New & Renewable Energy Ministry of Earth Sciences Petroleum Conservation Research Association Ministry of Power Department of AYUSH Department of Scientific and Industrial Research Department of Coal Department of Ocean Development Coal India Limited Ministry of Social Justice and Empowerment Ministry of Steel Uni = University, DU = Deemed University, SC = Science College, E&T = Engineering & Technology College, MGT = Management College, MC = Medical College, INI = Institute of National Importance Table Funding Agency wise Distribution of for Various Sectors other than Academic Sector during (Number) Sl. Others Funding Agency NL VS ST CS SIROs No. IE Ho 1. Department of Science and Technology Department of Bio-Technology Indian Council of Medical Research Council of Scientific and Industrial Research Department of Scientific and Industrial Research

55 47 Chapter 3 Sl. No. Funding Agency NL VS ST CS SIROs Others IE Ho 6. Defence Research and Development Organisation Ministry of Communications & IT Department of Atomic Energy Ministry of Environment and Forests Petroleum Conservation Research Association Ministry of New & Renewable Energy Indian Space Research Organisation Ministry of Power Department of Coal Ministry of Water Resources University Grants Commission All India Council for Technical Education Department of AYUSH Ministry of Social Justice and Empowerment Ministry of Steel Ministry of Earth Sciences Coal India Limited Department of Ocean Development NL = National Laboratories, State = State Government Department / State S&T Council, CS = Corporate Sector, VS = Voluntary Sector, IE =Individual Entrepuner, Ho = Hospitals Fig. 3.5 Distribution of among Academic Sector Institutions (Number) ( Academic Institutions ) Number Academic Sector
 projects amounting to Rs. Crores 1544.94 (24.4%). Maximum 468 (2.")
56 Chapter 3 48 Fig Distribution of among Other Sector Institutions ( Other Institutions ) Number Other Sector Institutions 3.7 Top Ten Institutions by Number of Top 10 institutions numbers of projects wise were awarded a total of 3355 (16.4%) projects amounting to Rs. Crores (24.4%). Maximum 468 (2.3%) projects totaling to a value of Rs. Crores (5.6%) were approved for Indian Institute of Science, Bangalore, followed by Indian Institute of Technology (Kharghpur), 376 (1.8%) projects totaling to a value of crores (2.5%). IISc Bangalore and the five IITs together accounted for 18.9% of total R&D funding. (Table 3.5) Sl. No. Table 3.5 Top Ten Institutions by Number of Institutions Number of %age of Project Cost (Rs. Crores) %age of Cost 1. Indian Institute of Science (Bangalore) Indian Institute of Technology (Kharghpur) AIIMS (Delhi) Banaras Hindu University Indian Institute of Technology (Madras) Indian Institute of Technology (Delhi) Indian Institute of Technology (Kanpur) Indian Institute of Technology (Bombay) Delhi University (Delhi) Jadhavpur University (Kolkata) Agency wise Dispersal of and Funding among Institutions The extent to which the agencies disperse projects among the institutions can be assessed by using the indicator called project dispersal ratio. This ratio for a particular funding agency is therefore defined as the ratio of the number of institutions accounting for 50% of the projects to the total number of institutions getting support from that agency. Similarly, the dispersal of R&D funding among the institutions can be assessed by using the indicator called funding dispersal ratio. This ratio for a particular agency is therefore defined as the
57 49 Chapter 3 ratio of the number of institutions accounting for 50% of the funding to the total number of institutions getting support from that agency. Considering all the funding agencies together, for the period under review, , total number of unique institutions comes to 2751 and number of unique institutions accounting for 50% of projects comes to Therefore, the overall project dispersal ratio is 1153/2751=0.42. This means that 42% of the institutions accounted for 50% of the projects approved against 4% for the period The project dispersal ratio for the period has shown great improvement as compared with This ratio is lowest in case of Ministry of Earth Sciences (0.14) and highest in case of Ministry of Steel (1) but we can ignore this since they funded only one project and the next highest is Ministry of Social Justice and Empowerment (0.75). As regards dispersal of funding, the overall ratio comes to 0.41 (1137/2751) this means that 41% of the institutions accounted for 50% of the funding against 3% for the period The project dispersal ratio for funding for the period has shown great improvement as compared with This ratio is lowest in case of Ministry of Earth Sciences (0.07) and highest in case of Ministry of Steel (1) but we can ignore this since they funded only one project and the next highest is Ministry of Social Justice (0.75) and Empowerment and Ministry of Environment and Forests (0.75). (Table 3.6) Sl. No. Table 3.6 Agency wise Dispersal of and Funding among Institutions Name of Funding Agency Institutions Supported Institutions Accounting for 50% of Institutions Accounting for 50% of Funding Number Number Number Project Dispersal Ratio as per Number of Project Dispersal Ratio as Per Funding 1. All India Council for Technical Education Coal India Limited Council of Scientific and Industrial Research Defence Research and Development Organisation Department of Atomic Energy Department of AYUSH Department of Bio- Technology Department of Coal Department of Ocean Development Department of Science 10. and Technology Department of Scientific 11. and Industrial Research Indian Council of Medical 12. Research Indian Space Research 13. Organisation Ministry of 14. Communications & IT Ministry of Earth Sciences Ministry of Environment 16. and Forests
58 Chapter 3 50 Sl. No. Name of Funding Agency Institutions Supported Institutions Accounting for 50% of Institutions Accounting for 50% of Funding Number Number Number Project Dispersal Ratio as per Number of Project Dispersal Ratio as Per Funding Ministry of New & 17. Renewable Energy Ministry of Power Ministry of Social Justice 19. and Empowerment Ministry of Steel Ministry of Water 21. Resources Petroleum Conservation 22. Research Association University Grants 23. Commission * **Note: - For overall total of number of institutions supported, refer Table 3.1. For arriving at the overall total of number of institutions supported, each institute has been treated as a unique institute e.g. if an institute has been supported by more than one funding agency, the number of institutions supported is counted as one. *Includes 117 individual Entrepuner
59 51 Chapter 4 Region wise Distribution of Sponsored This chapter deals with analysis of EMR funding distribution region wise for the period on the following parameters:- Distribution of EMR funding by type of cities during Distribution of EMR by cities having 50 or more projects during City wise Distribution of EMR having 50 or More during & Comparison with the earlier period w.r.t. number of cities, number of projects approved along with value Distribution of number of EMR and funding by states/uts during , , and Ranking of state/uts by R&D funding during State wise number of universities receiving R&D support 4.1 City-wise Distribution During the period under review, , the R&D funding was dispersed among the various institutions spread in 637 cities in the country. Among this location, institutions located in 8 Metropolitan Cities received maximum 55.7% of the total funding, followed by 31.4% in other Cities/Towns (Table 4.1) Table 4.1 Distribution of R&D Funding by Type of Cities during Sl. No. Type of Cities Cities Ahmedabad, Bangaluru, 1. Metropolitan Cities Chennai, Delhi, Hyderabad, Kolkata, Mumbai and Pune Agartala, Aizawl, Bhopal, Bhubaneswar, Dehradun, Gandhinagar, Gangtok, Imphal, Itanagar, Jaipur, 2. State Capitals Jammu, Kohima, Lucknow, Nagpur, Panaji, Patna, Raipur, Ranchi, Shillong, Shimla, Srinagar and Thiruvananthapuram Number of Cities Cost (Rs. Crores) %age
60 52 Chapter 4 Sl. No. Type of Cities Cities Number of Cities Cost (Rs. Crores) %age 3. UTs Andaman and Nicobar Islands, Chandigarh and Pondicherry Other Other than 1, 2 & 3 above as Cities/Towns per annual data base Note: - Daman and Diu, Disapur, Lakshadweep Kavaratti and Silvassa, UTs did not have any funding during the period under review 4.2 Distribution of EMR by Cities having 50 or More Out of total of 637 cities in the country where EMR were funded, 82 cities had 50 or more projects. These accounted for (82%) projects and Rs. Crore (90%) of total R&D funding during the period under review. Among these cities, maximum 30 (36.6%) cities were located in northern region, followed by 20 (24%) in southern region. Against 51 cities having 50 or more projects during the period , during , 82 cities were covered i.e. 61% increase. (Table 4.2.1). City wise details given in Annexure X Maximum funding Rs. Crores (13.8%) of total funding during ( ) was received by the institutions located in Delhi, followed by Rs. Crores (9.5%) by the institutions located in Bangalore. Similarly maximum 2286 (11.2%) of total number of projects approved during ( ) were from Delhi, followed by 1172 (5.7%) from Bangalore (Table 4.2) Table 4.2 Distribution of EMR by Cities having 50 or More during Sl. Cost City No. Number %age Rs. Crores %age 1. Delhi Bangalore Chennai Kolkata Hyderabad Mumbai Pune Chandigarh Lucknow Varanasi Kanpur Kharagpur Coimbatore Guwahati Thiruvananthapuram Tiruchirappalli Mysore Roorkee Madurai Jaipur Bhubaneswar Annamalainagar Nagpur Vellore Continued on next page
61 Chapter 4 53 Continued from previous page Sl. Cost City No. Number %age Rs. Crores %age 25. Aligarh Tirupati Kochi Visakhapatnam Allahabad Pondicherry Patiala Vadodara Agra Amritsar Imphal Ranchi Dehradun Dharwad Ahmedabad Kolhapur Dibrugarh Jorhat Aurangabad Karaikudi Tezpur Jalgaon Amravati Gorakhpur Pilani Dhanbad Shillong Nanded Bhopal Jabalpur Jammu Santiniketan V Vidyanagar Palampur Howrah Indore Rourkela Anantapur Hisar Kottayam Gwalior Ludhiana Srinagar Jamshedpur Salem Mohali Noida Warangal Kurukshetra Jodhpur Navi Mumbai Bhavnagar Nasik Shimoga Continued on next page

62 54 Chapter 4 Continued from previous page Sl. Cost City No. Number %age Rs. Crores %age 79. Burdwan Udaipur Ahmednagar Manipal Region wise Distribution of EMR during (of cities having 50 or more projects Table Region wise Distribution Sl. Cities Cost Region No. Number % Number % Rs. Crores % 1 North South West East North-East Fig. 4.1 Region wise Distribution 30 * 6058 ** * 2509 ** * 2159 ** * 585 ** Number of Cities * Number of ** Cost (Rs. Crores) 20 * 5487 ** North East Region
63 Chapter Distribution of Number of EMR and Funding by States/UTs during , , and About 70% of the projects were approved for the institutions located in seven states viz. Andhra Pradesh, Delhi, Karnataka, Maharashtra, Tamil Nadu, Uttar Pradesh and West Bengal. The share of these states witnessed a marginal decrease of 0.7% in number of projects as compared with the period These seven states contributed 76% of the total funds approved and as compared with , (2.2% increase) During , the north-eastern region consisting of eight states (Arunachal Pradesh, Assam, Manipur, Meghalaya, Mizoram, Nagaland, Sikkim and Tripura) accounted for only 6.6% of the projects and 3.3% of the total funding of Rs. crores This period witnessed a slight increase in the percentage of projects allocated to this region over that in (3.7%) and value wise (0.7%). (Table 4.3) Sl. No. Table 4.3 Distribution of Number of EMR and Funding by States/UTs during , , and State / UTs Proj. Nos Proj. Proj. Proj. Cost Cost Cost (Rs. Crores) Nos. (Rs. Crores) Nos. (Rs. Crores) Nos. Cost (Rs. Crores) 1. Andaman & Nicobar Andhra Pradesh Arunachal Pradesh Assam Bihar Chandigarh Chhatisgarh* Daman & Diu Delhi Goa Gujarat Haryana HP J&K Jharkhand* Karnataka Kerala MP Maharashtra Manipur Meghalaya Mizoram Nagaland Orissa Pondicherry Punjab Rajasthan Sikkim Tamil Nadu Tripura Uttar Pradesh
64 56 Chapter 4 Sl. No. State / UTs Proj Proj. Proj. Proj. Cost Cost Cost Cost Nos. (Rs. (Rs. (Rs. (Rs. Nos. Nos. Nos. Crores) Crores) Crores) Crores) 32. Uttarakhand* West Bengal Ranking of State/UTs by R&D Funding during Maximum funding (13.8%) was received by institutes in Delhi, followed by (13.1%) in Maharashtra and least in (0.1%) in Mizoram. Value wise, about 76% of the projects who received R&D funding were located in 7 states viz Andhra Pradesh, Delhi, Maharashtra, Karnataka Tamil Nadu, Uttar Pradesh and West Bengal. As compared with 74% in As regards number of projects, in , 69.4% projects were funded from these 7 states as compared with 70% in i.e. more or less same. Five states Andhra Pradesh, Delhi, Karnataka, Maharashtra and Tamil Nadu accounted 59.6% of the total funding of Rs. crores Since the total number of states/uts is 32, the state funding dispersal ratio is 5/32 = This means the dispersal of project funding among the states during the period was extremely low and it is same as during the period (Table 4.4 & Fig.4.2) Sl. No. Table 4.4 Ranking of State/UTs by R&D Funding during State / UTs Number of Cost Rs. Crores %age of Funding 1. Delhi Maharashtra Tamil Nadu Karnataka Andhra Pradesh West Bengal Uttar Pradesh Kerala Jharkhand Uttarakhand Gujarat Assam Punjab Chandigarh Haryana Rajasthan Orissa Madhya Pradesh Himachal Pradesh Jammu & Kashmir Meghalaya Manipur Pondicherry Goa Chhattisgarh

65 Chapter 4 57 Sl. No. State / UTs Number of Cost Rs. Crores %age of Funding 26. Bihar Arunachal Pradesh Sikkim Andaman & Nicobar Nagaland Tripura Mizoram Fig. 4.2 Ranking of Top Five States by Percentage of Funding %age Funding State 4.5 State wise Number of Universities Receiving R&D Support Maximum 73 (25.4%) universities funded were situated in the state of Maharashtra, followed by 26 (9%) in Tamil Nadu.However maximum number of projects 1030 (14.7%) were approved form the state of Tamil Nadu, followed by 841 (12%) from Uttar Pradesh. Funding wise maximum Rs. crores (16.5%) were approved for the state of Delhi, followed by Rs. crores (15.1%) for Tamil Nadu. (Table 4.5 & Fig.4.3, 4.4, 4.4.1) Maximum projects 1030 (14.7%) were awareded to universities in Tamil Nadu, followed by 841 (12%) Uttar Pradesh. (Fig. 4.3). Funding wise universities of Delhi recivied maximum funding of Rs. Crores (16.5%), followed by Tamil Nadu Rs. Crores (15%) (Fig ) Table 4.5 State wise Number of Universities Receiving R&D Support during Sl. No. State Universities Funding Number %age Number %age Rs. Crores %age 1. Maharashtra Tamil Nadu Uttar Pradesh Andhra Pradesh West Bengal Gujarat

66 58 Chapter 4 Sl. No. State Universities Funding Number %age Number %age Rs. Crores %age 7. Karnataka Madhya Pradesh Rajasthan Assam Delhi Haryana Punjab Kerala Orissa Uttarakhand Bihar Himachal Pradesh Jammu & Kashmir Chhattisgarh Tripura Jharkhand Manipur Meghalaya And. & Nicobar Arunachal Pradesh Chandigarh Goa Mizoram Nagaland Pondicherry Fig. 4.3 State wise Number of Universities Receiving R&D Support during Number State


67 Chapter 4 59 Fig. 4.4 State wise Number of for Universities Receiving R&D Support during Rs. Crores Number () State Fig State wise Funding of Universities during State
According to the Census of India, rural
 AAJEEVIKA-A FRESH LEASE OF LIFE FOR THE RURAL PEOPLE Dr. Mukesh Kumar Shrivastava According to the Census of India, rural population constitutes 68.84 percent of the total population of the country. Though,
[For Admission Test to VI Class] Based on N.C.E.R.T. Pattern. By J. N. Sharma & T. S. Jain UPKAR PRAKASHAN, AGRA 2
![[For Admission Test to VI Class] Based on N.C.E.R.T. Pattern. By J. N. Sharma & T. S. Jain UPKAR PRAKASHAN, AGRA 2](/thumbs/71/65941921.jpg "[For Admission Test to VI Class] Based on N.C.E.R.T. Pattern. By J. N. Sharma & T. S. Jain UPKAR PRAKASHAN, AGRA 2") [For Admission Test to VI Class] Based on N.C.E.R.T. Pattern By J. N. Sharma & T. S. Jain 2015 UPKAR PRAKASHAN, AGRA 2 Publishers Dedicated to His Holiness Shri Nantin Maharaj Shyam Khet Nainital Hindi
[For Admission Test to VI Class] Based on N.C.E.R.T. Pattern By J. N. Sharma & T. S. Jain 2015 UPKAR PRAKASHAN, AGRA 2 Publishers Dedicated to His Holiness Shri Nantin Maharaj Shyam Khet Nainital Hindi
NATIONAL INSTITUTE OF HOMOEOPATHY
 (i) (ii) (iii) No.8-012/NIH/DAVP/2012 NATIONAL INSTITUTE OF HOMOEOPATHY (An Autonomous Organisation) Govt. of India Ministry of AYUSH GE Block, Sector-III, Salt Lake, Kolkata-700106 Website: www.nih.nic.in
(Effective from )
") PADHO PARDESH - SCHEME OF INTEREST SUBSIDY ON EDUCATIONAL LOANS FOR OVERSEAS STUDIES FOR THE STUDENTS BELONGING TO THE MINORITY COMMUNITIES (Effective from 2013-14) GOVERNMENT OF INDIA MINISTRY OF MINORITY
PADHO PARDESH - SCHEME OF INTEREST SUBSIDY ON EDUCATIONAL LOANS FOR OVERSEAS STUDIES FOR THE STUDENTS BELONGING TO THE MINORITY COMMUNITIES (Effective from 2013-14) GOVERNMENT OF INDIA MINISTRY OF MINORITY
Library Consortia: Advantages and Disadvantages
 International Journal of Information Technology and Library Science. Volume 2, Number 1 (2013), pp. 1-5 Research India Publications http://www.ripublication.com Library Consortia: Advantages and Disadvantages
STATUS OF OPAC AND WEB OPAC IN LAW UNIVERSITY LIBRARIES IN SOUTH INDIA
 CHAPTER - 5 STATUS OF OPAC AND WEB OPAC IN LAW UNIVERSITY LIBRARIES IN SOUTH INDIA 5.0. Introduction Library automation implies the application of computers and utilization of computer based products and
INSTITUTE OF MANAGEMENT STUDIES NOIDA
 INSTITUTE OF MANAGEMENT STUDIES NOIDA MANDATORY DISCLOSURE- PGDM PROGRAMME The information has been provided by the concerned institution and the onus of authenticity lies with the Institution and not
National rural Health mission Ministry of Health and Family Welfare government of India, new delhi
 National rural Health mission Ministry of Health and Family Welfare government of India, new delhi Update on the ASHA Programme July 2011 C ontents Introduction... 1 1. Findings of the Recent Evaluations...
JOIN INDIAN COAST GUARD
 1 JOIN INDIAN COAST GUARD (MINISTRY OF DEFENCE) AS NAVIK (DOMESTIC BRANCH) 10 th ENTRY - 01/2018 BATCH APPLICATION WILL BE ACCEPTED ONLINE FROM 16 TO 23 OCT 2017 1. Applications are invited from Indian
NAVODAYA VIDYALAYA SAMITI PROSPECTUS FOR JAWAHAR NAVODAYA VIDYALAYA SELECTION TEST- 2014
 NAVODAYA VIDYALAYA SAMITI PROSPECTUS FOR JAWAHAR NAVODAYA VIDYALAYA SELECTION TEST- 2014 1. NAVODAYA VIDYALAYA SCHEME 1.1 Introduction In accordance with the National Policy of Education (1986) Government
Bangalore Mysore Pondicherry Tirupati
 The Royal Cottage, Bangalore Palace, Vasanthanagar, Bangalore- 560 052. Tel: 080 23560387 / 23560389. scalinggreaterheights@gemsbschool.comw ww.gemsbschool.com Bangalore Mysore Pondicherry Tirupati About
COLLEGE OF ENGINEERING (WOMEN)
") NAAC Re-Accreditation Report 58 COLLEGE OF ENGINEERING (WOMEN) 1. Name of the off-campus College : COLLEGE OF ENGINEERING (WOMEN). Year of establishment : 010 3. Is the Centre part of the university? Yes
NAAC Re-Accreditation Report 58 COLLEGE OF ENGINEERING (WOMEN) 1. Name of the off-campus College : COLLEGE OF ENGINEERING (WOMEN). Year of establishment : 010 3. Is the Centre part of the university? Yes
Literacy Level in Andhra Pradesh and Telangana States A Statistical Study
 The International Journal of Engineering and Science (IJES) Volume 6 Issue 6 Pages PP 70-77 2017 ISSN (e): 2319 1813 ISSN (p): 2319 1805 Literacy Level in Andhra Pradesh and Telangana States A Statistical
User education in libraries
 International Journal of Library and Information Science Vol. 1(1) pp. 001-005 June, 2009 Available online http://www.academicjournals.org/ijlis 2009 Academic Journals Review User education in libraries
CREATING AWARENESS ABOUT PARLIAMENTARY SYSTEM AND PROCEDURES
 144 Handbook on the Working of Ministry of Parliamentary Affairs 15 CREATING AWARENESS ABOUT PARLIAMENTARY SYSTEM AND PROCEDURES BACKGROUND The 4th All India Whips Conference, held at Bombay in 1962, made
NAVODAYA VIDYALAYA SAMITI PROSPECTUS FOR JAWAHAR NAVODAYA VIDYALAYA SELECTION TEST- 2016
 NAVODAYA VIDYALAYA SAMITI PROSPECTUS FOR JAWAHAR NAVODAYA VIDYALAYA SELECTION TEST- 2016 1. NAVODAYA VIDYALAYA SCHEME 1.1 Introduction In accordance with the National Policy of Education (1986) Government
NAVODAYA VIDYALAYA SAMITI PROSPECTUS FOR JAWAHAR NAVODAYA VIDYALAYA SELECTION TEST- 2018
 NAVODAYA VIDYALAYA SAMITI PROSPECTUS FOR JAWAHAR NAVODAYA VIDYALAYA SELECTION TEST- 2018 1. NAVODAYA VIDYALAYA SCHEME 1.1 Introduction In accordance with the National Policy of Education (1986) Government
UNIVERSITY OF MYSORE * * *
 UNIVERSITY OF MYSORE STATUTES RELATING TO DIRECT RECRUITMENT AND CAREER ADVANCEMENT SCHEME AND MISCELLANEOUS PROVISIONS TO IMPLEMENT THE UGC PAY SCALES TO TEACHERS, PRINCIPALS OF THE CONSTITUENT COLLEGES,
The Gandhigram Rural Institute Deemed University Gandhigram
 The Gandhigram Rural Institute Deemed University Gandhigram 624 302 1. Dean Dayal Upadhyay KAUSHAL Kendra (DDU - KK) The University Grants Commission (UGC) has launched a scheme based on skills development
Ref. No.YFI/ Dated:
 YOGA FEDERATION OF INDIA (REGD. UNDER THE SOCIETIES REGISTRATION ACT. XXI OF 1860 REGD. NO.1195 DATED 14.02.90) RECOGNIZED BY INDIAN OLYMPIC ASSOCIATION - OCTOBER, 1998 TO FEBRUARY, 2011 Affiliated to
Mangalagangothri , D.K. District, Karnataka
 MANGALORE UNIVERSITY Mangalagangothri 574 199, D.K. District, Karnataka APPLICATION FOR TEACHING/PRINCIPAL/ACADEMIC POSTS (To be submitted in sets along with all enclosures) DD/Challan & Date Bank & Branch
Advertisement No. 2/2013
 OFFICE OF THE REGISTRAR ASSAM AGRICULTURAL UNIVERSITY JORHAT-785013 Advertisement No. 2/2013 Applications from the Indian citizens are invited for 19 (nineteen) posts of Jr. Scientists and equivalent rank
व रण क ए आ दन-पत र. Prospectus Cum Application Form. न दय व kऱय सम त. Navodaya Vidyalaya Samiti ਨਵ ਦ ਆ ਦਵਦ ਆਦ ਆ ਸਦ ਤ. Navodaya Vidyalaya Samiti
 व रण क ए आ दन-पत र ENGLISH / ह द / ਪ ਜ ਬ Prospectus Cum Application Form PROSPECTUS IS FREE OF COST न दय व kऱय सम त Navodaya Vidyalaya Samiti ਨਵ ਦ ਆ ਦਵਦ ਆਦ ਆ ਸਦ ਤ व रण क तन:श ल क Navodaya Vidyalaya Samiti
Systematic Assessment and Monitoring leading to Improving Quality of Education
 Systematic Assessment and Monitoring leading to Improving Quality of Education Abstract This study was aimed at assessment of quality of teaching-learning process and impact of interventions on actual
E-LEARNING IN LIBRARY OF JAMIA HAMDARD UNIVERSITY
 Library Science E-LEARNING IN LIBRARY OF JAMIA HAMDARD UNIVERSITY Kirtika Bhatli* ABSTRACT The paper is study of E-learning system in Jamia Hamdard University, Hamdard Nagar Delhi. The objectives of the
Pragmatic Constraints affecting the Teacher Efficacy in Ethiopia - An Analytical Comparison with India
 Pragmatic Constraints, Affecting the Teacher Surapaneni B. & Sisay S. 81 REVIEW ARTICLE Pragmatic Constraints affecting the Teacher Efficacy in Ethiopia - An Analytical Comparison with India Surapaneni
A Pipelined Approach for Iterative Software Process Model
 A Pipelined Approach for Iterative Software Process Model Ms.Prasanthi E R, Ms.Aparna Rathi, Ms.Vardhani J P, Mr.Vivek Krishna Electronics and Radar Development Establishment C V Raman Nagar, Bangalore-560093,
Government of Tamil Nadu TEACHERS RECRUITMENT BOARD 4 th Floor, EVK Sampath Maaligai, DPI Campus, College Road, Chennai
 Advertisement No. 04/ 2017 Dated: 16.06.2017 Government of Tamil Nadu TEACHERS RECRUITMENT BOARD 4 th Floor, EVK Sampath Maaligai, DPI Campus, College Road, Chennai -600 006. NOTIFICATION / ADVERTISEMENT
OPAC and User Perception in Law University Libraries in the Karnataka: A Study
 ISSN 2229-5984 (P) 29-5576 (e) OPAC and User Perception in Law University Libraries in the Karnataka: A Study Devendra* and Khaiser Nikam** To Cite: Devendra & Nikam, K. (20). OPAC and user perception
COMMISSIONER AND DIRECTOR OF SCHOOL EDUCATION ANDHRA PRADESH :: HYDERABAD NOTIFICATION FOR RECRUITMENT OF TEACHERS 2012
 COMMISSIONER AND DIRECTOR OF SCHOOL EDUCATION ANDHRA PRADESH :: HYDERABAD NOTIFICATION FOR RECRUITMENT OF TEACHERS 2012 INFORMATION BULLETIN 1. In pursuance of the orders of the Government in G.O.Ms.No.159,
Thiagarajar College (Autonomous), Madurai 9 (Re-Accredited with A Grade by NAAC)
, Madurai 9 (Re-Accredited with A Grade by NAAC)") Thiagarajar College (Autonomous), Madurai 9 (Re-Accredited with A Grade by NAAC) R.Raja Govindasamy Principal 17.12.2009 To Thiru. B.S.Ponmudiraj, Assistant Adviser, National Assessment and Accreditation
Thiagarajar College (Autonomous), Madurai 9 (Re-Accredited with A Grade by NAAC) R.Raja Govindasamy Principal 17.12.2009 To Thiru. B.S.Ponmudiraj, Assistant Adviser, National Assessment and Accreditation
Information Communication Technology (ICT) Infrastructure Facilities in Self-Financing Engineering College Libraries in Tamil Nadu
 Infrastructure Facilities in Self-Financing Engineering College Libraries in Tamil Nadu") University of Nebraska - Lincoln DigitalCommons@University of Nebraska - Lincoln Library Philosophy and Practice (e-journal) Libraries at University of Nebraska-Lincoln 3-2011 Information Communication
University of Nebraska - Lincoln DigitalCommons@University of Nebraska - Lincoln Library Philosophy and Practice (e-journal) Libraries at University of Nebraska-Lincoln 3-2011 Information Communication
Bharathiar University: Coimbatore 46
 1 Bharathiar University: Coimbatore 46 Internal Quality Assurance Cell (IQAC) The Annual Quality Assurance Report (AQAR) - 2011-12 1. Details of the Institution Part A 1.1 Name of the Institution : Bharathiar
NAVODAYA VIDYALAYA SAMITI PROSPECTUS FOR JAWAHAR NAVODAYA VIDYALAYA SELECTION TEST- 2015
 NAVODAYA VIDYALAYA SAMITI PROSPECTUS FOR JAWAHAR NAVODAYA VIDYALAYA SELECTION TEST- 2015 1. NAVODAYA VIDYALAYA SCHEME 1.1 Introduction In accordance with the National Policy of Education (1986) Government
NAVODAYA VIDYALAYA SAMITI PROSPECTUS FOR JAWAHAR NAVODAYA VIDYALAYA SELECTION TEST- 2015
 NAVODAYA VIDYALAYA SAMITI PROSPECTUS FOR JAWAHAR NAVODAYA VIDYALAYA SELECTION TEST- 2015 1. NAVODAYA VIDYALAYA SCHEME 1.1 Introduction In accordance with the National Policy of Education (1986) Government
Prof. Dr. Hussein I. Anis
 Curriculum Vitae Prof. Dr. Hussein I. Anis 1 Personal Data Full Name : Hussein Ibrahim Anis Date of Birth : November 20, 1945 Nationality : Egyptian Present Occupation : Professor, Electrical Power & Machines
FACULTY DETAILS. Department of African Studies, University of Delhi, Delhi
 FACULTY DETAILS Title Prof. First Name Tribhuwan Last Name Prasad Photograph Designation Professor Address Department of African Studies, University of Delhi, Delhi- 110007. Phone No Office 011 27666673
RCPCH MMC Cohort Study (Part 4) March 2016
 March 2016") RCPCH MMC Cohort Study (Part 4) March 2016 Acknowledgements Dr Simon Clark, Officer for Workforce Planning, RCPCH Dr Carol Ewing, Vice President Health Services, RCPCH Dr Daniel Lumsden, Former Chair,
RCPCH MMC Cohort Study (Part 4) March 2016 Acknowledgements Dr Simon Clark, Officer for Workforce Planning, RCPCH Dr Carol Ewing, Vice President Health Services, RCPCH Dr Daniel Lumsden, Former Chair,
Impact of Digital India program on Public Library professionals. Manendra Kumar Singh
 Manendra Kumar Singh Research Scholar, Department of Library & Information Science, Banaras Hindu University, Varanasi, Uttar Pradesh 221005 Email: manebhu007@gmail.com Abstract Digital India program is
Creating Teachers Communities of Learning. Report on the Subject Teacher Forum Program IT for Change
 Creating Teachers Communities of Learning Report on the Subject Teacher Forum Program IT for Change Table of Contents 1 Background...3 2 Goals of the programme...3 2.1 Subject Matter Expertise...3 2.2
HEALTH SERVICES ADMINISTRATION
 Assessment of Library Collections Program Review HEALTH SERVICES ADMINISTRATION Tony Schwartz Associate Director for Collection Management April 13, 2006 Update: the main additions to the health science
Computers on Wheels!!
 Computers on Wheels!! Computer Education Through Mobile Computer Vans for Rural Children. The Project: Vidya Pratishthan s Institute of Information Technology (VIIT), Baramati, Dist. Pune, Maharashtra,
Sl. No. Name of the Post Pay Band & Grade Pay No. of Post(s) Category
 Category") National Institute of Open Schooling (An autonomous organization under the Deptt. of School Education & Literacy, MHRD Govt. of India) A-24-25, Institutional Area, Sector 62, NOIDA- 201309, Uttar Pradesh
National Institute of Open Schooling (An autonomous organization under the Deptt. of School Education & Literacy, MHRD Govt. of India) A-24-25, Institutional Area, Sector 62, NOIDA- 201309, Uttar Pradesh
University Faculty Details Page on DU Web-site
 University Faculty Details Page on DU Web-site Title Dr. First Name Poonam Last Name Dass Photograph Designation Assistant Professor - Law Department Law Centre I, Faculty of Law Address (Campus) Law Centre
International Journal of Innovative Research and Advanced Studies (IJIRAS) Volume 4 Issue 5, May 2017 ISSN:
 Volume 4 Issue 5, May 2017 ISSN:") Effectiveness Of Using Video Presentation In Teaching Biology Over Conventional Lecture Method Among Ninth Standard Students Of Matriculation Schools In Coimbatore District Ms. Shigee.K Master of Education,
Effectiveness Of Using Video Presentation In Teaching Biology Over Conventional Lecture Method Among Ninth Standard Students Of Matriculation Schools In Coimbatore District Ms. Shigee.K Master of Education,
Curriculum Vitae of Dr. Bani Bhattacharya
 Curriculum Vitae of Dr. Bani Bhattacharya Broad Area of Expertise: Education Technology Instructional Design Pedagogy Technology Enhanced Education (TEL) Technology Enhanced Off campus education e-learning
STUDY IN INDIA AND SWEDEN, EUROPE
 Uni DOUBLE DEGREE MASTER S PROGRAM Andhra University, India * Memorandum of Cooperation * Blekinge Institute of Technology, Sweden Blekinge Institute of Technology (BTH) is the most profiled modern university
No.1-32/2006-U.II/U.I(ii) Government of India Ministry of Human Resource Development Department of Higher Education
 Government of India Ministry of Human Resource Development Department of Higher Education") No.1-32/2006-U.II/U.I(ii) Government of India Ministry of Human Resource Development Department of Higher Education New Delhi, dated the 31St December, 2008 To The Secretary, University Grants Commission,
No.1-32/2006-U.II/U.I(ii) Government of India Ministry of Human Resource Development Department of Higher Education New Delhi, dated the 31St December, 2008 To The Secretary, University Grants Commission,
INDIAN STATISTICAL INSTITUTE 203, BARRACKPORE TRUNK ROAD KOLKATA
 INDIAN STATISTICAL INSTITUTE 203, BARRACKPORE TRUNK ROAD KOLKATA 700 108 A D V E R T I S E M E N T Applications are invited from Indian Nationals for recruitment of following posts required at Kolkata,
Biodiversity Conservation
 Biodiversity Conservation 13 13.1 Omkareshwar Eco Development Programme CEE wildlife has its presence on the bank of river Narmada in Madhya Pradesh since 2006. Narmada Valley Development Authority and
An Evaluation of E-Resources in Academic Libraries in Tamil Nadu
 An Evaluation of E-Resources in Academic Libraries in Tamil Nadu 1 S. Dhanavandan, 2 M. Tamizhchelvan 1 Assistant Librarian, 2 Deputy Librarian Gandhigram Rural Institute - Deemed University, Gandhigram-624
ESIC Advt. No. 06/2017, dated WALK IN INTERVIEW ON
 EMPLOYEES STATE INSURANCE CORPORATION ESIC-PGIMSR & ESIC MEDICAL COLLEGE ESIC Hospital & ODC (EZ) Diamond Harbour Road, P.O. Joka, Kolkata - 700104 Tel No: (033) 24381382, Tel/Fax No: (033) 24381176 E-mail:
The Isett Seta Career Guide 2010
 The Isett Seta Career Guide 2010 Our Vision: The Isett Seta seeks to develop South Africa into an ICT knowledge-based society by encouraging more people to develop skills in this sector as a means of contributing
vecsmdj fo'ofo ky; fnyyh
 vecsmdj fo'ofo ky; fnyyh AMBEDKAR UNIVERSITY DELHI Advt. No. 01/HR/2016 09 June 2016 The Ambedkar University Delhi (AUD) is a State University established by the Government of NCT of Delhi through Dr B.R.
Diploma in Library and Information Science (Part-Time) - SH220
 - SH220") Diploma in Library and Information Science (Part-Time) - SH220 1. Objectives The Diploma in Library and Information Science programme aims to prepare students for professional work in librarianship. The
Diploma in Library and Information Science (Part-Time) - SH220 1. Objectives The Diploma in Library and Information Science programme aims to prepare students for professional work in librarianship. The
SUMMARY ON JEE (ADVANCED) [KANPUR ZONE] P Gupta & R N Sen Gupta
![SUMMARY ON JEE (ADVANCED) [KANPUR ZONE] P Gupta & R N Sen Gupta](/thumbs/71/65582943.jpg "SUMMARY ON JEE (ADVANCED) [KANPUR ZONE] P Gupta & R N Sen Gupta") SUMMARY ON JEE (ADVANCED)- 2013 [KANPUR ZONE] P Gupta & R N Sen Gupta Admission Policy Eligibility Criteria: Top 1,50,000 candidates, from all categories, based on their JEE(Main) scores Admission Criteria:
SUMMARY ON JEE (ADVANCED)- 2013 [KANPUR ZONE] P Gupta & R N Sen Gupta Admission Policy Eligibility Criteria: Top 1,50,000 candidates, from all categories, based on their JEE(Main) scores Admission Criteria:
The Annual Quality Assurance Report (AQAR) of the IQAC Part A. Near National Highway No. 6. At/Post/Tq. Parola, Dist. Jalgaon.
 of the IQAC Part A. Near National Highway No. 6. At/Post/Tq. Parola, Dist. Jalgaon.") The Annual Quality Assurance Report (AQAR) of the IQAC 2012-13 1. Details of the Institution 1.1 Name of the Institution Part A KVP Sansthas Kisan Arts, Commerce and Science College, Parola 1.2 Address
The Annual Quality Assurance Report (AQAR) of the IQAC 2012-13 1. Details of the Institution 1.1 Name of the Institution Part A KVP Sansthas Kisan Arts, Commerce and Science College, Parola 1.2 Address
SPORTS POLICIES AND GUIDELINES
 April 27, 2010 SPORTS POLICIES AND GUIDELINES I. POLICY AND INTENT A. Eligibility Residents of Scarsdale and the Mamaroneck Strip ( residents of Scarsdale ) and students who attend the Scarsdale Public
JAWAHAR NAVODAYA VIDYALAYA, RAKH JAGANOO DISTT:UDHAMPUR (J&K)
") JAWAHAR NAVODAYA VIDYALAYA, RAKH JAGANOO DISTT:UDHAMPUR (J&K) ADMISSION NOTICE It is notified for all the concerned Students, Parents, ZEO s and CEO of District Udhampur that JNVST-2018 entrance Exam which
JAWAHAR NAVODAYA VIDYALAYA, RAKH JAGANOO DISTT:UDHAMPUR (J&K) ADMISSION NOTICE It is notified for all the concerned Students, Parents, ZEO s and CEO of District Udhampur that JNVST-2018 entrance Exam which
State of play of EQF implementation in Montenegro Zora Bogicevic, Ministry of Education Rajko Kosovic, VET Center
 State of play of EQF implementation in Montenegro Zora Bogicevic, Ministry of Education Rajko Kosovic, VET Center XXV meeting of the EQF Advisory Group 4-6 June 2014, Brussels MONTENEGRIN QUALIFICATIONS
MANGALORE UNIVERSITY
 MANGALORE UNIVERSITY No.MU/34/EST(1)/2012-13/Principal N O T I F I C A T I O N OFFICE OF THE REGISTRAR MANGALAGANGOTHRI-574199 Date:10.05.2013 Applications in the prescribed form in TEN sets are invited
2. Contact Information : 19, Samarth colony, M. J. College Road, Jalgaon-01 Tel. No ; Mobil :
 Dr. Anil N. Chikate 1. Full Name with Profile Photo: DR. ANIL NANAJI CHIKATE Deputy Librarian 2. Contact Information : 19, Samarth colony, M. J. College Road, Jalgaon-01 Tel. No. 2257405; Mobil : 09970361104
ACCREDITATION MANUAL FOR UG ENGINEERING PROGRAMMES (TIER-II)
") NATIONAL BOARD OF ACCREDITATION ACCREDITATION MANUAL FOR UG ENGINEERING PROGRAMMES (TIER-II) 4th Floor East Tower, NBCC Place Bhisham Pitamah Marg, Pragati Vihar New Delhi 110003 P: 91(11)24360620-22,
NATIONAL BOARD OF ACCREDITATION ACCREDITATION MANUAL FOR UG ENGINEERING PROGRAMMES (TIER-II) 4th Floor East Tower, NBCC Place Bhisham Pitamah Marg, Pragati Vihar New Delhi 110003 P: 91(11)24360620-22,
ANALYSIS: LABOUR MARKET SUCCESS OF VOCATIONAL AND HIGHER EDUCATION GRADUATES
 ANALYSIS: LABOUR MARKET SUCCESS OF VOCATIONAL AND HIGHER EDUCATION GRADUATES Authors: Ingrid Jaggo, Mart Reinhold & Aune Valk, Analysis Department of the Ministry of Education and Research I KEY CONCLUSIONS
SASKATCHEWAN MINISTRY OF ADVANCED EDUCATION
 SASKATCHEWAN MINISTRY OF ADVANCED EDUCATION Report March 2017 Report compiled by Insightrix Research Inc. 1 3223 Millar Ave. Saskatoon, Saskatchewan T: 1-866-888-5640 F: 1-306-384-5655 Table of Contents
KUMAUN UNIVERSITY, NAINITAL
 KUMAUN UNIVERSITY, NAINITAL No. Affl./Teach. Estb./1230 Dated- 24-12-2008 Application are invited for the folowing posts on prescribed form obtainable from the office of the Registrar, Kumaun University,
Assessment and national report of Poland on the existing training provisions of professionals in the Healthcare Waste Management industry REPORT: III
 Assessment and national report of Poland on the existing training provisions of professionals in the Healthcare Waste Management industry REPORT: III DEVELOPING AN EU STANDARDISED APPROACH TO VOCATIONAL
INFED. INFLIBNET Access Management Federation Yatrik Patel
 INFED INFLIBNET Access Management Federation http://parichay.inflibnet.ac.in Yatrik Patel yatrik@inflibnet.ac.in Coverage About INFLIBNET Contents by INFLIBNET Current Access Scenario Need of Federation
भ रत य व ज ञ न व क ष ए अन स ध न स स थ न वतर पवत
 ADVT. NO.: 01/2017 (Apply on or before February 15, 2017) Indian Institute of Science Education and Research, Tirupati, is a premier autonomous Institution established by the Ministry of Human Resource
The report of the DASA Committee is to be placed before the Council for deliberation and ratification.
 Minutes of the 2nd Meeting of the Standing Committee of the Council of National Institutes of Technology (NITs) held at 10:00 A.M. on 03.09.2012 in the Central Secretariat Library (1 st Floor, G Wing),
The Netherlands. Jeroen Huisman. Introduction
 4 The Netherlands Jeroen Huisman Introduction Looking solely at the legislation, one could claim that the Dutch higher education system has been officially known as a binary system since 1986. At that
Briefing document CII Continuing Professional Development (CPD) scheme.
 scheme.") Briefing document CII Continuing Professional Development (CPD) scheme www.thepfs.org 2 Contents 3 What is Continuing Professional Development > 4 Who needs to complete the CII CPD scheme > 5 What does
Briefing document CII Continuing Professional Development (CPD) scheme www.thepfs.org 2 Contents 3 What is Continuing Professional Development > 4 Who needs to complete the CII CPD scheme > 5 What does
D.No. /GC/14 Dated : Copy to the following for information and necessary action.
 ---------------------------------------------------------------------------------------------------------- Item no. 8: Considered and approved the recommendations of the Standing Establishmentcum-Grievance
- : Submitted to : - jk"vªh; ewy;kadu,oa izr;k;u ifj"kn~
 Jamshedpur Women s College (A Constituent Autonomous College of Kolhan University) College with Potential for Excellence by UGC, New Delhi A Grade College by NAAC, Bangalore JAMSHEDPUR 831 037 Ph. : (0657)2249105,
AC : ENGINEERING EDUCATION EXCELLENCE: START-UP TO NUMBER ONE
 AC 2008-432: ENGINEERING EDUCATION EXCELLENCE: START-UP TO NUMBER ONE Robert Creese, West Virginia University Robert C. Creese is Professor of Industrial Engineering in the Industrial and Management Systems
CENTRAL UNIVERSITY OF KASHMIR
 CENTRAL UNIVERSITY OF KASHMIR ELIGIBILITY F ADMISSION IN VARIOUS PROGRAMMES Annexure A INTEGRATED PROGRAMMES S.No. Integrated Programmes Department School Duration Intake Capacity Eligibility 02. 03. 04.
Financing Education In Minnesota
 Financing Education In Minnesota 2016-2017 Created with Tagul.com A Publication of the Minnesota House of Representatives Fiscal Analysis Department August 2016 Financing Education in Minnesota 2016-17
2013/Q&PQ THE SOUTH AFRICAN QUALIFICATIONS AUTHORITY
 2013/Q&PQ THE SOUTH AFRICAN QUALIFICATIONS AUTHORITY Policy and Criteria for the Registration of Qualifications and Part Qualifications on the National Qualifications Framework Compiled and produced by:
Important Questions For Physics For Maharashtra Board
 Important Questions For Physics For Board Free PDF ebook Download: Important Questions For Physics For Download or Read Online ebook important questions for physics for maharashtra board in PDF Format
Council of the European Union Brussels, 4 November 2015 (OR. en)
") Council of the European Union Brussels, 4 November 2015 (OR. en) 13631/15 NOTE From: To: General Secretariat of the Council JEUN 96 EDUC 285 SOC 633 EMPL 416 CULT 73 SAN 356 Permanent Representatives Committee/Council
Council of the European Union Brussels, 4 November 2015 (OR. en) 13631/15 NOTE From: To: General Secretariat of the Council JEUN 96 EDUC 285 SOC 633 EMPL 416 CULT 73 SAN 356 Permanent Representatives Committee/Council
HCFC Phase-Out Management Plan Servicing Sector
 Implemented by HCFC Phase-Out Management Plan Servicing Sector Roundtable Meeting 5 th March 2014 Seite 1 Implemented by HCFC Phase-Out Management Plan Servicing Sector Roundtable Meeting 5 th March 2014
B.A.B.Ed (Integrated) Course
 Course") 1 University of Pune B.A.B.Ed (Integrated) Course Objectives of the B.A.B.Ed (Integrated) Course :- To enable the student teacher 1. to promote capabilities for inculcating national values and goals as
1 University of Pune B.A.B.Ed (Integrated) Course Objectives of the B.A.B.Ed (Integrated) Course :- To enable the student teacher 1. to promote capabilities for inculcating national values and goals as
A STUDY ON AWARENESS ABOUT BUSINESS SCHOOLS AMONG RURAL GRADUATE STUDENTS WITH REFERENCE TO COIMBATORE REGION
 A STUDY ON AWARENESS ABOUT BUSINESS SCHOOLS AMONG RURAL GRADUATE STUDENTS WITH REFERENCE TO COIMBATORE REGION S.Karthick Research Scholar, Periyar University & Faculty Department of Management studies,
THE UNITED REPUBLIC OF TANZANIA MINISTRY OF EDUCATION, SCIENCE, TECHNOLOGY AND VOCATIONAL TRAINING CURRICULUM FOR BASIC EDUCATION STANDARD I AND II
 THE UNITED REPUBLIC OF TANZANIA MINISTRY OF EDUCATION, SCIENCE, TECHNOLOGY AND VOCATIONAL TRAINING CURRICULUM FOR BASIC EDUCATION STANDARD I AND II 2016 Ministry of Education, Science,Technology and Vocational
POLITECNICO DI MILANO
 Repertory. n. 1013 Protocol. n. 10147 Date 12 April 2011 Title I Class 2 UOR AG POLITECNICO DI MILANO THE CHANCELLOR CONSIDERING the Presidential Decree dated 7/11/1980 No 382 "Reorganization of University
JAMIA HAMDARD (HAMDARD UNIVERSITY) Hamdard Nagar, New Delhi
 Hamdard Nagar, New Delhi") JAMIA HAMDARD (HAMDARD UNIVERSITY) Hamdard Nagar, New Delhi 110062 Committed to excellence in higher education Declared as Deemed-to-be University under Section 3 of UGC Act 1956 vide Notification F. 9-18
JAMIA HAMDARD (HAMDARD UNIVERSITY) Hamdard Nagar, New Delhi 110062 Committed to excellence in higher education Declared as Deemed-to-be University under Section 3 of UGC Act 1956 vide Notification F. 9-18
GLOBAL MEET FOR A RESURGENT BIHAR
 GLOBAL MEET FOR A RESURGENT BIHAR 19-21 January, 2007, Patna Venue: Hotel Maurya, Patna Organised by Institute for Human Development and The Bihar Times In collaboration with Government of Bihar Organising
The DTED. Curriculum / Syllabus of the State Tamilnadu In Inidia And Performance of Student Teachers
 IOSR Journal Of Humanities And Social Science (JHSS) ISSN: 2279-0837, ISBN: 2279-085. Volume 3, Issue (Sep-Oct. 2012), PP 01-1 Www.Iosrjournals.Org The DTED. Curriculum / Syllabus of the State Tamilnadu
Education in Armenia. Mher Melik-Baxshian I. INTRODUCTION
 Education in Armenia Mher Melik-Baxshian I. INTRODUCTION Education has always received priority in Armenia a country that has a history of literacy going back 1,600 years. From the very beginning the school
A STUDY ON INFORMATION SEEKING BEHAVIOUR OF STUDENTS WITH SPECIAL REFERENCE TO ENGINEERING COLLEGES IN VELLORE DISTRICT G. SARALA
 International Journal of Library Science and Research (IJLSR) ISSN (P): 2250-2351; ISSN (E): 2321-0079 Vol. 7, Issue 3, Jun 2017, 33-42 TJPRC Pvt. Ltd. A STUDY ON INFORMATION SEEKING BEHAVIOUR OF STUDENTS
MAHATMA GANDHI KASHI VIDYAPITH Deptt. of Library and Information Science B.Lib. I.Sc. Syllabus
 MAHATMA GANDHI KASHI VIDYAPITH Deptt. of Library and Information Science B.Lib. I.Sc. Syllabus The Library and Information Science has the attributes of being a discipline of disciplines. The subject commenced
DUTIES & RESPONSIBILITIES OF DEPUTY REGISTRAR (GENERAL)
") DEPUTY REGISTRAR (GENERAL) I- ESTABLISHMENT 1. Service matters such as appointments, promotions, retirement, disciplinary action, sanction of leave, awarding incentive pertaining to both teaching and non-teaching
DEPUTY REGISTRAR (GENERAL) I- ESTABLISHMENT 1. Service matters such as appointments, promotions, retirement, disciplinary action, sanction of leave, awarding incentive pertaining to both teaching and non-teaching
Leprosy case detection using schoolchildren
 Lepr Rev (2004) 75, 34±39 Leprosy case detection using schoolchildren G. NORMAN, G. A. JOSEPH, P. UDAYASURIYAN, P. SAMUEL & M. VENUGOPAL Schieffelin Leprosy Research and Training Center, Karigiri, Vellore
CURRICULUM VITAE. To develop expertise in Graph Theory and expand my knowledge by doing Research in the same.
 Mrs. JESSICA PEREIRA. BITS Pilani KK Birla Goa Campus. Qtr No. D - 122, Mathematics Department. NH 17B Zuarinagar Goa 403726 India. Office: +91-832-2580445 Mobile: +919921004218 Email: jessica@goa.bits-pilani.ac.in
Re-Advertisement No.: 01/2017 Dated:
 1 The West Bengal University of Teachers Training, Education Planning and Administration 25/2 & 25/3, Ballygunge Circular Road, Kolkata-700019 Website: www.wbuttepa.ac.in, E-mail: wbuttepa@gmail.com Re-Advertisement
RAJASTHAN CENTRALIZED ADMISSIONS TO BACHELOR OF PHYSIOTHERAPY COURSE-2017 (RCA BPT-2017) INFORMATION BOOKLET
 INFORMATION BOOKLET") RAJASTHAN UNIVERSITY OF HEALTH SCIENCES Kumbha Marg, Sector-18, Pratap Nagar, Tonk Road, Jaipur -302033 Phone: 0141-2792644, 2795527 Website: www.ruhsraj.org RAJASTHAN CENTRALIZED ADMISSIONS TO BACHELOR
RAJASTHAN UNIVERSITY OF HEALTH SCIENCES Kumbha Marg, Sector-18, Pratap Nagar, Tonk Road, Jaipur -302033 Phone: 0141-2792644, 2795527 Website: www.ruhsraj.org RAJASTHAN CENTRALIZED ADMISSIONS TO BACHELOR
MSc Education and Training for Development
 MSc Education and Training for Development Awarding Institution: The University of Reading Teaching Institution: The University of Reading Faculty of Life Sciences Programme length: 6 month Postgraduate
Western Australia s General Practice Workforce Analysis Update
 Western Australia s General Practice Workforce Analysis Update NOVEMBER 2015 PUBLISHED MAY 2016 Rural Health West This work is copyright. Apart from any use as permitted under the Copyright Act 1968, no
Status of Women of Color in Science, Engineering, and Medicine
 Status of Women of Color in Science, Engineering, and Medicine The figures and tables below are based upon the latest publicly available data from AAMC, NSF, Department of Education and the US Census Bureau.
The Comparative Study of Information & Communications Technology Strategies in education of India, Iran & Malaysia countries
 Australian Journal of Basic and Applied Sciences, 6(9): 310-317, 2012 ISSN 1991-8178 The Comparative Study of Information & Communications Technology Strategies in education of India, Iran & Malaysia countries