A Prediction Model for Retention and Graduation Rates Using IPEDS and WSCUC GRD
|
|
|
- Robert Bryant
- 6 years ago
- Views:
Transcription


1 A Prediction Model for Retention and Graduation Rates Using IPEDS and WSCUC GRD Serge Herzog, PhD Director, Institutional Analysis Consultant, CRDA StatLab University of Nevada, Reno John Stanley, MEd Director, Institutional Research University of Hawaii West Oahu WSCUC ARC Conference, April 19-21, 2017, San Diego, CA

2 Introduction Retention and graduation rates are key performance indicators (KPIs) used in college rankings, accreditation and assessment reports, and national accountability systems. Retention and graduation rates are used increasingly as part of state-support funding formulas for public colleges and universities.
3 Background Today s study builds on a research project completed at the AIR/NCES National Data Institute in Washington D.C. (2013), and subsequent research by Pike & Graunke (2015). Objective of NDI work was to produce two institution-level prediction models (for retention and graduation rates) using IPEDS data and standard regression methods.
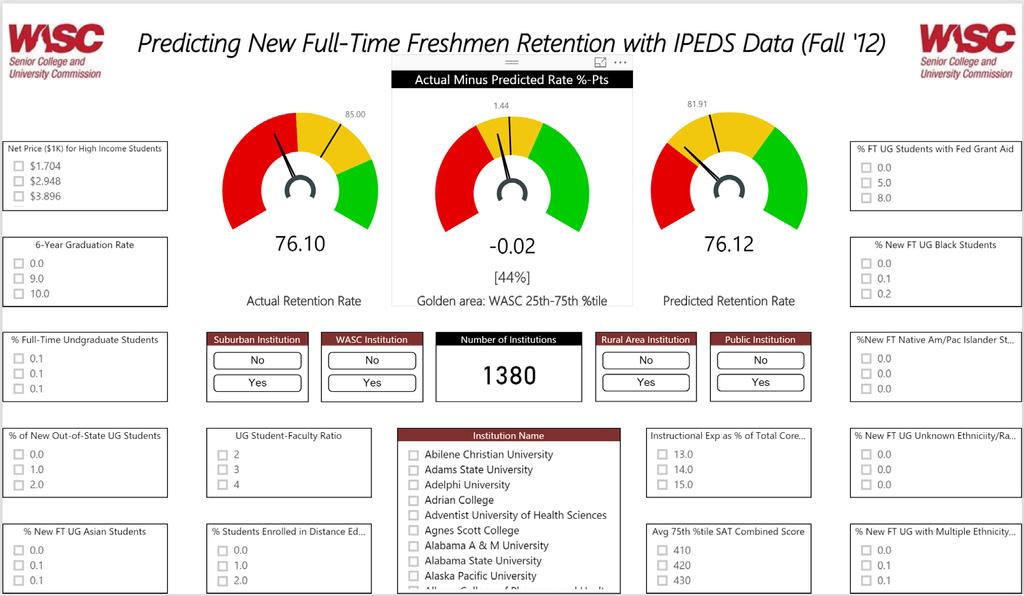
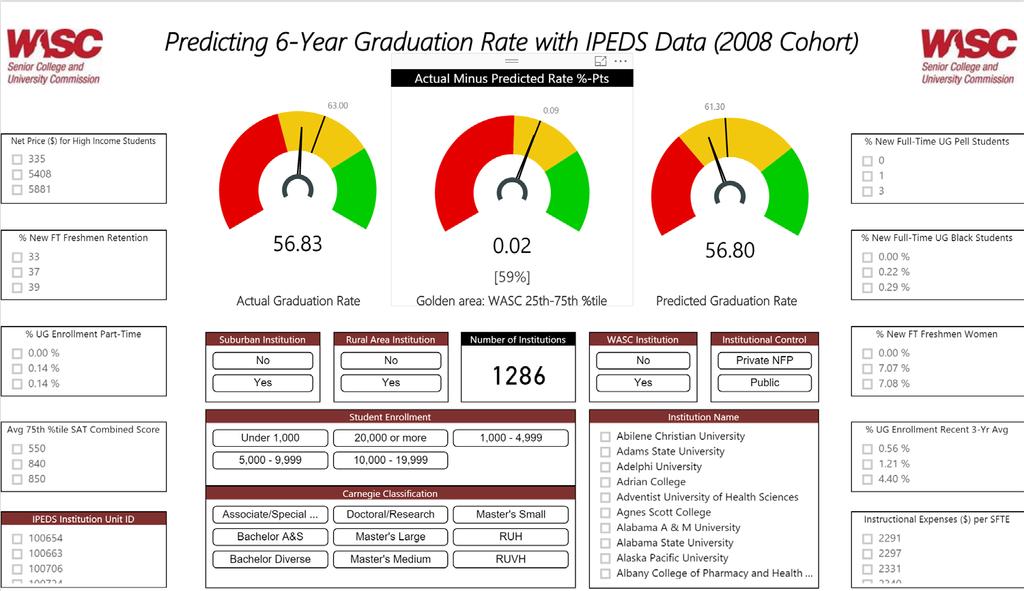
4 Purpose of Study Demonstrate online interactive reports to predict institutional retention and graduation rates. Estimate predicted rates with IPEDS and WSCUC GRDreported data. Show interactive reports for institutional comparisons and benchmarking. Show what if scenarios associated with changes in key estimation inputs. Highlight institutional characteristics associated with changes in variation between IPEDS and AGR rates.
5 Relevant Previous Literature Pike, G.R., Graunke, S.R. (2015). Examining the effects of institutional and cohort characteristics on retention rates. Research in Higher Education. Astin, A. W. (1993). What matters in college: Four critical years revisited.. Astin, A. W. (1997). How good is your institution s retention rate? Research in Higher Education. Gansmer-Topf, A. M., & Schuh, J. H. (2006). Institutional selectivity and institutional expenditures: Examining organizational factors that contribute to retention and graduation. Research in Higher Education. Herzog, S. (2005). Measuring determinants of student return vs. dropout/stopout vs. transfer: A first-to-second year analysis of new freshmen. Research in Higher Education. Hosch, B. J. (2008). Institutional and student characteristics that predict graduation and retention rates. Paper presented at the annual meeting of the North East Association for Institutional Research. Jaquette, O., & Parra, E. E. (2014). Using IPEDS for panel analyses: Core concepts, data challenges, and empirical applications. In M. B. Paulsen (Ed.), Higher education: Handbook of theory and research. Pike, G. R., Hansen, M. J., & Childress, J. E. (2014). The influences of students pre-college characteristics, high school experiences, college expectations, and initial enrollment characteristics on degree attainment. Journal of College Student Retention. Ryan, J. F. (2004). The relationship between institutional expenditures and degree attainment at baccalaureate colleges. Research in Higher Education. Webber, D. A., & Ehrenberg, R. G. (2010). Do expenditures other than instruction affect graduation and persistence rates in American higher education? (Working Paper 121). Cornell University Higher Education Research Institute.
6 Data Sources and Data Elements Sources IPEDS WSCUC GRD Institution cohorts New full-time first-year students Retention cohort: AY Graduation cohort: AY Absolute Graduation Rate (AGR): AY Institutional data elements (predictors) Demographics Selectivity Enrollment Financial aid Finances Student-faculty ratio
 No completely online campuses 1,719 1,719 Final release data used; retrieved 10/26/2016")
7 Institution Selection in Data Center EZ-Group Selection 1) Total IPEDS First Look Universe, 7,252 3) Has full-time undergraduates, 1,725 2) US, Public/Private not-for-profit four-year above, 1,814 4) No completely online campuses 1,719 1,719 Final release data used; retrieved 10/26/2016
 Graduation Rate (2008 IPEDS) (2014 WSCUC) Resulted in retrieval of >250 IPEDS")
8 Variable Selection Framework Demographics Institutional Characteristics Selectivity/ Student Success Enrollment Financial Aid Finances Student-faculty Ratio Retention Rates (2012 cohort) Graduation Rate (2008 IPEDS) (2014 WSCUC) Resulted in retrieval of >250 IPEDS variables
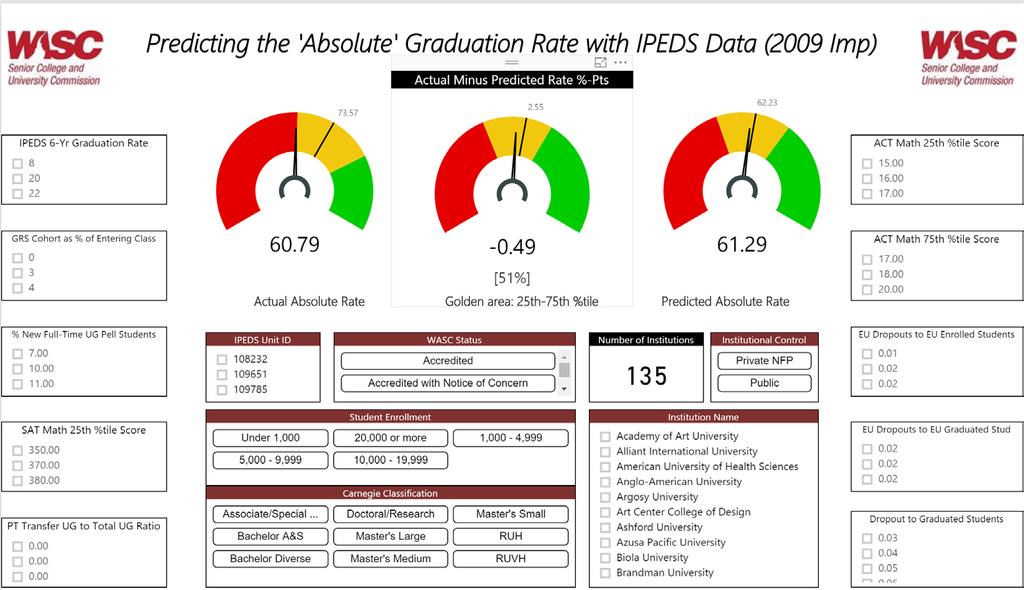
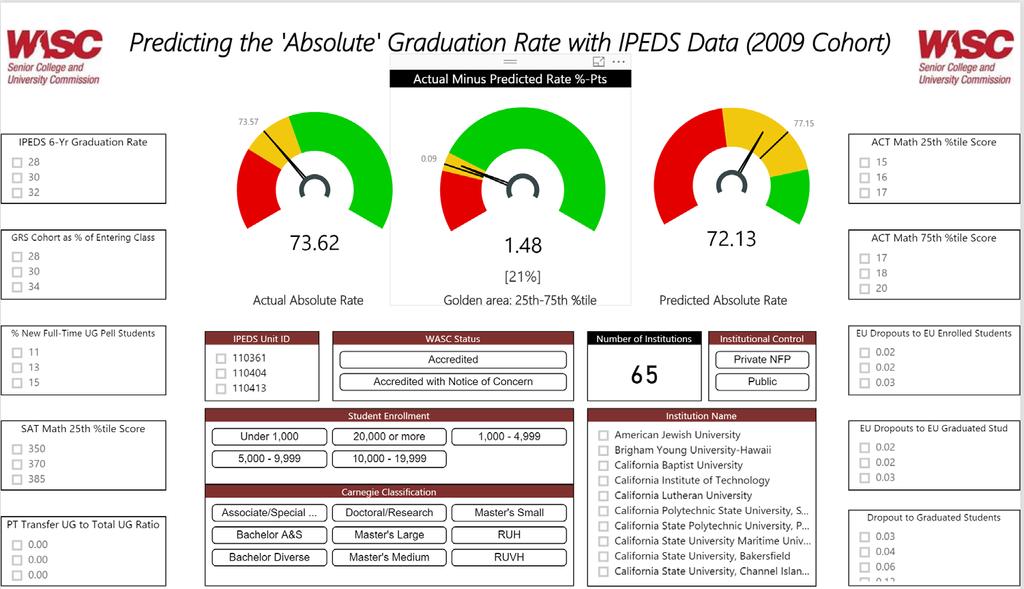
9 The URR and AGR Rates Unit redemption rate (URR) Approximation of proportion of institutional credits completed (all UG students) that lead to a UG degree (all UG degree recipients) for AY Absolute graduation rate Adjusts IPEDS-reported rate by average credits of dropouts to average credits of degree recipients (weighted by time)
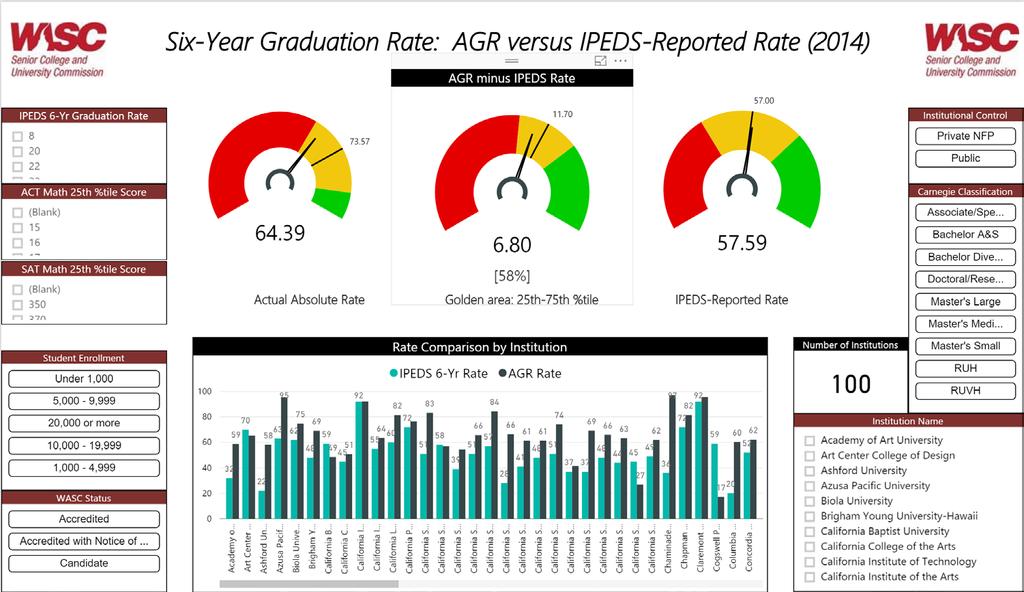
10 IPEDS versus URR and AGR Rates Predicting URR and AGR rates Model estimation with IPEDS data Model estimation with IPEDS and WASCrequested member institution data Identifying key factors associated with graduation-rate metrics Compare factor set for IPEDS rate versus AGR
11 A Framework for GRD Prediction Institutional Characteristics WSCUC Data Total/Graduated headcount, credits & Dropout headcount, credits IPEDS Data Academic Preparation Socio-demographics Financial aid Institution type Absolute Graduation Rate (AGR)
12 Key Predictors for IPEDS Retention Rate Prediction Predictors t Sig. Six-year graduation rate *** Percent of full-time first-time Asian 8.00 *** SAT Math and Reading 75th percentile avg *** Percent of full-time first-time students awarded federal grants *** Percent of first-time undergraduates out-of-state *** Student-to-faculty ratio 3.15 ** Rural institution ** Adjusted R 2 = 0.75
13 Key Predictors for IPEDS Graduation Rate Prediction Predictors t Sig. First-time full-time freshmen retention rate (2009 cohort) *** Percent of full-time first-time students ages ( avg.) *** Average net price of high income students(> $110k) 8.84 *** SAT Math and Reading 75th percentile avg *** Percent first-time full-time students women 3.92 *** Percent of full-time first-time Black *** Percent first-time full-time students receiving pell grants * Adjusted R 2 = 0.88
14 Key Predictors for WSCUC Absolute Graduation Rate Prediction Predictors t Sig. Units earned by inactives to units earned by enrolled ratio (GRD) 9.03 *** Units earned by inactives to units earned by graduated ratio (GRD) *** Headcount inactives to graduated students ratio (GRD) *** ACT Math 75th percentile (IPEDS) *** Six-year graduation rate (IPEDS) 3.97 *** SAT Math 25th percentile (IPEDS) 3.85 *** Headcount part-time transfers to all undergraduates (IPEDS) ** GRS cohort as a percent of entering class (IPEDS) ** Adjusted R 2 = 0.88
15
16
17
18
19
20
21
22
23 Questions & Comments Presentation at Contact:
Access Center Assessment Report
 Access Center Assessment Report The purpose of this report is to provide a description of the demographics as well as higher education access and success of Access Center students at CSU. College access
Race, Class, and the Selective College Experience
 Race, Class, and the Selective College Experience Thomas J. Espenshade Alexandria Walton Radford Chang Young Chung Office of Population Research Princeton University December 15, 2009 1 Overview of NSCE
Strategic Plan Dashboard Results. Office of Institutional Research and Assessment
 29-21 Strategic Plan Dashboard Results Office of Institutional Research and Assessment Binghamton University Office of Institutional Research and Assessment Definitions Fall Undergraduate and Graduate
Do multi-year scholarships increase retention? Results
 Do multi-year scholarships increase retention? In the past, Boise State has mainly offered one-year scholarships to new freshmen. Recently, however, the institution moved toward offering more two and four-year
How Living Costs Undermine Net Price As An Affordability Metric
 How Living Costs Undermine Net Price As An Affordability Metric Braden J. Hosch, Ph.D. Asst. Vice President for Institutional Research, Planning & Effectiveness Association for Institutional Research Annual
NATIONAL CENTER FOR EDUCATION STATISTICS
 NATIONAL CENTER FOR EDUCATION STATISTICS Palm Desert, CA The Integrated Postsecondary Education Data System (IPEDS) is the nation s core postsecondary education data collection program. It is a single,
Data Glossary. Summa Cum Laude: the top 2% of each college's distribution of cumulative GPAs for the graduating cohort. Academic Honors (Latin Honors)
") Institutional Research and Assessment Data Glossary This document is a collection of terms and variable definitions commonly used in the universities reports. The definitions were compiled from various
Institutional Research and Assessment Data Glossary This document is a collection of terms and variable definitions commonly used in the universities reports. The definitions were compiled from various
Trends in Student Aid and Trends in College Pricing
 Trends in Student Aid and Trends in College Pricing 2012 NYSFAAA Conference Katrina Delgrosso Senior Educational Manager Agenda What is the College Board Advocacy & Policy Center? Trends in College Pricing
Educational Attainment
 A Demographic and Socio-Economic Profile of Allen County, Indiana based on the 2010 Census and the American Community Survey Educational Attainment A Review of Census Data Related to the Educational Attainment
Best Colleges Main Survey
 Best Colleges Main Survey Date submitted 5/12/216 18::56 Introduction page 1 / 146 BEST COLLEGES Data Collection U.S. News has begun collecting data for the 217 edition of Best Colleges. The U.S. News
Understanding and Interpreting the NRC s Data-Based Assessment of Research-Doctorate Programs in the United States (2010)
") Understanding and Interpreting the NRC s Data-Based Assessment of Research-Doctorate Programs in the United States (2010) Jaxk Reeves, SCC Director Kim Love-Myers, SCC Associate Director Presented at UGA
Understanding and Interpreting the NRC s Data-Based Assessment of Research-Doctorate Programs in the United States (2010) Jaxk Reeves, SCC Director Kim Love-Myers, SCC Associate Director Presented at UGA
learning collegiate assessment]
![learning collegiate assessment]](/thumbs/71/66063392.jpg "learning collegiate assessment]") [ collegiate learning assessment] INSTITUTIONAL REPORT 2005 2006 Kalamazoo College council for aid to education 215 lexington avenue floor 21 new york new york 10016-6023 p 212.217.0700 f 212.661.9766
[ collegiate learning assessment] INSTITUTIONAL REPORT 2005 2006 Kalamazoo College council for aid to education 215 lexington avenue floor 21 new york new york 10016-6023 p 212.217.0700 f 212.661.9766
NATIONAL CENTER FOR EDUCATION STATISTICS
 NATIONAL CENTER FOR EDUCATION STATISTICS The Integrated Postsecondary Education Data System (IPEDS) is the core postsecondary education data collection program for the NCES. It is a single, comprehensive
10/6/2017 UNDERGRADUATE SUCCESS SCHOLARS PROGRAM. Founded in 1969 as a graduate institution.
 UNDERGRADUATE SUCCESS SCHOLARS PROGRAM THE UNIVERSITY OF TEXAS AT DALLAS Founded in 1969 as a graduate institution. Began admitting upperclassmen in 1975 and began admitting underclassmen in 1990. 1 A
An Empirical Analysis of the Effects of Mexican American Studies Participation on Student Achievement within Tucson Unified School District
 An Empirical Analysis of the Effects of Mexican American Studies Participation on Student Achievement within Tucson Unified School District Report Submitted June 20, 2012, to Willis D. Hawley, Ph.D., Special
EDUCATIONAL ATTAINMENT
 EDUCATIONAL ATTAINMENT By 2030, at least 60 percent of Texans ages 25 to 34 will have a postsecondary credential or degree. Target: Increase the percent of Texans ages 25 to 34 with a postsecondary credential.
University-Based Induction in Low-Performing Schools: Outcomes for North Carolina New Teacher Support Program Participants in
 University-Based Induction in Low-Performing Schools: Outcomes for North Carolina New Teacher Support Program Participants in 2014-15 In this policy brief we assess levels of program participation and
Peer Influence on Academic Achievement: Mean, Variance, and Network Effects under School Choice
 Megan Andrew Cheng Wang Peer Influence on Academic Achievement: Mean, Variance, and Network Effects under School Choice Background Many states and municipalities now allow parents to choose their children
Graduation Initiative 2025 Goals San Jose State
 Graduation Initiative 2025 Goals San Jose State Metric 2025 Goal Most Recent Rate Freshman 6-Year Graduation 71% 57% Freshman 4-Year Graduation 35% 10% Transfer 2-Year Graduation 36% 24% Transfer 4-Year
Updated: December Educational Attainment
 Updated: Educational Attainment Among 25- to 29-year olds, the proportions who have attained a high school education, some college, or a bachelor s degree are all rising, according to longterm trends.
UDW+ Student Data Dictionary Version 1.7 Program Services Office & Decision Support Group
 UDW+ Student Data Dictionary Version 1.7 Program Services Office & Decision Support Group 1 Table of Contents Subject Areas... 3 SIS - Term Registration... 5 SIS - Class Enrollment... 12 SIS - Degrees...
https://secure.aacte.org/apps/peds/print_all_forms.php?view=report&prin...
 1 of 35 4/25/2012 9:56 AM A» 2011 PEDS» Institutional Data inst id: 3510 Institutional Data A_1 Institutional Information This information will be used in all official references to your institution. Institution
Iowa School District Profiles. Le Mars
 Iowa School District Profiles Overview This profile describes enrollment trends, student performance, income levels, population, and other characteristics of the public school district. The report utilizes
PUBLIC INFORMATION POLICY
 CALIFORNIA STATE POLYTECHNIC UNIVERSITY, POMONA Landscape Architecture College of Environmental Design PUBLIC INFORMATION POLICY Landscape Architecture Accreditation Board (LAAB) accredited programs are
International Perspectives on Retention and Persistence
 Walden University ScholarWorks Office of Institutional Research and Assessment Publications Academic and Administrative Units 6-2014 International Perspectives on Retention and Persistence Gary J. Burkholder
LIM College New York, NY
 C O L L E G E P R O F I L E - O V E R V I E W LIM College New York, NY The Laboratory Institute of Merchandising, founded in 1939, is a private institute. Its facilities are located in Manhattan. Web Site
A Decision Tree Analysis of the Transfer Student Emma Gunu, MS Research Analyst Robert M Roe, PhD Executive Director of Institutional Research and
 A Decision Tree Analysis of the Transfer Student Emma Gunu, MS Research Analyst Robert M Roe, PhD Executive Director of Institutional Research and Planning Overview Motivation for Analyses Analyses and
Evaluation of Teach For America:
 EA15-536-2 Evaluation of Teach For America: 2014-2015 Department of Evaluation and Assessment Mike Miles Superintendent of Schools This page is intentionally left blank. ii Evaluation of Teach For America:
National Collegiate Retention and. Persistence-to-Degree Rates
 National Collegiate Retention and Persistence-to-Degree Rates Since 1983, ACT has collected a comprehensive database of first-to-second-year retention rates and persistence-to-degree rates. These rates
Financial aid: Degree-seeking undergraduates, FY15-16 CU-Boulder Office of Data Analytics, Institutional Research March 2017
 CU-Boulder financial aid, degree-seeking undergraduates, FY15-16 Page 1 Financial aid: Degree-seeking undergraduates, FY15-16 CU-Boulder Office of Data Analytics, Institutional Research March 2017 Contents
Enrollment Trends. Past, Present, and. Future. Presentation Topics. NCCC enrollment down from peak levels
 Presentation Topics 1. Enrollment Trends 2. Attainment Trends Past, Present, and Future Challenges & Opportunities for NC Community Colleges August 17, 217 Rebecca Tippett Director, Carolina Demography
Validation Requirements and Error Codes for Submitting Common Completion Metrics
 Validation Requirements and s for Submitting Common Completion s March 2015 Overview To ensure accurate reporting and quality data, Complete College America is committed to helping data submitters ensure
Annual Report to the Public. Dr. Greg Murry, Superintendent
 Annual Report to the Public Dr. Greg Murry, Superintendent 1 Conway Board of Education Ms. Susan McNabb Mr. Bill Clements Mr. Chuck Shipp Mr. Carl Barger Dr. Adam Lamey Dr. Quentin Washispack Mr. Andre
Exploring Predicted Vs. Actual First to-second Year Retention Rates: A Study of Evangelical Lutheran Church in America Colleges
 Loyola University Chicago Loyola ecommons Dissertations Theses and Dissertations 2013 Exploring Predicted Vs. Actual First to-second Year Retention Rates: A Study of Evangelical Lutheran Church in America
Council on Postsecondary Education Funding Model for the Public Universities (Excluding KSU) Bachelor's Degrees
 Bachelor's Degrees") Bachelor's Degrees Institution 2013-14 2014-15 2015-16 UK 3,988 4,238 4,540 UofL 2,821 2,832 2,705 EKU 2,508 2,532 2,559 MoSU 1,144 1,166 1,306 MuSU 1,469 1,512 1,696 NKU 2,143 2,214 2,196 WKU 2,751 2,704
Bachelor's Degrees Institution 2013-14 2014-15 2015-16 UK 3,988 4,238 4,540 UofL 2,821 2,832 2,705 EKU 2,508 2,532 2,559 MoSU 1,144 1,166 1,306 MuSU 1,469 1,512 1,696 NKU 2,143 2,214 2,196 WKU 2,751 2,704
MAINE 2011 For a strong economy, the skills gap must be closed.
 For a strong economy, the skills gap must be closed. 62% 36% 26% By 2020, jobs requiring a career certificate or college degree Skills gap Too few students make it through college. MEMBER Maine adults
Hokulani Elementary School
 Hokulani Elementary Code: 109 Status and Improvement Report Year -11 Contents Focus On Standards Grades K-5 This Status and Improvement Report has been prepared as part of the Department's education accountability
Frank Phillips College. Accountability Report
 Frank Phillips College Accountability Report January 2016 Accountability System, January 2016 1 of 22 Participation - Key Measures Enrollment 1. Fall Headcount (Unduplicated) Fall 2000 Fall 2014 Fall 2015
Volunteer State Community College Strategic Plan,
 Volunteer State Community College Strategic Plan, 2005-2010 Mission: Volunteer State Community College is a public, comprehensive community college offering associate degrees, certificates, continuing
The Impact of Honors Programs on Undergraduate Academic Performance, Retention, and Graduation
 University of Nebraska - Lincoln DigitalCommons@University of Nebraska - Lincoln Journal of the National Collegiate Honors Council - -Online Archive National Collegiate Honors Council Fall 2004 The Impact
Growth of empowerment in career science teachers: Implications for professional development
 Growth of empowerment in career science teachers: Implications for professional development Presented at the International Conference of the Association for Science Teacher Education (ASTE) in Hartford,
CAMPUS PROFILE MEET OUR STUDENTS UNDERGRADUATE ADMISSIONS. The average age of undergraduates is 21; 78% are 22 years or younger.
 CAMPUS PROFILE MEET OUR STUDENTS Freshmen are defined here as all domestic students entering in fall quarter from high school. These statistics include information drawn from records available at UC Davis.
How Do Colleges Respond to Accountability Pressures? Examining the Relationship between Cohort Default Rates and College Pricing
 How Do Colleges Respond to Accountability Pressures? Examining the Relationship between Cohort Default Rates and College Pricing Robert Kelchen 1 Assistant Professor, Department of Education Leadership,
Trends in College Pricing
 Trends in College Pricing 2009 T R E N D S I N H I G H E R E D U C A T I O N S E R I E S T R E N D S I N H I G H E R E D U C A T I O N S E R I E S Highlights Published Tuition and Fee and Room and Board
BARUCH RANKINGS: *Named Standout Institution by the
 THE BARUCH VALUE BARUCH RANKINGS: *#1 in CollegeNET s annual Social Mobility Index (out of over 900 colleges) for a second year in a row. *Named Standout Institution by the Baruch Background Baruch College
Review of Student Assessment Data
 Reading First in Massachusetts Review of Student Assessment Data Presented Online April 13, 2009 Jennifer R. Gordon, M.P.P. Research Manager Questions Addressed Today Have student assessment results in
Redirected Inbound Call Sampling An Example of Fit for Purpose Non-probability Sample Design
 Redirected Inbound Call Sampling An Example of Fit for Purpose Non-probability Sample Design Burton Levine Karol Krotki NISS/WSS Workshop on Inference from Nonprobability Samples September 25, 2017 RTI
ACCESS TO SUCCESS IN AMERICA: Where are we? What Can We Learn from Colleges on the Performance Frontier?
 ACCESS TO SUCCESS IN AMERICA: Where are we? What Can We Learn from Colleges on the Performance Frontier? America: Two Powerful Stories Maricopa Community Colleges Student Success Conference Phoenix, AZ
Institution-Set Standards: CTE Job Placement Resources. February 17, 2016 Danielle Pearson, Institutional Research
 Institution-Set Standards: CTE Job Placement Resources February 17, 2016 Danielle Pearson, Institutional Research Standard 1.B.3 states: The institution establishes institution-set standards for student
CHAPTER 4: REIMBURSEMENT STRATEGIES 24
 CHAPTER 4: REIMBURSEMENT STRATEGIES 24 INTRODUCTION Once state level policymakers have decided to implement and pay for CSR, one issue they face is simply how to calculate the reimbursements to districts
The Diversity of STEM Majors and a Strategy for Improved STEM Retention
 2010 The Diversity of STEM Majors and a Strategy for Improved STEM Retention Cindy P. Veenstra, Ph.D. 1 3/12/2010 A discussion of the definition of STEM for college majors, a summary of interest in the
Update Peer and Aspirant Institutions
 Update Peer and Aspirant Institutions Prepared for Southern University at Shreveport January 2015 In the following report, Hanover Research describes the methodology used to identify Southern University
The Relationship Between Poverty and Achievement in Maine Public Schools and a Path Forward
 The Relationship Between Poverty and Achievement in Maine Public Schools and a Path Forward Peer Learning Session MELMAC Education Foundation Dr. David L. Silvernail Director Applied Research, and Evaluation
Facts and Figures Office of Institutional Research and Planning
 Facts and Figures 2008-2009 Office of Institutional Research and Planning Office of Institutional Research Fall 2009 Facts at a Glance Credit Headcount Enrollments Headcount Ethnicity Headcount Percent
Miami-Dade County Public Schools
 ENGLISH LANGUAGE LEARNERS AND THEIR ACADEMIC PROGRESS: 2010-2011 Author: Aleksandr Shneyderman, Ed.D. January 2012 Research Services Office of Assessment, Research, and Data Analysis 1450 NE Second Avenue,
2015 High School Results: Summary Data (Part I)
") 1 2015 High School Results: Summary Data (Part I) October 27, 2015 Dr. Gregory E. Thornton CEO, Baltimore City Public Schools Theresa D. Jones Chief Achievement and Accountability Officer HS Data Summary
1 2015 High School Results: Summary Data (Part I) October 27, 2015 Dr. Gregory E. Thornton CEO, Baltimore City Public Schools Theresa D. Jones Chief Achievement and Accountability Officer HS Data Summary
Albany Technical College Overview Goals Student Success and Implementation Team Conclusion Next Steps...
 ?33333 Dr. Josephine Reed-Taylor Chief Academic Officer Technical College System of Georgia 1800 Century Place, NE Atlanta, Georgia 30345-4304 December 2015 Contents Albany Technical College... 8 Overview...
File Print Created 11/17/2017 6:16 PM 1 of 10
 Success - Key Measures Graduation Rate: 4-, 5-, and 6-Year 9. First-time, full-time entering, degree-seeking, students enrolled in a minimum of 12 SCH their first fall semester who have graduated from
ABILITY SORTING AND THE IMPORTANCE OF COLLEGE QUALITY TO STUDENT ACHIEVEMENT: EVIDENCE FROM COMMUNITY COLLEGES
 ABILITY SORTING AND THE IMPORTANCE OF COLLEGE QUALITY TO STUDENT ACHIEVEMENT: EVIDENCE FROM COMMUNITY COLLEGES Kevin Stange Ford School of Public Policy University of Michigan Ann Arbor, MI 48109-3091
Bellevue University Bellevue, NE
 C O L L E G E P R O F I L E - O V E R V I E W Bellevue University Bellevue, NE Bellevue, founded in 1966, is a private university. Its campus is located in Bellevue, in the Omaha metropolitan area. Web
SUNY Downstate Medical Center Brooklyn, NY
 C O L L E G E P R O F I L E - O V E R V I E W SUNY Downstate Medical Center Brooklyn, NY SUNY Health Science Center at Brooklyn, founded in 1858, is a public, upper-division institution. Its 13-acre campus
Higher Education Six-Year Plans
 Higher Education Six-Year Plans 2018-2024 House Appropriations Committee Retreat November 15, 2017 Tony Maggio, Staff Background The Higher Education Opportunity Act of 2011 included the requirement for
OFFICE OF ENROLLMENT MANAGEMENT. Annual Report
 2014-2015 OFFICE OF ENROLLMENT MANAGEMENT Annual Report Table of Contents 2014 2015 MESSAGE FROM THE VICE PROVOST A YEAR OF RECORDS 3 Undergraduate Enrollment 6 First-Year Students MOVING FORWARD THROUGH
About the College Board. College Board Advocacy & Policy Center
 15% 10 +5 0 5 Tuition and Fees 10 Appropriations per FTE ( Excluding Federal Stimulus Funds) 15% 1980-81 1981-82 1982-83 1983-84 1984-85 1985-86 1986-87 1987-88 1988-89 1989-90 1990-91 1991-92 1992-93
University of Maine at Augusta Augusta, ME
 C O L L E G E P R O F I L E - O V E R V I E W University of Maine at Augusta Augusta, ME U Maine at Augusta, founded in 1965, is a public university. Its 165-acre campus is located in Augusta, 50 miles
Samuel Enoka Kalama Intermediate School
 Code: 420 Samuel Enoka Kalama Intermediate Status and Improvement Report Year 2014-15 Focus On Standards Grades 6-8 Contents This Status and Improvement Report has been prepared as part of the Department's
Teacher intelligence: What is it and why do we care?
 Teacher intelligence: What is it and why do we care? Andrew J McEachin Provost Fellow University of Southern California Dominic J Brewer Associate Dean for Research & Faculty Affairs Clifford H. & Betty
The Effect of Income on Educational Attainment: Evidence from State Earned Income Tax Credit Expansions
 The Effect of Income on Educational Attainment: Evidence from State Earned Income Tax Credit Expansions Katherine Michelmore Policy Analysis and Management Cornell University km459@cornell.edu September
National Collegiate Retention and Persistence to Degree Rates
 National Collegiate Retention and Persistence to Degree Rates Since 1983, ACT has collected a comprehensive database of first to second year retention rates and persistence to degree rates. These rates
Hale`iwa. Elementary School Grades K-6. School Status and Improvement Report Content. Focus On School
 Comprehensive Assessment and Accountability System Year 1999-2000 Hale`iwa Elementary Grades K-6 Focus on Description Context: Setting Student Community Process: Process: Certified Facilities Outcomes:
An Introduction to School Finance in Texas
 An Introduction to School Finance in Texas May 12, 2010 Sheryl Pace TTARA Research Foundation space@ttara.org (512) 472-8838 Texas Public Education System 1,300 school districts (#1 in the nation) 1,025
Legacy of NAACP Salary equalization suits.
 Why tests, anyway? Legacy of NAACP Salary equalization suits. If you can t beat em, test em. Boom! Legacy of teacher tests NTE PRAXIS-II Pearson Content Examinations GRE ACT SAT All are statistically significantly
EXECUTIVE SUMMARY. Online courses for credit recovery in high schools: Effectiveness and promising practices. April 2017
 EXECUTIVE SUMMARY Online courses for credit recovery in high schools: Effectiveness and promising practices April 2017 Prepared for the Nellie Mae Education Foundation by the UMass Donahue Institute 1
TRENDS IN. College Pricing
 2008 TRENDS IN College Pricing T R E N D S I N H I G H E R E D U C A T I O N S E R I E S T R E N D S I N H I G H E R E D U C A T I O N S E R I E S Highlights 2 Published Tuition and Fee and Room and Board
PROPOSAL FOR NEW UNDERGRADUATE PROGRAM. Institution Submitting Proposal. Degree Designation as on Diploma. Title of Proposed Degree Program
 PROPOSAL FOR NEW UNDERGRADUATE PROGRAM Institution Submitting Proposal Degree Designation as on Diploma Title of Proposed Degree Program EEO Status CIP Code Academic Unit (e.g. Department, Division, School)
Kenya: Age distribution and school attendance of girls aged 9-13 years. UNESCO Institute for Statistics. 20 December 2012
 1. Introduction Kenya: Age distribution and school attendance of girls aged 9-13 years UNESCO Institute for Statistics 2 December 212 This document provides an overview of the pattern of school attendance
Value of Athletics in Higher Education March Prepared by Edward J. Ray, President Oregon State University
 Materials linked from the 5/12/09 OSU Faculty Senate agenda 1. Who Participates Value of Athletics in Higher Education March 2009 Prepared by Edward J. Ray, President Oregon State University Today, more
College Pricing. Ben Johnson. April 30, Abstract. Colleges in the United States price discriminate based on student characteristics
 College Pricing Ben Johnson April 30, 2012 Abstract Colleges in the United States price discriminate based on student characteristics such as ability and income. This paper develops a model of college
Descriptive Summary of Beginning Postsecondary Students Two Years After Entry
 NATIONAL CENTER FOR EDUCATION STATISTICS Statistical Analysis Report June 994 Descriptive Summary of 989 90 Beginning Postsecondary Students Two Years After Entry Contractor Report Robert Fitzgerald Lutz
READY OR NOT? CALIFORNIA'S EARLY ASSESSMENT PROGRAM AND THE TRANSITION TO COLLEGE
 READY OR NOT? CALIFORNIA'S EARLY ASSESSMENT PROGRAM AND THE TRANSITION TO COLLEGE Michal Kurlaender University of California, Davis Policy Analysis for California Education March 16, 2012 This research
University of Wyoming Dashboard
 Dashboard 16, 12, 8, 4, Students Faculty & Staff Tuition & Fees Fall End-of-Semester Headcounts 13,922 13,929 13,638 13,551 13,717 3,74 3,72 3,59 3,419 3,661 1,182 1,29 1,129 1,132 1,56 3,1 44% Fall 215
2010 National Survey of Student Engagement University Report
 National Survey of Student Engagement University Report Office of Assessment July 2011 NSSE Survey Summary Report The National Survey of Student Engagement (NSSE) is utilized at Kansas State University,
NCEO Technical Report 27
 Home About Publications Special Topics Presentations State Policies Accommodations Bibliography Teleconferences Tools Related Sites Interpreting Trends in the Performance of Special Education Students
Creating Collaborative Partnerships: The Success Stories and Challenges
 Creating Collaborative Partnerships: The Success Stories and Challenges Community College Center of Excellence Building a World Class Workforce Through Community College Partnerships Cari Mallory National
Strategic Goals, Objectives, Strategies and Measures
 Strategic Goals, Objectives, Strategies and Measures ISU s Strategic Planning Working Group 12/16/2016 ISU s Strategic Objectives (Proposed) Goal #1: Grow Enrollment Objective: Increase new degree-seeking
ILLINOIS DISTRICT REPORT CARD
 -6-525-2- HAZEL CREST SD 52-5 HAZEL CREST SD 52-5 HAZEL CREST, ILLINOIS and federal laws require public school districts to release report cards to the public each year. 2 7 ILLINOIS DISTRICT REPORT CARD
School Competition and Efficiency with Publicly Funded Catholic Schools David Card, Martin D. Dooley, and A. Abigail Payne
 School Competition and Efficiency with Publicly Funded Catholic Schools David Card, Martin D. Dooley, and A. Abigail Payne Web Appendix See paper for references to Appendix Appendix 1: Multiple Schools
ILLINOIS DISTRICT REPORT CARD
 -6-525-2- Hazel Crest SD 52-5 Hazel Crest SD 52-5 Hazel Crest, ILLINOIS 2 8 ILLINOIS DISTRICT REPORT CARD and federal laws require public school districts to release report cards to the public each year.
2012 New England Regional Forum Boston, Massachusetts Wednesday, February 1, More Than a Test: The SAT and SAT Subject Tests
 2012 New England Regional Forum Boston, Massachusetts Wednesday, February 1, 2012 More Than a Test: The SAT and SAT Subject Tests 1 Presenters Chris Lucier Vice President for Enrollment Management, University
Education: Professional Experience: Personnel leadership and management
 Cathie Cline, Ed.D. Education: Ed.D., Higher Education, University of Arkansas at Little Rock, December 2006. Dissertation: The Influence of Faculty-Student Interaction on Graduation Rates at Rural Two-Year
Port Graham El/High. Report Card for
 School: District: Kenai Peninsula Grades: K - 12 School Enrollment: 20 Title I School? No Title 1 Program: Accreditation: Report Card for 2008-2009 A Title 1 school receives federal money in support low-achieving
Over-Age, Under-Age, and On-Time Students in Primary School, Congo, Dem. Rep.
 Primary School Net and Gross Attendance Rates, Congo, Dem. Rep. Less than two thirds of school age children in the Democratic Republic of the Congo attend primary school. Boys are not much more likely
Fruitvale Station Shopping Center > Retail
 Oakland, CA > Retail > Very rare (i.e. high barriers of entry) freeway visible, surface parked, high volume grocery anchored regional serving center. > Notable tenants include: Food Maxx, Starbucks, Office
ASCD Recommendations for the Reauthorization of No Child Left Behind
 ASCD Recommendations for the Reauthorization of No Child Left Behind The Association for Supervision and Curriculum Development (ASCD) represents 178,000 educators. Our membership is composed of teachers,
Psychometric Research Brief Office of Shared Accountability
 August 2012 Psychometric Research Brief Office of Shared Accountability Linking Measures of Academic Progress in Mathematics and Maryland School Assessment in Mathematics Huafang Zhao, Ph.D. This brief
Connecting to the Big Picture: An Orientation to GEAR UP
 Connecting to the Big Picture: An Orientation to GEAR UP About the National Council for Community and Education Partnerships (NCCEP) Our mission is to build the capacity of communities to ensure that underserved
Research Update. Educational Migration and Non-return in Northern Ireland May 2008
 Research Update Educational Migration and Non-return in Northern Ireland May 2008 The Equality Commission for Northern Ireland (hereafter the Commission ) in 2007 contracted the Employment Research Institute
The Art and Science of Predicting Enrollment
 The Art and Science of Predicting Enrollment Ed Mills Associate Vice President for Student Affairs Enrollment and Student Support Harres Magee Enrollment Analyst Enrollment Management is both Art and Science
MEASURING GENDER EQUALITY IN EDUCATION: LESSONS FROM 43 COUNTRIES
 GIRL Center Research Brief No. 2 October 2017 MEASURING GENDER EQUALITY IN EDUCATION: LESSONS FROM 43 COUNTRIES STEPHANIE PSAKI, KATHARINE MCCARTHY, AND BARBARA S. MENSCH The Girl Innovation, Research,
Implementing an Early Warning Intervention and Monitoring System to Keep Students On Track in the Middle Grades and High School
 Implementing an Early Warning Intervention and Monitoring System to Keep Students On Track in the Middle Grades and High School National High School Center Facilitator: Joseph Harris, Ph.D. Presenters: