CHAPTER II-A INTRODUCTION TO FINDINGS: THE PROCESS OF BECOMING AN ENGINEER
|
|
|
- Hilary Williamson
- 6 years ago
- Views:
Transcription
1 CHAPTER II-A INTRODUCTION TO FINDINGS: THE PROCESS OF BECOMING AN ENGINEER In this chapter we present our conceptualization of the process that students of engineering undergo during their undergraduate years and show how our study contributes to the understanding of that process and the role that gender plays in it. We then explain how the chapters that follow shed light on this process, based on the findings of our study. As we see it, students come into the engineering program at Rowan with certain characteristics and training, which serve as their input into this process. This input includes: 1) demographic characteristics, such as sex, age, ethnicity/race, marital status); 2) socio-economic background, including parents education, occupation, and income 14 ; 3) social support for their pursuit of engineering as a major and as a career goal by significant others (e.g., parents, siblings, friends, influential teachers) and wider societal attitudes about the suitability of people like them (e.g., women or men) being an engineer; 4) exposure to role models which can reinforce their expectations to succeed in the major and in the career as an engineer; 14 and/or their own, depending on their age and marital status. IIA-68
2 5) pre-college academic preparation, including both formal high school instruction in science and math and extra-curricular activity in these fields; 6) initial self-confidence that they belong in engineering or can see themselves as an engineer, and that they belong in college and can see themselves succeeding in college. Once they have entered the undergraduate engineering program, and during their time in it, students are exposed to and presumably influenced by the program and school they are in and to which they react. Such influences include: 1) the curriculum (such as the extent of laboratory work and interdisciplinary emphases): 2) the pedagogy (such as the extent of group work): 3) the administration of the program: 4) the interpersonal climate with faculty and peers; 5) opportunities for extra-curricular activities both on and off-campus, both during the academic year and in the summer. The student s input into the process predisposes them for their orientation to themselves as a student, as an engineering student in particular, and themselves as an engineer in terms of the long-term career, and thus affects their experience of the program and its surrounding characteristics. The interaction of their input factors with the school influences results in engineering outcomes at every stage of the program as well as engineering outcomes at the end of the program. During the undergraduate program, these outcomes include such factors as IIA-69
3 1) engineering self-confidence, which may change from the initial engineering self-confidence: 2) satisfaction with the program and interpersonal climate during the course of the program: 3) academic performance; 4) retention at each level of the program. Outcomes at program s end include: 1) graduation (or early exit from the program, either for another major, another college, or dropping out altogether); 2) continuation in graduate studies (in engineering), or 3) employment in the field; 4) engineering self-confidence that they belong in the career and will stay in it. Each year students go through another cycle of this process, with the outcomes of the previous year(s) in the program serving as input factors which interact with student s input characteristics (family background, high school background, and initial engineering self-confidence) and the institutional factors of program and interpersonal climate to produce year-end outcomes of satisfaction, academic performance, and retention in the program. These cycles continue until the student reaches the end of the undergraduate program. For the majority of the students (as we show below), the final stage of the undergraduate process is reached at graduation, usually within 4-6 years of beginning the IIA-70
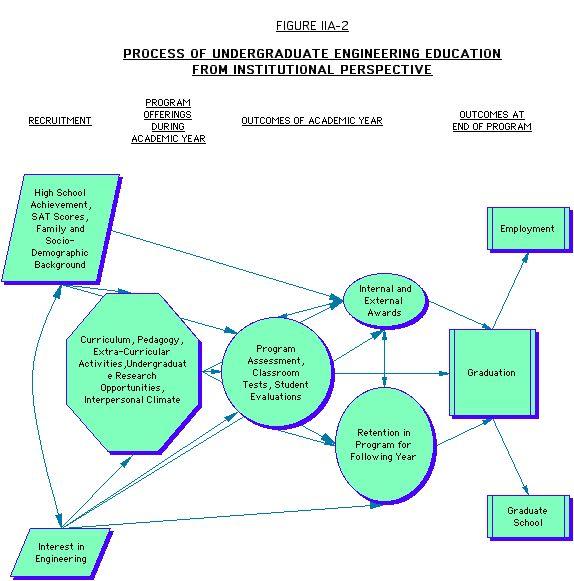
4 program. Other students may opt to terminate the program before graduation, either changing major or college or dropping out altogether. 15 Graduation can be followed by graduate school (either in engineering or another field) or employment (either in engineering or another field) (or neither). The components and the sequence suggested in this process are represented in Figure IIA-1. It shows how the student comes into Rowan with an initial input of background factors and engineering self-confidence, which interacts with their first-year experience expressed as involvement in extra-curricular activities and academic performance-- to produce engineering self-confidence at the year s end, satisfaction with the program, and retention for the second year. These outcomes at the end of the first year form the basis for the student s experience in the second and subsequent years, until the student reaches the end of the program (or, exits earlier). This model can also be seen from the institution s point of view, where recruitment targets students with certain characteristics (e.g., a high SAT score, demonstrated interest in science or math or engineering). Students are offered a particular curriculum (at Rowan, for example, the unique engineering clinic), extra-curricular activities (including undergraduate research opportunities, internships), and a certain type of interpersonal climate is fostered (at Rowan, for example, personal faculty-student relations are fostered). The outcomes of each semester are assessed through a variety of 15 This input-environment-outcome research model is similar to that employed by Astin (1991, 1993) and Sax (1994, 1996, 2001), which they have used to analyze the impact of various environments and institutional experiences on individual outcomes (after controlling for input differences among individuals). Ross (1994) employed a similar conceptual model in her dissertation on undergraduate women in engineering. Neither, however, articulated the longitudinal nature of the current model. IIA-71
5 measures, including (but not limited to) instructor-driven classroom tests and assignments, and student evaluations. Sometimes student achievement during the academic year results in internal awards (such as making the Dean s List) or external awards, funding a student s future education or other expenses. One of the measures of a program s success from the institution s point of view is how many students continue on for another year of the program. Like students, institutions assess the final outcomes by graduation rates, percent employed who sought jobs, percent placed in graduate school. The present study collected data on much of this process as students experience it, following a cycle of one year for students at various stages of the undergraduate program. Additional data collection has continued beyond the scope of the present study in order to follow cohorts of students as they progress through the course of the entire program. Once this data collection process is complete, the full model will be applied and analyzed. This report presents the results obtained for main elements of the process during the academic year The general chart presented (Figure IIA-1) serves as a guideline for the presentation of the results and the assumed interrelationships between the various components of the study. As each component of the model is introduced, some discussion of its importance and role in the process is included. We have already described the population of Rowan engineering students in terms of their demographic characteristics, family socio-economic background and pre-college math and science background. In the following chapters, we first describe the initial engineering self-confidence students bring with them to Rowan, and the engineering self- IIA-72
6 confidence at the beginning of each level of the program (Chapter II-B). We show how this self-confidence is interrelated with the background characteristics of the students. Chapter II-C shows how these input factors of background and engineering selfconfidence are related to the student s engineering behavior and academic performance over the course of the academic year. Chapter II-D shows how engineering selfconfidence changes over the course of the academic year, and how this change is related to the student s input into the program, and their engineering behavior and performance over the course of the year. Chapter II-E analyzes the students satisfaction with the various aspects of the engineering program and interpersonal climate at the end of the academic year and how these various kinds of satisfaction vary for students with different input, engineering self-confidence, and engineering behavior and performance. We also discuss how satisfaction with various aspects of the engineering program are related to changes in engineering self-confidence over the academic year. Chapter II-F looks at the outcome of retention throughout the program and graduation, and relates them to the input factors of family and high school background, engineering behavior and academic performance, engineering self-confidence and its change over the course of the year, and satisfaction with the Rowan program and interpersonal climate. As we focus on each of these components of the process of the undergraduate preparation for engineering (academic performance and engineering activities during the year, self-confidence, satisfaction and retention) we pay special attention to gender differences and how they are interact with the impact of background factors and engineering self-confidence. IIA-73
7 Our interest on gender differences in experiencing the undergraduate program at Rowan led us also to ask the students what kind of problems they perceived women to have in engineering, and these perceptions are the focus of Chapter II-G. In Chapter II-H, we put the Rowan findings into somewhat broader context by introducing comparisons to other engineering populations where similar questions were asked of the students. Finally, we draw conclusions about the Rowan program and make suggestions for further application and study (Chapter III). IIA-74
8 FIGURE IIA-1 PROCESS OF UNDERGRADUATE ENGINEERING EDUCATION STUDENT INPUT ACADEMIC YEAR EXPERIENCE OUTCOMES OF ACADEMIC YEAR OUTCOMES AT END OF PROGRAM Family and Socio- Demographic Background, High School Background Satisfaction with Engineering Program and Interpersonal Climate Employment Engineering Behavior (Activities and Academic Performance) Engineering Self- Confidence Graduation Retention in Program Initial Engineering Self- Confidence Graduate School IIA-75
9 IIA-76
10 CHAPTER II-B THE RELATIONSHIP BETWEEN ENGINEERING SELF-CONFIDENCE AND BACKGROUND FACTORS In this chapter we focus on the interrelationship between the students engineering self-confidence and their background characteristics. We begin by presenting the measure of engineering self-confidence developed in this study. We then show the relationship between this engineering self-confidence and background characteristics of the first-year students, and then show how the relationship changes with level in the program. THE MEASUREMENT OF ENGINEERING SELF-CONFIDENCE Self-confidence in engineering was measured by about 20 questions for which the students rated their self-confidence in a number of engineering-related areas, including such indicators as how confident they were that engineering was the right major for them, how confident they were in their academic abilities generally, how competent they were in skills required for their major. Indicators were factor analyzed. The analysis showed that these indicators contained four factors, thus reducing the number of indicators into four main indices that were used to reflect the main aspects of engineering selfconfidence. 16 The first factor (CONF STAY ENG) expresses how confident the student is that they belong in engineering and will stay with the major and the career. Indicators contributing the most to the score on this first factor were the student s agreement that: engineering is the right major for me, that they are unlikely to drop out of the program before 16 See more details about the construction of the factors in Appendix B. IIB-77
11 completion; that they are well-suited for their major and their chosen career. This is the main factor indicating engineering self-confidence (λ=20.1). The second factor (CONF ENG ABIL) reflects confidence in the students competencies or skills required in engineering. Indicators contributing the most to the second factor include: the student s agreement that they are mechanically inclined, technically inclined, and good at designing things (λ=18.1). The third factor (CONF ACAD ABIL) addressed the student s assessment of more general academic abilities required for engineering. Indicators contributing the most to this factor included the student s rating of their overall academic ability and their mathematical ability compared to other students their age (λ=15.5). The fourth factor (CONF COMM SKILL) expressed the student s self-confidence in their communications abilities (e.g., writing, speaking), skills needed for presentations in many of their classes as well as for more informal interpersonal interaction, but again less specific to engineering than the first two factors (λ=14.0). For much of the analysis, we concentrate on the first or the first two factors, as they express the more important aspects of engineering self-confidence for the students. As standardized factor scores, the mean score for each factor is 0 for the whole population of respondents (all students). The scores ranged between 5 and +3. The higher the engineering self-confidence (on any of the factors), the higher the factor score. ENGINEERING SELF-CONFIDENCE AS STUDENTS ENTER ROWAN We begin by focusing on first year students. Students enter Rowan with some uncertainty that they belong in engineering. Their mean scores on the first engineering self-confidence factor are (Table IIB-1). As an example of the individual indicators IIB-78
12 making up this factor, while 22.4% of the first-year students strongly agree they are well-suited for their choice of college major, nearly 20% are unsure or disagree with this statement; while 30.8% strongly agree that Engineering is the right major for me, 37.5% are unsure or disagree with the statement. With respect to the most important of the factors of engineering self-confidence, males enter with more self-confidence that they belong in engineering and that they will stay with the major and the career (Table IIB-1). Their mean score on this factor is significantly higher than that of the female students, and their answers to the individual indicators reflect this same gender gap. Males express more confidence that engineering is the right major for them, that they are well-suited for the major and the career, and they are very unlikely to drop out before finishing the engineering degree. TABLE IIB-1 ENGINEERING SELF-CONFIDENCE OF FIRST-YEAR STUDENTS BY SEX AND YEAR IN PROGRAM Self-Confidence Factor (Mean Scores on Self-Confidence Factors) First-Year Males First-Year Females Total First- Year Students Students at All Levels CONF ENG STAY CONF ENG ABIL CONF ACAD ABIL CONF COMM SKILL (n) (79) (20) (99) (324) As to the second factor, first-year students enter with confidence in their engineering abilities that is close to the mean for all students. Again, however, males IIB-79
13 enter with significantly more confidence in their engineering abilities than do females, reflecting that a higher proportion of the males than females enter with confidence that they are mechanically inclined, technically inclined, and good at designing things. While some have proposed that the reason the female students have less engineering self-confidence than the male students is that perhaps females simply express less selfconfidence in general than male students, the results for the third self-confidence factor suggest this is not the case. Female students enter with higher self-confidence in their overall academic ability than do entering male students. As an example of an individual item contributing to this factor, 28.6% of the entering women rated themselves in the highest 10% of academic ability compared to other students their age, while only 16.5% of the entering men did likewise. Similarly, entering females have more self-confidence in the communication skills than do entering males, reflecting their self-confidence in their speaking, writing, and more general communication skills. Perhaps the social norms about women excelling academically and in terms of communication are more supportive of women s efforts in these areas than in the more non-traditional pursuit of engineering. ENGINEERING SELF-CONFIDENCE AND BACKGROUND CHARACTERISTICS STUDENTS To explore the relationship between background characteristics and self-confidence, we looked at the relationship between family background, high school background, and engineering self-confidence. We concentrated on the first factor, as it was the most important expression of engineering self-confidence. We used multiple regression analysis, with the first self-confidence factor, confidence about staying in engineering IIB-80
14 (CONF STAY ENG) as the dependent variable. The independent variables were: family background characteristics, including: mother s and father s education, and the prestige score for father s occupation 17, as indicators of the family s socio-economic status and familiarity with the college setting; whether the respondent had siblings who attended college, as indicative of the role models that siblings set, as well as the general socioeconomic status of the family. Finally we included the index of support by family and significant others for the student s pursuit of engineering, expecting that the stronger the support the higher the student s engineering self-confidence. Our expectations were that students whose parents were more highly educated and who came from a higher social class would be more likely to consider themselves as belonging in a professional occupation like engineering and therefore have higher engineering self-confidence; and that self-confidence would be reinforced by the positive opinions of others. In terms of high school background, we included as independent variables: high school math and science grades, math and verbal SAT scores, and an index of extracurricular activities during high school which were related to math, science or engineering (EXTRA). We expected that students who had higher achievement and involvement in math and science before entering Rowan would be more likely to have self-confidence that they belonged in engineering and should stay in the field. The first regression analysis in the table ( Model 1 ) includes the first engineering self-confidence factor, CONF ENG STAY, as the dependent variable and family background characteristics as independent variables. The second analysis ( Model 2 ) 17 Since not all mothers were employed, we did not include the prestige score for the mother s occupation, as it eliminated too many of the students (in a listwise deletion). We did consider mother s employment history as a possible influence on self-confidence, especially of women, but it did not make a significant contribution to the explanation. IIB-81
15 adds high school background characteristics as independent variables. Regression analyses were performed separately for first-year students, and then for students of all levels. We separated out the first-year students represent the input students bring into Rowan, before they have been exposed to much of the program. We expected that they would show the greatest impact of background characteristics on engineering selfconfidence; more advanced students may have distanced themselves from factors outside of Rowan, especially regarding anything concerning engineering. We look at the relationship between background and engineering self-confidence for all students to see how much influence background characteristics retain on engineering self-confidence after students have been exposed to the program for a while. We go on to show the differences between males and females in this relationship. 18 The Relationship between Engineering Self-Confidence and Background Characteristics of First-Year Students Among first-year students, both family background and high school background are related to engineering self-confidence (Table IIB-2). In a multiple regression analysis, the square of the multiple correlation coefficient (R 2 ) tells us how much of the variation in the independent variable is explained by the dependent variables in the analysis. R 2 of the first model in the regression analysis, which includes only family background, thus tells us that taken together, all of the family background variables included explain 17.1% of the variation in initial engineering self-confidence (R 2 =.171). The most important effect of family background for first-year students is support by significant others for the student s pursuit of engineering (the regression coefficient significant at p<.05). Mother s education is also significantly related to engineering self-confidence; however, 18 There were not enough cases among the first-year students to separate out males and females for a meaningful analysis. IIB-82
16 contrary to our expectations, it is an inverse relationship: the higher the mother s education, the lower the self-confidence of the student that they will stay in engineering. High school background adds 15.2% to the variance explained in first-year engineering self-confidence (R 2 increases from.171 in the first model to.323 in the second model). High school math grades, math SAT scores and the extra-curricular math and science activities the student engaged in during high school all have significant positive relationships with the first year student s confidence that they belong and will stay in engineering. IIB-83
17 TABLE IIB-2 MULTIPLE REGRESSION ANALYSIS WITH ENTERING ENGINEERING SELF- CONFIDENCE FACTOR (CONF STAY ENG) AS DEPENDENT VARIABLE, AND FAMILY BACKGROUND, AND HIGH SCHOOL BACKGROUND AS INDEPENDENT VARIABLES FOR FIRST-YEAR STUDENTS, Unstandardized Regression Coefficients B s (Standardized Regression Coefficients ß s - in parentheses) Independent Variable Model 1 Model 2 Father's Education (.128) (.050) Mother's Education (-.259)* (-.274)* Prestige of Father s Occupation (-.034) (-.020) Siblings in college (.028)* (.036) Support Index (.309)* (.255)* H.S. science grades (-.071) H.S.math grades.355 (.221) Verbal SAT score.011 (.071) Math SAT score.044 (.257)* EXTRA.125 (.190)** Multiple R R **p <.10 *p <.05 The Relationship between Engineering Self-Confidence and Background Characteristics for Students in All Years of the Program Background variables are related to engineering self-confidence for all engineering students, but not as strongly as for first-year students. The multiple correlation between background variables and engineering self-confidence for first year IIB-84
18 students is.568, and for all students is.369 (that is, about 14% of the variance in engineering self-confidence is explained by background characteristics) (Table IIB-3). However, it is only family background characteristics that have an effect on engineering self-confidence for the total group of students; while the student is distanced from their high school experience, family characteristics are current and apparently continue to have an impact on the student s engineering self-confidence. The strongest relationship between background variables and engineering self-confidence is the support the student perceives from significant others for their pursuit of engineering. The father s occupational prestige also has a significant impact on the student s self-confidence: the higher the prestige, the stronger the self-confidence. 19 We expected that background factors would have less influence on students engineering self-confidence the longer they had been in engineering at Rowan. However, this expectation was not completely borne out (Table IIB-3). Background factors continue to be related to engineering self-confidence as students start their sophomore year. Family background is more important than high school background, so the effect of high school background has weakened as students distance themselves from the high school experience, but family characteristics continue to have an impact. Father s occupational prestige, education, and the support of significant others for their pursuit of engineering have significant impact on the student s self-confidence in themselves as an engineer. Among the high school factors, it is mainly the student s science grades that continue to have an impact on self-confidence. 19 It is possible that students whose father s have higher occupational prestige have more self-confidence in whatever they would like to pursue in college; here, we are only focusing on engineering self-confidence. IIB-85
19 As juniors begin the third year in the program, none of the background factors have much impact on engineering self-confidence. More than a third of these students have spent the summer in an engineering internship, others have had a job related to engineering, and their family or high school background apparently has less impact on their confidence in themselves as engineers. TABLE IIB-3 MULTIPLE REGRESSION ANALYSIS WITH ENGINEERING SELF-CONFIDENCE FACTOR (CONF STAY ENG) AS DEPENDENT VARIABLE, AND FAMILY CHARACTERISTICS AND HIGH SCHOOL BACKGROUND AS INDEPENDENT VARIABLES (for Sophomores, Juniors, and Seniors, Separately) Unstandardized Regression Coefficients B s (Standardized Regression Coefficients ß s - in parentheses) Year in Program Independent Variable TOTAL SOPHOMORES JUNIORS SENIORS Father's Education (-.127)** (-.344)* (-.153) (-.345) Mother's Education (-.114)** (.115) (-.163) (.026) Prestige of Father s Occupation.013 (.170)*.016 (.242) **.003 (.039).007 (.127) Siblings in college (.022) (.099) (.077) (-.206) Support Index (.236)* (.239)* (.057) (.250) High school science grades.035 (.022).285 (.210).197 (.116).302 (.212) High school math grades.167 (.108).526 (.362)*.149 (.096).019 (.017) Verbal SAT score (.055) (.152) (.029) (.126) Math SAT score (.032) (-.113) (-.149) (-.010) EXTRA (.083) (.134) (-.092) (.309) Multiple R R *p<.05 **p<.10 IIB-86
20 However, the importance of background factors, especially family background, returns as students begin their senior year, and begin to face the end of the program and their projected entry into employment or graduate school. Comparing the unstandardized regression coefficients shows that family support again becomes important to these students engineering self-confidence, as does father s education. High school math grades and their participation in extra-curricular activities in high school are also related to their self-confidence: perhaps these are indicative of their academic ability, or their inclination to be involved in enrichment activities, as we shall consider below. In summary, students family and high school background affect their engineering self-confidence to a greater degree as they enter Rowan in the first year than after they have been at Rowan for two or three years. Of particular impact on first-year students engineering self-confidence is the extent of support they receive for their pursuit of engineering from significant others, their high school math grades and their extracurricular high school activities in math and science. The effect of family and high school background seem to diminish until students reach their senior year, when factors outside of Rowan appear to regain importance in how the students see themselves as engineers. As we will see below, female students seem to be particularly affected negatively by such outside influences at the senior level. IIB-87
21 GENDER DIFFERENCES IN THE IMPACT OF BACKGROUND CHARACTERISTICS ON ENGINEERING SELF-CONFIDENCE We suspected that background characteristics might have a different relationship with the engineering self-confidence of men and women, as suggested in the literature and because of the interaction of gender with the high school background factors shown above. Therefore we performed regression analyses for males and females separately, which we will discuss below (Table IIB-4). Background characteristics are more related to females engineering selfconfidence than to males. Only about 15% of the variance in male engineering selfconfidence is related to background characteristics, while over 27% of the female engineering self-confidence is. For each of the background characteristics we measure, the relationship to engineering self-confidence is stronger for females than for males (comparing the unstandardized regression coefficients for each variable shows that the coefficients for females are larger than for males). For both males and females, the most important of these family characteristics are the positive opinions of family and significant others about the student s pursuit of engineering; however, the importance of this support is nearly double for female students than for males (the unstandardized regression coefficient, B, is.105 for males and.184 for females). In fact, this is the only family characteristic that has statistical significance for the female students. IIB-88
22 TABLE IIB-4 MULTIPLE REGRESSION ANALYSIS WITH ENGINEERING SELF-CONFIDENCE FACTOR (CONF STAY ENG) AS DEPENDENT VARIABLE, AND FAMILY CHARACTERISTICS AS INDEPENDENT VARIABLES (For Total and for Male and Female Students, Separately) Unstandardized Regression Coefficients B s (Standardized Regression Coefficients ß s - in parentheses) Unstandardized Regression Coefficients (B s) Standardized Regression Coefficients (ß s ) Independent Males Females Males Females Variable\Sex Father's Education -.073** ** Mother's Education Prestige of Father s Occupation.012* *.189 Siblings have gone to college ** Support Index.105*.184*.220*.300* High school math grades High school science.264* * grades Verbal SAT score Math SAT score EXTRA Multiple R R *p<.05 **p<.10 It is interesting to note that females tend to have higher self-confidence if they are the first in their family to go to college (i.e., they do not have siblings who went to college), while males have higher self-confidence when they are following in sibling s footsteps. Perhaps the reason for this is that the women are in a nontraditional major and aspiring to a nontraditional occupation (for females); we would need more information on the major of their siblings to determine this. IIB-89
23 In terms of high school influences on self-confidence of females, their high school math grades, and the extent to which they participated in extra-curricular math and science activities before college have the greatest impact. Males are more positively impacted by their high school science grades. Thus, while female students have lower self-confidence than males no matter what their high school math grades were, the selfconfidence of females is affected more negatively by lower math grades than is the selfconfidence of males; the result is a larger gender gap in engineering self-confidence among the students who had weak math grades in high school than among the students who enter Rowan with a stronger math background (Figure IIB-1). FIGURE IIB-1 ENGINEERING SELF-CONFIDENCE BY HIGH SCHOOL MATH GRADES BY GENDER 0.0 (Mean CONF ENG STAY scores, First Year Students) Mean ENG CONF STAY Mostl y A's Mostl y A's and B's Sex mal e fe ma le Mostl y B's and lower High School Math Grades Perhaps because of their greater sensitivity to outside factors like family background and support, female students are overall less confident than male students IIB-90
24 both that they will stay with engineering and that they have the skills and abilities to succeed in engineering (just as we saw for first-year students). 20 However, the gender differences are not statistically significant when the students assess their self-confidence in overall academic ability or their communication skills. This can be seen in Table IIB-5, which presents the mean scores on each of the self-confidence factors for all male and all female students, as well as answers to some of the representative questions having high loading on each factor. In more detail, on the first factor, males express more self-confidence that they belong in engineering and that they will stay with the major and the career (Table IIB-5). Males express more confidence that engineering is the right major for them, that they are well-suited for the major and the career, and they are very unlikely to drop out before finishing the engineering degree. This finding is not unlike that of other studies, such as the national WEPAN study (Brainard et al 1998), which found that female students have lower self-confidence that engineering is the right major for them. However, it is striking in the Rowan case, given the extent of positive indicators of women s integration into the program that we show below. On the second factor, males also express more self-confidence in their engineering abilities than do female students (Table IIB-5). Their scores on this factor are significantly higher than female students, reflecting that a higher proportion of the males strongly agree that they are mechanically inclined, technically inclined, and good at designing things. 20 The analysis is based on a comparison of factor scores of male and female students, which is allowed because statistical analysis showed that the factor structure of females and males is similar enough to compare scores of the different genders. IIB-91
25 Table IIB-5 ENGINEERING SELF-CONFIDENCE BY SEX Total Students, Fall, 2000 Self-Confidence Indicator/Factor MALES FEMALES CONF STAY ENG factor score (mean)*** Well-suited for choice of college major (% strongly agreeing) ** Likely to consider dropping out of engineering program before earning degree (% very unlikely) CONF ENG ABIL factor score (mean)**** Mechanically inclined (% strongly agreeing) ** Technically inclined (% strongly agreeing) ** CONF ACAD ABIL factor score (mean) Academic ability (% rating highest 10%) Mathematical ability (% rating highest 10%) CONF COMM SKILL factor score (mean) Communication skills (% rating highest 10%) Speaking skills (% strongly confident) * chi-square significant at p<.10 ** chi-square significant at p<.05 ***t-test significant at p<.10 ****t-test significant at p<.05 Communication skills are particularly important in the Rowan program, which emphasizes project presentation every semester and extensive written and oral presentations of their work. Like self-confidence in academic ability, gender differences on the scores for this factor of self-confidence in communication skills were not statistically significant (Table IIB-5). Males and females were equally likely to rate their communication skills in the top 10% compared to other students their age, and to be strongly confident in their speaking and writing skills. IIB-92
26 The main gender differences throughout the program, therefore, are related specifically to self-confidence that they belong in engineering and their engineering abilities, perhaps reflecting societal expectations of each gender. The magnitude of these gender differences in engineering self-confidence varies by year in the program, as we will show below in Chapter II-D. To some extent the gender differences reflect the extent to which characteristics outside the system (such as the support of significant others for their pursuit of engineering) affect engineering selfconfidence. Thus we will show that in the senior year, when background variables have as much or more impact than among first-year students, the gender gap in engineering self-confidence is as wide as it was for the first-year students. We suggest that it may be the impact of forces outside of Rowan which is responsible for the wider gender differences in engineering self-confidence: during the middle years of the program, when the students are most influenced by the program itself, gender differences in engineering self-confidence appear to be much smaller. SUMMARY AND CONCLUSIONS Engineering self-confidence is made up of a number of different aspects: confidence that the student belongs and will stay in engineering, confidence in specific engineering abilities, and more generalized academic confidence and confidence in communication abilities. The male students enter with more engineering self-confidence in terms of the first two aspects but not in terms of the more generalized academic and communication confidence. The engineering self-confidence with which students enter Rowan is related in part to both their family and high school backgrounds. In particular, in terms of family IIB-93
27 background it is the support of significant others which is related to stronger engineering self-confidence; and in terms of high school background, both high school achievement in math and science and their extra curricular activities in these areas are related to stronger engineering self-confidence. The impact of family and high school background are more important influences on engineering self-confidence in the first year than in sophomore or junior years, but in the senior year the impact of family background is again important. Female students enter Rowan with less confidence that they will stay in engineering and that they have the abilities required in engineering than do males. This gender gap in self-confidence is not generalized to all self-confidence, as women do not show less selfconfidence in their overall academic abilities or communication skills. The engineering self-confidence of women is more sensitive to their background influences than that of males, especially among the students with weaker backgrounds. Perhaps because of the greater influence of background influences on their engineering self-confidence, overall, female students have lower engineering selfconfidence than male students. It seems that the engineering self-confidence of the female students is lower when background or outside influences are stronger (the freshman and senior years). Below we will explore in more detail how engineering selfconfidence changes with time in the program. IIB-94
28 CHAPTER II-C ENGINEERING BEHAVIOR AND PERFORMANCE AND THEIR RELATIONSHIP TO INPUT CHARACTERISTICS The next step in the student s progress through engineering is their experience during the academic year. A major part of the student s experience is their academic performance in classes; there are also a number of extracurricular activities in which they can participate and which are intended to enhance their progress toward becoming an engineer. The first part of this chapter focuses on the student s academic performance, first showing how first-year students grades are related to their input of family and high school background and initial engineering self-confidence. The second part of the chapter focuses on the kinds of activities in which students are involved over the course of the academic year. After describing these activities, we show how entering characteristics affect this engineering behavior for first year students, and how background characteristics continue to affect engineering behavior for all students. We then show how initial engineering self-confidence is related to engineering behavior for first-year students, and how engineering self-confidence is related to engineering behavior for all students. Finally, we show how engineering behavior is related to academic performance, with a particular focus on how participation in the Society for Women Engineers affects the female students experiences and performance. ACADEMIC PERFORMANCE Input Characteristics and Academic Performance We begin this section by looking at the academic performance of first-year students and how it is related to their input characteristics of family and high school background and initial IIC-95
29 engineering self-confidence. We consider whether it is easier for some students to do well academically than others based on the characteristics they bring with them into Rowan. In their first semester at Rowan, the input characteristics the students bring with them into Rowan account for about 28% of the variance in the students overall grade point average (GPA) 21 and in their engineering grades specifically 22 (Table IIC-1). In a multiple regression in which fall GPA is the dependent variable, the only statistically significant effect of family background was father s occupational prestige, which reflects the student s social class as well as how professional their father s occupation was (the higher the father s occupational prestige, the higher the fall grades). Of the high school background factors, high school math grades are related significantly to the students academic achievement in the first semester. The students initial engineering self-confidence is not related to their actual academic performance in the first semester. Thus, even students who lack engineering self-confidence may perform well academically (and indeed, as we show below, women s engineering self-confidence is lower than men s, but their academic performance equals or exceeds that of men). Interestingly, father s occupational prestige has a significant relationship with overall GPA in the first semester, but not with engineering grades per se. High school math grades are significant predictors of both overall and engineering grades in the first semester, but not the spring semester. As might be expected, by the end of the first year, the input characteristics have even less relationship with academic performance, and only 12% of the variance is explained by these characteristics. None of the regression coefficients of input characteristics predicting spring 21 Fall and Spring GPA s are taken from official transcripts of the students grades. 22 Engineering GPA was self-reported and referred to the fall semester. For many of the first-year students, the only engineering class they had at this stage was engineering clinic. IIC-96
30 grades is statistically significant (Table IIC-1). The regression coefficient (B) of father s occupational prestige goes down from.019 to.010 from Fall to Spring, and the regression coefficient (B) of high school math grades go down from.262 to.188. When spring grades are predicted with fall grades added to the regression analysis, fall grades are clearly the most important predictor (statistically significant at p<.00, with an unstandardized regression coefficient of.943 and a standardized regression coefficient of.777). Therefore the input characteristics have an indirect effect on later academic achievement, but only through their effect on academic achievement in the first semester. IIC-97
31 TABLE IIC-1 MULTIPLE REGRESSION ANALYSIS OF ENGINEERING GRADES WITH FAMILY AND HIGH SCHOOL BACKGROUND CHARACTERISTICS AND INITIAL ENGINEERING SELF- CONFIDENCE AS INDEPENDENT VARIABLES, First Year Students Unstandardized Regression Coefficients (Standardized Regression Coefficients in Parentheses) Fall 2000 Engineering GPA GPA Dependent Variable Independent Variable Father s Education Mother s Education Prestige of Father s Occupation Siblings College-Educated Support Index High School Science Grades High School Math Grades Verbal SAT Score Math SAT Score High School Extra-Curricular Math/Science Activities CONF STAY ENG CONF ENG ABIL Multiple R Spring 2001 GPA (-.030) (-.116) (-.075) (-.070) (-.112).013 (.030).019 (.346)*.005 (.116).010 (.152).135 (.100).123 (.103).170 (.104) (-.098) (.079) (-.085).100 (.094).100 (.096).291 (.025).262 (.249)**.261 (.277)**.188 (.147) (.028).002 (.179) (-.025) (-.091).000 (.005) (-.129).031 (.072) (-.178).023 (.044).125 (.191).091 (.155).607 (.077) (-.156).078 (-.135) (-.009) R *p<.05 **p<.10. Relationship of Input Characteristics to Academic Performance for Students at All Levels Looking at the total group of engineering students, we see that the students input characteristics have a stronger relationship with the academic performance of females than of male students (Table IIC-2). The input characteristics explain less than 20% of the male students engineering grades in the first semester, but over half of the female students engineering grades in the same semester. Comparing the unstandardized regression coefficients IIC-98
32 shows us that the impact of both father s education and whether the student has a collegeeducated sibling have stronger impacts on females engineering grades than on males : these serve both as role models and as support for what the student is doing, and enhance the female students performance more than the males. High school math and science grades also affect the academic performance of the female students more than the males ; in particular, females with better high school science grades do better in their first semester at Rowan, while males with better math grades do better in their first semester at Rowan. While high school grades may be more indicative of academic aptitude than the actual content covered in high school, they may also be indicative of earlier interest in science for the female students, which gives them a boost in their engineering studies. The higher unstandardized regression coefficients for the female students high school grades as compared to the males suggests that the grades of female students are more strongly related to their earlier achievement than are the grades of male students. IIC-99
33 TABLE IIC-2 MULTIPLE REGRESSION ANALYSIS OF ENGINEERING GRADES WITH FAMILY AND HIGH SCHOOL BACKGROUND CHARACTERISTICS AND INITIAL ENGINEERING SELF-CONFIDENCE AS INDEPENDENT VARIABLES, Total Engineering Students, Males and Females Unstandardized Regression Coefficients (Standardized Regression Coefficients in Parentheses) Total Males Females Independent Variable Father s Education Mother s Education Prestige of Father s Occupa Siblings College-Educate Support Index High School Science Grad High School Math Grade Verbal SAT Score Math SAT Score High School Extra-Curricu Math/Science Activities *p<.05 **p<.10. CONF STAY ENG CONF ENG ABIL Multiple R -.001(-.004) (-.024).051 (.184) (-.077) (-.070) (-.195) -.000(-.016).000 (.005) (-.087).074 (.074).038 (.038).093 (.097) (-.120) (-.115) (-.131).176 (.201)*.061 (.073).695 (.677)*.145 (.179)*.199 (.263)* (-.227).001 (.133)**.001 (.084).019 (.220).001 (.116).001 (.124).000 (.081) (-.077) -.026(-.090).009 (.026).054 (.104).050 (.088).028 (.064) (-.022).003 (.006 ) (-.036) R Initial engineering self-confidence does not have a statistically significant relationship with academic performance for males or females. So females academic performance does not seem to be damaged by their weaker engineering self-confidence (which we saw in the previous chapter). Overall, female engineering students at Rowan do as well or better in terms of academic achievement than the male students (Table IIC-3). Their overall GPA is slightly higher than IIC-100
34 men s and their mean GPA in engineering courses is slightly higher than men s. A higher proportion of female students have 4.0 average GPA s in engineering, and female students were more likely to make the Dean s list than were male students. (Table IIC-3) (While not all of the gender differences are statistically significant, almost all of them show the same pattern, of females having higher academic achievement than males.) TABLE IIC-3 ACADEMIC PERFORMANCE BY YEAR IN SCHOOL AND GENDER Year in School Total First-year Sophomore Junior Senior Mean GPA, Spring 2001 (overall) Males Females * * Mean GPA (Engineering) a Males Females * % 4.0 GPA (Engineering) a Males Females 26.8* * 9.1 % Dean s List, Spring 2001 Males Females 42.9* ** a Self-reported in spring. * T-Test between the genders significant at p<.05. ** T-Test between the genders significant at p<.10. IIC-101
35 Further, the stronger academic performance of the female students holds within almost every major, as can be seen in Table IIC-4. Because of the small numbers in some of the categories, we collapsed the first-year and sophomore students into one lower division category; and the juniors and seniors into upper division. Among lower division students, the gender difference in engineering GPA is found in every major, with females having better engineering GPAs than the male students. Among upper division students in three of the majors (civil/environmental, electrical/computer, and mechanical), however the gender gap albeit small - is reversed. However, few of these gender differences are statistically significant. The conclusion is that once year in school and major are controlled, gender differences in academic performance are insignificant. This supports findings by Cerro and Duncan (2002), Felder, et. al. (1993) and Seymour & Hewitt (1997), and some of the results presented by Adelman (1998). Unlike Adelman s findings, women in electrical/computing engineering at Rowan do not perform less well academically than do men; on the contrary, among lower division students, this is one of the few statistically significant differences with women having higher GPA s than men. IIC-102
The Impact of Honors Programs on Undergraduate Academic Performance, Retention, and Graduation
 University of Nebraska - Lincoln DigitalCommons@University of Nebraska - Lincoln Journal of the National Collegiate Honors Council - -Online Archive National Collegiate Honors Council Fall 2004 The Impact
10/6/2017 UNDERGRADUATE SUCCESS SCHOLARS PROGRAM. Founded in 1969 as a graduate institution.
 UNDERGRADUATE SUCCESS SCHOLARS PROGRAM THE UNIVERSITY OF TEXAS AT DALLAS Founded in 1969 as a graduate institution. Began admitting upperclassmen in 1975 and began admitting underclassmen in 1990. 1 A
A Decision Tree Analysis of the Transfer Student Emma Gunu, MS Research Analyst Robert M Roe, PhD Executive Director of Institutional Research and
 A Decision Tree Analysis of the Transfer Student Emma Gunu, MS Research Analyst Robert M Roe, PhD Executive Director of Institutional Research and Planning Overview Motivation for Analyses Analyses and
Access Center Assessment Report
 Access Center Assessment Report The purpose of this report is to provide a description of the demographics as well as higher education access and success of Access Center students at CSU. College access
Evaluation of Teach For America:
 EA15-536-2 Evaluation of Teach For America: 2014-2015 Department of Evaluation and Assessment Mike Miles Superintendent of Schools This page is intentionally left blank. ii Evaluation of Teach For America:
1GOOD LEADERSHIP IS IMPORTANT. Principal Effectiveness and Leadership in an Era of Accountability: What Research Says
 B R I E F 8 APRIL 2010 Principal Effectiveness and Leadership in an Era of Accountability: What Research Says J e n n i f e r K i n g R i c e For decades, principals have been recognized as important contributors
Do multi-year scholarships increase retention? Results
 Do multi-year scholarships increase retention? In the past, Boise State has mainly offered one-year scholarships to new freshmen. Recently, however, the institution moved toward offering more two and four-year
Research Update. Educational Migration and Non-return in Northern Ireland May 2008
 Research Update Educational Migration and Non-return in Northern Ireland May 2008 The Equality Commission for Northern Ireland (hereafter the Commission ) in 2007 contracted the Employment Research Institute
Principal vacancies and appointments
 Principal vacancies and appointments 2009 10 Sally Robertson New Zealand Council for Educational Research NEW ZEALAND COUNCIL FOR EDUCATIONAL RESEARCH TE RŪNANGA O AOTEAROA MŌ TE RANGAHAU I TE MĀTAURANGA
PROFESSIONAL TREATMENT OF TEACHERS AND STUDENT ACADEMIC ACHIEVEMENT. James B. Chapman. Dissertation submitted to the Faculty of the Virginia
 PROFESSIONAL TREATMENT OF TEACHERS AND STUDENT ACADEMIC ACHIEVEMENT by James B. Chapman Dissertation submitted to the Faculty of the Virginia Polytechnic Institute and State University in partial fulfillment
Effective Pre-school and Primary Education 3-11 Project (EPPE 3-11)
") Effective Pre-school and Primary Education 3-11 Project (EPPE 3-11) A longitudinal study funded by the DfES (2003 2008) Exploring pupils views of primary school in Year 5 Address for correspondence: EPPSE
Effective Pre-school and Primary Education 3-11 Project (EPPE 3-11) A longitudinal study funded by the DfES (2003 2008) Exploring pupils views of primary school in Year 5 Address for correspondence: EPPSE
What effect does science club have on pupil attitudes, engagement and attainment? Dr S.J. Nolan, The Perse School, June 2014
 What effect does science club have on pupil attitudes, engagement and attainment? Introduction Dr S.J. Nolan, The Perse School, June 2014 One of the responsibilities of working in an academically selective
Student attrition at a new generation university
 CAO06288 Student attrition at a new generation university Zhongjun Cao & Roger Gabb Postcompulsory Education Centre Victoria University Abstract Student attrition is an issue for Australian higher educational
Strategic Planning for Retaining Women in Undergraduate Computing
 for Retaining Women Workbook An NCWIT Extension Services for Undergraduate Programs Resource Go to /work.extension.html or contact us at es@ncwit.org for more information. 303.735.6671 info@ncwit.org Strategic
Evaluation of a College Freshman Diversity Research Program
 Evaluation of a College Freshman Diversity Research Program Sarah Garner University of Washington, Seattle, Washington 98195 Michael J. Tremmel University of Washington, Seattle, Washington 98195 Sarah
Educational Attainment
 A Demographic and Socio-Economic Profile of Allen County, Indiana based on the 2010 Census and the American Community Survey Educational Attainment A Review of Census Data Related to the Educational Attainment
An Empirical Analysis of the Effects of Mexican American Studies Participation on Student Achievement within Tucson Unified School District
 An Empirical Analysis of the Effects of Mexican American Studies Participation on Student Achievement within Tucson Unified School District Report Submitted June 20, 2012, to Willis D. Hawley, Ph.D., Special
Undergraduates Views of K-12 Teaching as a Career Choice
 Undergraduates Views of K-12 Teaching as a Career Choice A Report Prepared for The Professional Educator Standards Board Prepared by: Ana M. Elfers Margaret L. Plecki Elise St. John Rebecca Wedel University
08-09 DATA REVIEW AND ACTION PLANS Candidate Reports
 08-09 DATA REVIEW AND ACTION PLANS Candidate Reports Data Observations Implications for Change Action for Change Admitted to TEP Only ~24% of students Recruit more secondary majors Develop recruitment
IS FINANCIAL LITERACY IMPROVED BY PARTICIPATING IN A STOCK MARKET GAME?
 21 JOURNAL FOR ECONOMIC EDUCATORS, 10(1), SUMMER 2010 IS FINANCIAL LITERACY IMPROVED BY PARTICIPATING IN A STOCK MARKET GAME? Cynthia Harter and John F.R. Harter 1 Abstract This study investigates the
OFFICE OF ENROLLMENT MANAGEMENT. Annual Report
 2014-2015 OFFICE OF ENROLLMENT MANAGEMENT Annual Report Table of Contents 2014 2015 MESSAGE FROM THE VICE PROVOST A YEAR OF RECORDS 3 Undergraduate Enrollment 6 First-Year Students MOVING FORWARD THROUGH
What is related to student retention in STEM for STEM majors? Abstract:
 What is related to student retention in STEM for STEM majors? Abstract: The purpose of this study was look at the impact of English and math courses and grades on retention in the STEM major after one
National Survey of Student Engagement Spring University of Kansas. Executive Summary
 National Survey of Student Engagement Spring 2010 University of Kansas Executive Summary Overview One thousand six hundred and twenty-one (1,621) students from the University of Kansas completed the web-based
Mathematics Program Assessment Plan
 Mathematics Program Assessment Plan Introduction This assessment plan is tentative and will continue to be refined as needed to best fit the requirements of the Board of Regent s and UAS Program Review
The Diversity of STEM Majors and a Strategy for Improved STEM Retention
 2010 The Diversity of STEM Majors and a Strategy for Improved STEM Retention Cindy P. Veenstra, Ph.D. 1 3/12/2010 A discussion of the definition of STEM for college majors, a summary of interest in the
Unequal Opportunity in Environmental Education: Environmental Education Programs and Funding at Contra Costa Secondary Schools.
 Unequal Opportunity in Environmental Education: Environmental Education Programs and Funding at Contra Costa Secondary Schools Angela Freitas Abstract Unequal opportunity in education threatens to deprive
UK Institutional Research Brief: Results of the 2012 National Survey of Student Engagement: A Comparison with Carnegie Peer Institutions
 UK Institutional Research Brief: Results of the 2012 National Survey of Student Engagement: A Comparison with Carnegie Peer Institutions November 2012 The National Survey of Student Engagement (NSSE) has
National Survey of Student Engagement
 National Survey of Student Engagement Report to the Champlain Community Authors: Michelle Miller and Ellen Zeman, Provost s Office 12/1/2007 This report supplements the formal reports provided to Champlain
FACTORS INFLUENCING POSITIVE INTERACTIONS ACROSS RACE FOR AFRICAN AMERICAN, ASIAN AMERICAN, LATINO, AND WHITE COLLEGE STUDENTS
 Research in Higher Education, Vol. 48, No. 1, February 2007 (Ó 2006) DOI: 10.1007/s11162-006-9026-3 FACTORS INFLUENCING POSITIVE INTERACTIONS ACROSS RACE FOR AFRICAN AMERICAN, ASIAN AMERICAN, LATINO, AND
U VA THE CHANGING FACE OF UVA STUDENTS: SSESSMENT. About The Study
 About The Study U VA SSESSMENT In 6, the University of Virginia Office of Institutional Assessment and Studies undertook a study to describe how first-year students have changed over the past four decades.
What Is The National Survey Of Student Engagement (NSSE)?
?") National Survey of Student Engagement (NSSE) 2000 Results for Montclair State University What Is The National Survey Of Student Engagement (NSSE)? US News and World Reports Best College Survey is due next
National Survey of Student Engagement (NSSE) 2000 Results for Montclair State University What Is The National Survey Of Student Engagement (NSSE)? US News and World Reports Best College Survey is due next
Peer Influence on Academic Achievement: Mean, Variance, and Network Effects under School Choice
 Megan Andrew Cheng Wang Peer Influence on Academic Achievement: Mean, Variance, and Network Effects under School Choice Background Many states and municipalities now allow parents to choose their children
Accessing Higher Education in Developing Countries: panel data analysis from India, Peru and Vietnam
 Accessing Higher Education in Developing Countries: panel data analysis from India, Peru and Vietnam Alan Sanchez (GRADE) y Abhijeet Singh (UCL) 12 de Agosto, 2017 Introduction Higher education in developing
College of Education & Social Services (CESS) Advising Plan April 10, 2015
 Advising Plan April 10, 2015") College of Education & Social Services (CESS) Advising Plan April 10, 2015 To provide context for understanding advising in CESS, it is important to understand the overall emphasis placed on advising in
College of Education & Social Services (CESS) Advising Plan April 10, 2015 To provide context for understanding advising in CESS, it is important to understand the overall emphasis placed on advising in
Updated: December Educational Attainment
 Updated: Educational Attainment Among 25- to 29-year olds, the proportions who have attained a high school education, some college, or a bachelor s degree are all rising, according to longterm trends.
Robert S. Unnasch, Ph.D.
 Introduction External Reviewer s Final Report Project DESERT Developing Expertise in Science Education, Research, and Technology National Science Foundation Grant #0849389 Arizona Western College November
ABILITY SORTING AND THE IMPORTANCE OF COLLEGE QUALITY TO STUDENT ACHIEVEMENT: EVIDENCE FROM COMMUNITY COLLEGES
 ABILITY SORTING AND THE IMPORTANCE OF COLLEGE QUALITY TO STUDENT ACHIEVEMENT: EVIDENCE FROM COMMUNITY COLLEGES Kevin Stange Ford School of Public Policy University of Michigan Ann Arbor, MI 48109-3091
BENCHMARK TREND COMPARISON REPORT:
 National Survey of Student Engagement (NSSE) BENCHMARK TREND COMPARISON REPORT: CARNEGIE PEER INSTITUTIONS, 2003-2011 PREPARED BY: ANGEL A. SANCHEZ, DIRECTOR KELLI PAYNE, ADMINISTRATIVE ANALYST/ SPECIALIST
American Journal of Business Education October 2009 Volume 2, Number 7
 Factors Affecting Students Grades In Principles Of Economics Orhan Kara, West Chester University, USA Fathollah Bagheri, University of North Dakota, USA Thomas Tolin, West Chester University, USA ABSTRACT
Illinois Grand Assembly - Academic Scholarship Application
 Illinois Grand Assembly - Academic Scholarship Application In this Scholarship Application, The International Order of the Rainbow for Girls in Illinois and Illinois Grand Assembly are used synonymously.
California State University, Los Angeles TRIO Upward Bound & Upward Bound Math/Science
 Application must be completed in black or blue ink only. STUDENT INFORMATION Name: Social Security # - - First Middle Last Address: Apt.# Phone: ( ) City: State: Zip Code: Date of Birth: Place of Birth:
READY OR NOT? CALIFORNIA'S EARLY ASSESSMENT PROGRAM AND THE TRANSITION TO COLLEGE
 READY OR NOT? CALIFORNIA'S EARLY ASSESSMENT PROGRAM AND THE TRANSITION TO COLLEGE Michal Kurlaender University of California, Davis Policy Analysis for California Education March 16, 2012 This research
Practices Worthy of Attention Step Up to High School Chicago Public Schools Chicago, Illinois
 Step Up to High School Chicago Public Schools Chicago, Illinois Summary of the Practice. Step Up to High School is a four-week transitional summer program for incoming ninth-graders in Chicago Public Schools.
STUDENT LEARNING ASSESSMENT REPORT
 STUDENT LEARNING ASSESSMENT REPORT PROGRAM: Sociology SUBMITTED BY: Janine DeWitt DATE: August 2016 BRIEFLY DESCRIBE WHERE AND HOW ARE DATA AND DOCUMENTS USED TO GENERATE THIS REPORT BEING STORED: The
AC : DEVELOPMENT OF AN INTRODUCTION TO INFRAS- TRUCTURE COURSE
 AC 2011-746: DEVELOPMENT OF AN INTRODUCTION TO INFRAS- TRUCTURE COURSE Matthew W Roberts, University of Wisconsin, Platteville MATTHEW ROBERTS is an Associate Professor in the Department of Civil and Environmental
ROA Technical Report. Jaap Dronkers ROA-TR-2014/1. Research Centre for Education and the Labour Market ROA
 Research Centre for Education and the Labour Market ROA Parental background, early scholastic ability, the allocation into secondary tracks and language skills at the age of 15 years in a highly differentiated
Sector Differences in Student Learning: Differences in Achievement Gains Across School Years and During the Summer
 Catholic Education: A Journal of Inquiry and Practice Volume 7 Issue 2 Article 6 July 213 Sector Differences in Student Learning: Differences in Achievement Gains Across School Years and During the Summer
Office of Institutional Effectiveness 2012 NATIONAL SURVEY OF STUDENT ENGAGEMENT (NSSE) DIVERSITY ANALYSIS BY CLASS LEVEL AND GENDER VISION
 DIVERSITY ANALYSIS BY CLASS LEVEL AND GENDER VISION") Office of Institutional Effectiveness 2012 NATIONAL SURVEY OF STUDENT ENGAGEMENT (NSSE) DIVERSITY ANALYSIS BY CLASS LEVEL AND GENDER VISION We seek to become recognized for providing bright and curious
Office of Institutional Effectiveness 2012 NATIONAL SURVEY OF STUDENT ENGAGEMENT (NSSE) DIVERSITY ANALYSIS BY CLASS LEVEL AND GENDER VISION We seek to become recognized for providing bright and curious
Greek Teachers Attitudes toward the Inclusion of Students with Special Educational Needs
 American Journal of Educational Research, 2014, Vol. 2, No. 4, 208-218 Available online at http://pubs.sciepub.com/education/2/4/6 Science and Education Publishing DOI:10.12691/education-2-4-6 Greek Teachers
Goal #1 Promote Excellence and Expand Current Graduate and Undergraduate Programs within CHHS
 Goal #1 Promote Excellence and Expand Current Graduate and Undergraduate Programs within CHHS Objectives Actions Outcome Responsibility Objective 1 Develop innovative alternative methodologies for educational
Gender and socioeconomic differences in science achievement in Australia: From SISS to TIMSS
 Gender and socioeconomic differences in science achievement in Australia: From SISS to TIMSS, Australian Council for Educational Research, thomson@acer.edu.au Abstract Gender differences in science amongst
Status of Women of Color in Science, Engineering, and Medicine
 Status of Women of Color in Science, Engineering, and Medicine The figures and tables below are based upon the latest publicly available data from AAMC, NSF, Department of Education and the US Census Bureau.
(Includes a Detailed Analysis of Responses to Overall Satisfaction and Quality of Academic Advising Items) By Steve Chatman
 By Steve Chatman") Report #202-1/01 Using Item Correlation With Global Satisfaction Within Academic Division to Reduce Questionnaire Length and to Raise the Value of Results An Analysis of Results from the 1996 UC Survey
Report #202-1/01 Using Item Correlation With Global Satisfaction Within Academic Division to Reduce Questionnaire Length and to Raise the Value of Results An Analysis of Results from the 1996 UC Survey
The Relation Between Socioeconomic Status and Academic Achievement
 Psychological Bulletin 1982, Vol. 91, No. 3, 461-481 Copyright 1982 by the American Psychological Association, Inc. 0033-2909/82/9103-0461S00.75 The Relation Between Socioeconomic Status and Academic Achievement
WHY DID THEY STAY. Sense of Belonging and Social Networks in High Ability Students
 WHY DID THEY STAY Sense of Belonging and Social Networks in High Ability Students H. Kay Banks, Ed.D. Clinical Assistant Professor Assistant Dean South Carolina Honors College University of South Carolina
AC : LOOKING AT ENGINEERING STUDENTS THROUGH A MOTIVATION/CONFIDENCE FRAMEWORK
 AC 2011-1551: LOOKING AT ENGINEERING STUDENTS THROUGH A MOTIVATION/CONFIDENCE FRAMEWORK Samantha Ruth Brunhaver, Stanford University Samantha Brunhaver is a third year graduate student at Stanford University.
National Survey of Student Engagement at UND Highlights for Students. Sue Erickson Carmen Williams Office of Institutional Research April 19, 2012
 National Survey of Student Engagement at Highlights for Students Sue Erickson Carmen Williams Office of Institutional Research April 19, 2012 April 19, 2012 Table of Contents NSSE At... 1 NSSE Benchmarks...
This Access Agreement is for only, to align with the WPSA and in light of the Browne Review.
 University of Essex Access Agreement 2011-12 The University of Essex Access Agreement has been updated in October 2010 to include new tuition fee and bursary provision for 2011 entry and account for the
JOB OUTLOOK 2018 NOVEMBER 2017 FREE TO NACE MEMBERS $52.00 NONMEMBER PRICE NATIONAL ASSOCIATION OF COLLEGES AND EMPLOYERS
 NOVEMBER 2017 FREE TO NACE MEMBERS $52.00 NONMEMBER PRICE JOB OUTLOOK 2018 NATIONAL ASSOCIATION OF COLLEGES AND EMPLOYERS 62 Highland Avenue, Bethlehem, PA 18017 www.naceweb.org 610,868.1421 TABLE OF CONTENTS
EVALUATION PLAN
 UNIVERSITY OF NEW MEXICO COLLEGE OF EDUCATION 2013-14 EVALUATION PLAN NEW MEXICO PUBLIC EDUCATION DEPARTMENT EDUCATIONAL ACCOUNTABILTY REPORTING SYSTEM MSC05 3040 1 UNIVERSITY OF NEW MEXICO ALBUQUERQUE,
New Jersey Institute of Technology Newark College of Engineering
 New Jersey Institute of Technology Newark College of Engineering AND IN ELECTRICAL AND COMPUTER ENGINEERING Program Review Last Update: Nov. 23, 2005 MISSION STATEMENTS DOCTOR OF PHILOSOPHY IN ELECTRICAL
Sheila M. Smith is Assistant Professor, Department of Business Information Technology, College of Business, Ball State University, Muncie, Indiana.
 Using the Social Cognitive Model to Explain Vocational Interest in Information Technology Sheila M. Smith This study extended the social cognitive career theory model of vocational interest (Lent, Brown,
Colorado State University Department of Construction Management. Assessment Results and Action Plans
 Colorado State University Department of Construction Management Assessment Results and Action Plans Updated: Spring 2015 Table of Contents Table of Contents... 2 List of Tables... 3 Table of Figures...
Committee to explore issues related to accreditation of professional doctorates in social work
 Committee to explore issues related to accreditation of professional doctorates in social work October 2015 Report for CSWE Board of Directors Overview Informed by the various reports dedicated to the
Using LibQUAL+ at Brown University and at the University of Connecticut Libraries
 Using LibQUAL+ at Brown University at the University of Connecticut Libraries 1/10/2011 1 Assessment librarians cannot single-hedly implement improvements for users Staff throughout the library must be
The University of North Carolina Strategic Plan Online Survey and Public Forums Executive Summary
 The University of North Carolina Strategic Plan Online Survey and Public Forums Executive Summary The University of North Carolina General Administration January 5, 2017 Introduction The University of
Value of Athletics in Higher Education March Prepared by Edward J. Ray, President Oregon State University
 Materials linked from the 5/12/09 OSU Faculty Senate agenda 1. Who Participates Value of Athletics in Higher Education March 2009 Prepared by Edward J. Ray, President Oregon State University Today, more
BASIC EDUCATION IN GHANA IN THE POST-REFORM PERIOD
 BASIC EDUCATION IN GHANA IN THE POST-REFORM PERIOD By Abena D. Oduro Centre for Policy Analysis Accra November, 2000 Please do not Quote, Comments Welcome. ABSTRACT This paper reviews the first stage of
Table of Contents. Internship Requirements 3 4. Internship Checklist 5. Description of Proposed Internship Request Form 6. Student Agreement Form 7
 Table of Contents Section Page Internship Requirements 3 4 Internship Checklist 5 Description of Proposed Internship Request Form 6 Student Agreement Form 7 Consent to Release Records Form 8 Internship
ECON 365 fall papers GEOS 330Z fall papers HUMN 300Z fall papers PHIL 370 fall papers
 Assessing Critical Thinking in GE In Spring 2016 semester, the GE Curriculum Advisory Board (CAB) engaged in assessment of Critical Thinking (CT) across the General Education program. The assessment was
Developing an Assessment Plan to Learn About Student Learning
 Developing an Assessment Plan to Learn About Student Learning By Peggy L. Maki, Senior Scholar, Assessing for Learning American Association for Higher Education (pre-publication version of article that
Fostering Equity and Student Success in Higher Education
 Fostering Equity and Student Success in Higher Education Laura I Rendón Professor Emerita University of Texas-San Antonio Presentation at NTCC 22 nd Annual Fall Leadership Conference Gainsesville, TX September
Millersville University Degree Works Training User Guide
 Millersville University Degree Works Training User Guide Page 1 Table of Contents Introduction... 5 What is Degree Works?... 5 Degree Works Functionality Summary... 6 Access to Degree Works... 8 Login
UNI University Wide Internship
 Through UNI 290, students have obtained approval for internships in a very wide variety of areas. Internships give students an opportunity to acquire practical hands-on experience in a field or area that
Demographic Survey for Focus and Discussion Groups
 Appendix F Demographic Survey for Focus and Discussion Groups Demographic Survey--Lesbian, Gay, and Bisexual Discussion Group Demographic Survey Faculty with Disabilities Discussion Group Demographic Survey
A Diverse Student Body
 A Diverse Student Body No two diversity plans are alike, even when expressing the importance of having students from diverse backgrounds. A top-tier school that attracts outstanding students uses this
Evaluation of Hybrid Online Instruction in Sport Management
 Evaluation of Hybrid Online Instruction in Sport Management Frank Butts University of West Georgia fbutts@westga.edu Abstract The movement toward hybrid, online courses continues to grow in higher education
Descriptive Summary of Beginning Postsecondary Students Two Years After Entry
 NATIONAL CENTER FOR EDUCATION STATISTICS Statistical Analysis Report June 994 Descriptive Summary of 989 90 Beginning Postsecondary Students Two Years After Entry Contractor Report Robert Fitzgerald Lutz
Procedia - Social and Behavioral Sciences 197 ( 2015 )
") Available online at www.sciencedirect.com ScienceDirect Procedia - Social and Behavioral Sciences 197 ( 2015 ) 589 594 7th World Conference on Educational Sciences, (WCES-2015), 05-07 February 2015, Novotel
Available online at www.sciencedirect.com ScienceDirect Procedia - Social and Behavioral Sciences 197 ( 2015 ) 589 594 7th World Conference on Educational Sciences, (WCES-2015), 05-07 February 2015, Novotel
Annual Report Accredited Member
 International Assembly for Collegiate Business Education Annual Report Accredited Member Institution: Academic Business Unit: Palm Beach Atlantic University Rinker School of Business Academic Year: 2013-14
Tentative School Practicum/Internship Guide Subject to Change
 04/2017 1 Tentative School Practicum/Internship Guide Subject to Change Practicum and Internship Packet For Students, Interns, and Site Supervisors COUN 6290 School Counseling Practicum And COUN 6291 School
EDUCATIONAL ATTAINMENT
 EDUCATIONAL ATTAINMENT By 2030, at least 60 percent of Texans ages 25 to 34 will have a postsecondary credential or degree. Target: Increase the percent of Texans ages 25 to 34 with a postsecondary credential.
Multiple regression as a practical tool for teacher preparation program evaluation
 Multiple regression as a practical tool for teacher preparation program evaluation ABSTRACT Cynthia Williams Texas Christian University In response to No Child Left Behind mandates, budget cuts and various
Iowa School District Profiles. Le Mars
 Iowa School District Profiles Overview This profile describes enrollment trends, student performance, income levels, population, and other characteristics of the public school district. The report utilizes
School Competition and Efficiency with Publicly Funded Catholic Schools David Card, Martin D. Dooley, and A. Abigail Payne
 School Competition and Efficiency with Publicly Funded Catholic Schools David Card, Martin D. Dooley, and A. Abigail Payne Web Appendix See paper for references to Appendix Appendix 1: Multiple Schools
The patient-centered medical
 Primary Care Residents Want to Learn About the Patient- Centered Medical Home Gerardo Moreno, MD, MSHS; Julia Gold, MD; Maureen Mavrinac, MD BACKGROUND AND OBJECTIVES: The patient-centered medical home
The Talent Development High School Model Context, Components, and Initial Impacts on Ninth-Grade Students Engagement and Performance
 The Talent Development High School Model Context, Components, and Initial Impacts on Ninth-Grade Students Engagement and Performance James J. Kemple, Corinne M. Herlihy Executive Summary June 2004 In many
Student Experience Strategy
 2020 1 Contents Student Experience Strategy Introduction 3 Approach 5 Section 1: Valuing Our Students - our ambitions 6 Section 2: Opportunities - the catalyst for transformational change 9 Section 3:
Effective Recruitment and Retention Strategies for Underrepresented Minority Students: Perspectives from Dental Students
 Critical Issues in Dental Education Effective Recruitment and Retention Strategies for Underrepresented Minority Students: Perspectives from Dental Students Naty Lopez, Ph.D.; Rose Wadenya, D.M.D., M.S.;
Data Glossary. Summa Cum Laude: the top 2% of each college's distribution of cumulative GPAs for the graduating cohort. Academic Honors (Latin Honors)
") Institutional Research and Assessment Data Glossary This document is a collection of terms and variable definitions commonly used in the universities reports. The definitions were compiled from various
Institutional Research and Assessment Data Glossary This document is a collection of terms and variable definitions commonly used in the universities reports. The definitions were compiled from various
Politics and Society Curriculum Specification
 Leaving Certificate Politics and Society Curriculum Specification Ordinary and Higher Level 1 September 2015 2 Contents Senior cycle 5 The experience of senior cycle 6 Politics and Society 9 Introduction
Van Andel Education Institute Science Academy Professional Development Allegan June 2015
 Van Andel Education Institute Science Academy Professional Development Allegan June 2015 Science teachers from Allegan RESA took part in professional development with the Van Andel Education Institute
This survey is intended for Pitt Public Health graduates from December 2013, April 2014, June 2014, and August EOH: MPH. EOH: PhD.
 Pitt Public Health Exit Survey This survey will ask you questions about your program and the services provided by the Office of Student Affairs, as well as your overall assessment of the Graduate School
MEASURING GENDER EQUALITY IN EDUCATION: LESSONS FROM 43 COUNTRIES
 GIRL Center Research Brief No. 2 October 2017 MEASURING GENDER EQUALITY IN EDUCATION: LESSONS FROM 43 COUNTRIES STEPHANIE PSAKI, KATHARINE MCCARTHY, AND BARBARA S. MENSCH The Girl Innovation, Research,
Aalya School. Parent Survey Results
 Aalya School Parent Survey Results 2016-2017 Parent Survey Results Academic Year 2016/2017 September 2017 Research Office The Research Office conducts surveys to gather qualitative and quantitative data
University of Toronto Mississauga Degree Level Expectations. Preamble
 University of Toronto Mississauga Degree Level Expectations Preamble In December, 2005, the Council of Ontario Universities issued a set of degree level expectations (drafted by the Ontario Council of
2012 New England Regional Forum Boston, Massachusetts Wednesday, February 1, More Than a Test: The SAT and SAT Subject Tests
 2012 New England Regional Forum Boston, Massachusetts Wednesday, February 1, 2012 More Than a Test: The SAT and SAT Subject Tests 1 Presenters Chris Lucier Vice President for Enrollment Management, University
Abu Dhabi Indian. Parent Survey Results
 Abu Dhabi Indian Parent Survey Results 2016-2017 Parent Survey Results Academic Year 2016/2017 September 2017 Research Office The Research Office conducts surveys to gather qualitative and quantitative
Loyola University Chicago Chicago, Illinois
 Loyola University Chicago Chicago, Illinois 2010 GRADUATE SECONDARY Teacher Preparation Program Design D The design of this program does not ensure adequate subject area preparation for secondary teacher
STUDENT SATISFACTION IN PROFESSIONAL EDUCATION IN GWALIOR
 International Journal of Human Resource Management and Research (IJHRMR) ISSN 2249-6874 Vol. 3, Issue 2, Jun 2013, 71-76 TJPRC Pvt. Ltd. STUDENT SATISFACTION IN PROFESSIONAL EDUCATION IN GWALIOR DIVYA