The State of the Physician Workforce
|
|
|
- Ruby Blake
- 6 years ago
- Views:
Transcription

1 The State of the Physician Workforce Michael J. Dill Director, Workforce Studies AAMC November 4,


2 Projections Diversity Population 2


3 Projections Supply, demand, specialty groups 3
4 4
5 What s new? Updated data Refined hospitalists estimates Updated PA & APRN supply projections Population health scenario Metro/non-metro location data for demand and utilization equity 5

6 Key takeaways from the updated projections Physician demand continues to grow faster than supply Projected total physician shortfall of between 40,800 and 104,900 physicians by 2030 Shortages in both primary and specialty care with a particularly large shortage in surgical specialties Consistent with 2015 & 2016 projections reports 6
7 Supply scenarios include retirement, work hours, GME expansion Retire Earlier (-2) Millennial Hours Status Quo GME Expansion Retire Later (+2) 750, , , , ,000 Projected FTE physician supply, 2030 Source: AAMC, 2017 Update: Complexities of Physician Supply and Demand: Projections from 2015 to
8 Demand scenarios include ACA, APRNs/PAs, population health, retail clinics, managed care ACA + APRN/PA High ACA + APRN/PA Moderate ACA + Population Health ACA + Retail Clinics Status Quo ACA ACA + MC 750, , , , ,000 1,000,000 1,050,000 1,100,000 Projected FTE physician demand, 2030 Source: AAMC, 2017 Update: Complexities of Physician Supply and Demand: Projections from 2015 to
9 Source: AAMC, 2017 Update: Complexities of Physician Supply and Demand: Projections from 2015 to An increasing overall shortage of physicians is projected through ,000 Total projected physician shortfall range, ,900 Projected shortage, FTE physicians 90,000 60,000 30,000 40, range
10 Source: AAMC, 2017 Update: Complexities of Physician Supply and Demand: Projections from 2015 to The size and range of projected physician shortages varies by specialty group Projected physician specialty group shortfall ranges, 2030 Primary Care Specialties 7,300 43,100 Non-Primary Care 33,500 61,800 Medical Specialties 1,300 12,000 Surgical Specialties 19,800 29,000 Other Specialties 18,600 31, ,000 20,000 30,000 40,000 50,000 60,000 70,000 10
11 Projections Health care utilization equity & population health 11
12 We model Health Care Utilization Equity to better understand magnitude of unmet need What if barriers disappeared? How much more utilization (in 2015)? Scenario 1: Insurance & Metro/ Non-metro People without medical insurance and people living in non-metropolitan areas => utilization patterns equivalent to their insured peers living in metropolitan areas Scenario 2: Insurance, Metro/Nonmetro, & Race/Ethnicity Everyone => utilization patterns equivalent to white insured populations residing in metropolitan areas 12
13 Estimated Additional Physicians Needed if U.S. Had Achieved Health Care Utilization Equity in 2015 Source: AAMC, 2017 Update: Complexities of Physician Supply and Demand: Projections from 2015 to Scenario 1: Insurance & Metro/ Non-metro 34,800 Additional Physicians Scenario 2: Insurance, Metro/Nonmetro, & Race/Ethnicity 96,800 Additional Physicians 13
14 Estimated Additional Physicians Needed if U.S. Had Achieved Health Care Utilization Equity in 2015 Source: AAMC, 2017 Update: Complexities of Physician Supply and Demand: Projections from 2015 to Scenario 1 (Insurance, Metro) 10,300 Primary Care Scenario 2 (Insurance, metro, race) 21,800 Scenario 1 (Insurance, metro) Scenario 2 (Insurance, metro, race) 24,500 75,000 Specialty Care 14
15 We model population health measures to 15 better understand their long term workforce implications Scenario models the workforce implications of achieving selected Healthy People 2020 goals Sustained 5% body weight loss for overweight and obese adults Improved blood pressure, cholesterol, and blood glucose levels for adults with elevated levels Smoking cessation
16 Achieving population health goals would have different short- and long-term effects on demand Short-term: 1% decline in physician demand Long-term: 2% increase in physician demand (by 2030) Shifts in demand for select physician specialties Shifts in utilization across delivery settings 16
17 Source: AAMC, 2017 Update: Complexities of Physician Supply and Demand: Projections from 2015 to Effect of achieving population health goals would differ across specialty groups Medical Specialties Other Surgery Primary Care 0 1,000 2,000 3,000 4,000 5,000 6,000 Net change in projected FTE physician demand by
18 Projections Underlying trends: UME 18


19 19

")


20 US MD enrollment expected to exceed 30% increase 23,000 22,000 30% over 2002 US MD FIRST YEAR ENROLLMENT 21,000 20,000 19,000 18,000 17,000 16,000 All Schools (n=145) Original schools (n=125) Historical Data Survey Data Projections 15, Source: AAMC 2016 Medical School Enrollment Survey Report 20

21 Overall MD & DO first year enrollment is projected to grow 59% between 2002 and ,000 Projected MD and DO first year enrollment through ,000 First year enrollment 25,000 20,000 15,000 10, % 35% DO MD 5, Source: AAMC 2016 Medical School Enrollment Survey Report 21
22 Admissions/UME Clerkships Match/GME 22
23 Medical schools are increasingly concerned about clinical training opportunities for their students Percentage of schools concerned about clinical training opportunities 100% 80% 60% 40% 20% 0% 87.1% 79.6% 77.4% 72.6% 73.5% 54.0% Number of clinical training sites Supply of qualified primary care preceptors Supply of qualified specialty preceptors Source: AAMC 2016 Medical School Enrollment Survey Report 23
24 Medical schools experiencing more difficulties with existing clinical training sites Percentage of schools experiencing difficulties with existing clinical training sites 70% 60% 50% 40% 30% 20% 10% 0% 11.1% High turnover among volunteer physicians 26.5% 28.0% 17.0% Difficulty in replacing retired physician volunteers 26.0% 53.0% Competition from osteopathic medical schools for clinical training sites 17.0% 34.9% Competition from offshore medical schools for clinical training sites 23.8% 62.1% Competition from other health care professionals (e.g., NPs, PAs) 32.0% 59.1% Pressure from existing clinical training sites regarding payment(s) for student rotations Source: AAMC 2016 Medical School Enrollment Survey Report

25 25
26 Adequacy of clinical opportunities for students an across-the-board concern 70% Percent of programs very concerned 60% 50% 40% 30% 20% 10% 0% Number of clinical sites Supply of primary care preceptors Supply specialty preceptors M.D. D.O. N.P. P.A. Source: Recruiting and Maintaining U.S. Clinical Training Sites: Joint Report of the 2013 Multi-Discipline Clerkship/Clinical Training Site Survey. 26
27 Clerkship/clinical training sites were getting harder to develop & maintain 4 years ago 60% Percent of programs reporting much more difficult than two years prior 50% 40% 30% 20% 10% 0% Identify and develop new core or required training sites M.D. D.O. N.P. P.A. Maintain and preserve existing core or required training sites Source: Recruiting and Maintaining U.S. Clinical Training Sites: Joint Report of the 2013 Multi-Discipline Clerkship/Clinical Training Site Survey. 27
28 Projections Underlying trends: GME 28
29 Percentage of schools concerned about graduate medical education, PERCENT OF SCHOOLS REPORTING MAJOR OR MODERATE CONCERN 35% 47% 48% 50% 39% 67% 76% 71% 62% 62% 84% 91% 86% 77% 80% FOR MY INCOMING STUDENTS IN MY STATE NATIONALLY Source: AAMC 2016 Medical School Enrollment Survey Report 29
30 Production of new physicians not keeping up with aging workforce and population 58, % 20,000 53,000 Residents/Pop. 65+ in thousands 48,000 43,000 38,000 33,000 28, % + 19% 17,500 15,000 12,500 Physicians turning 65 23, ,000 Residents entering ACGME Pop 65+ Physicians turning 65 Source: ACGME, Census, AMA Physician Masterfile; US Census Bureau 30
31 Projections Underlying trends: Physician practice 31
32 Numbers of new PAs and NPs still growing rapidly 35,000 30,000 25,000 20,000 15,000 10,000 5, Source: NCCPA; AACN. NP Graduates Newly Licensed PAs 32 UPDATE
33 The shift in physician work hours has varied by age group 60 Average physician work hours per week to 35 yrs 36 to 45 yrs 46 to 55 yrs 56 to 65 yrs Total age 66 or older Source: Census (Decennial/ACS). 33
34 The shift in physician work hours has varied by age group and sex 6 3 Change in average male physician work hours, 1980 to Change in average female physician work hours, 1980 to MALE 26 to 35 yrs 36 to 45 yrs 46 to 55 yrs 56 to 65 yrs 66 + yrs FEMALE 26 to 35 yrs 36 to 45 yrs 46 to 55 yrs 56 to 65 yrs 66 + yrs Source: Census (Decennial/ACS). 34
35 The US physician workforce is getting older 250,000 Number of Physicians Who Worked in Prior Year , , ,000 50,000 0 Age 26 to 35 Age 36 to 45 Age 46 to 55 Age 56 to 65 Age 66 or older Source: United States Census Bureau. Note: Data for 2010 are a combination of 2009, 2010, 2011 American Community Surveys. *In 2000 and 2010, Other includes two or more races 35
36 Retirement scenarios remain the most extreme physician supply projections Projected FTE Physician Supply: All Physicians 880,000 Retire Later +2 GME Expansion Status Quo 830,000 Millennial Hours Retire Earlier , Source: AAMC, 2017 Update: Complexities of Physician Supply and Demand: Projections from 2015 to


37 Technology can improve access to a wide array of services From a patient perspective, we ask about: Viewing lab results online Making appointments online Telephone communication communication Video communication 37
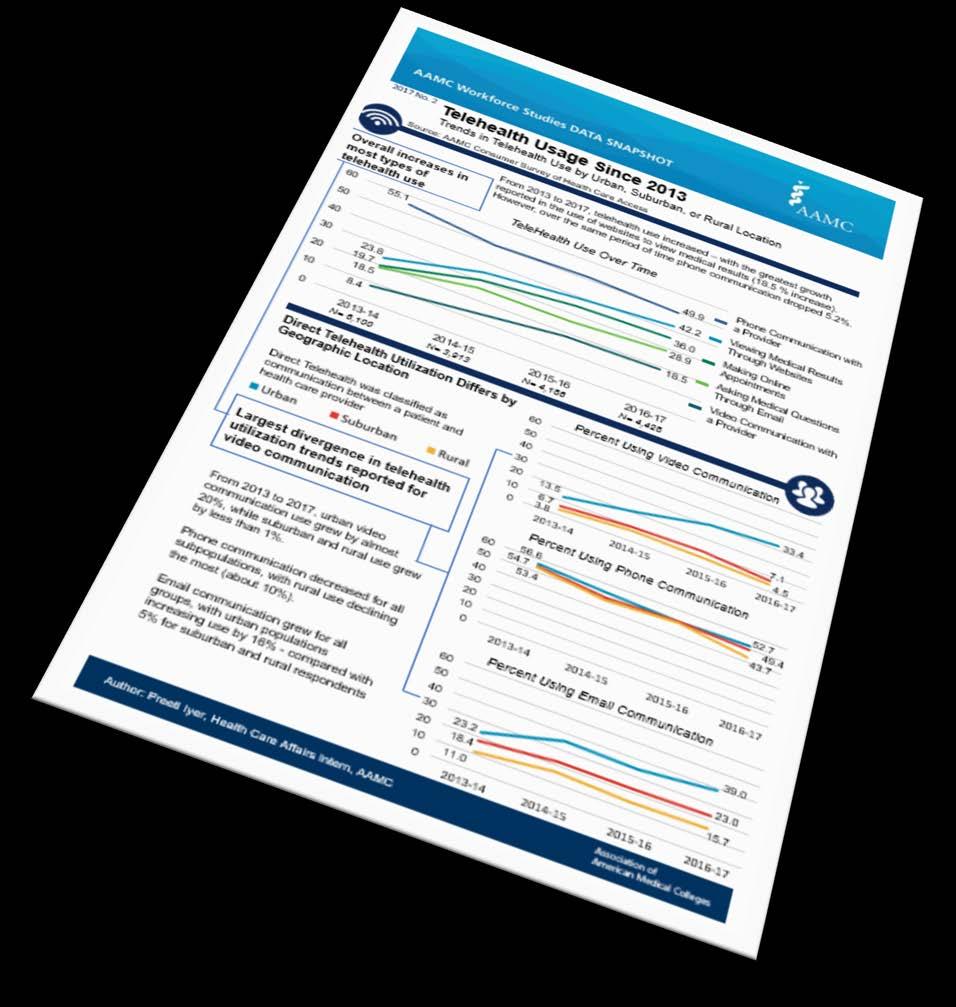
38 Consumers report overall increases in most types of technology use 38
39 Largest divergence in consumers use of technology reported for video communication 39
40 Workforce Diversity 40
41 Physician workforce in the US continues to grow and to include more female physicians 800, ,000 Number of Physicians Who Worked in Prior Year 612, , , , , , Male Source: United States Census Bureau Note: Data for 2010 are a combination of 2009, 2010, 2011 American Community Surveys Female 41
42 Physician workforce is slowly becoming more racially and ethnically diverse 1,000,000 Number of Physicians Who Worked in Prior Year 750, , , White Black American Indian or Alaska Native Asian or Pacific Islander Two or more major races Hispanic, any race Source: United States Census Bureau. Note: Data for 2010 are a combination of 2009, 2010, 2011 American Community Surveys. *In 2000 and 2010, Other includes two or more races 42


43 North Carolina makes a good case study in the need to understand workforce diversity in context Data Source: 2015 American Community Survey 5-year Estimates; 2014 North Carolina Physician Licensure Data 43

44 Black or African American population and physician distributions dissimilar Population Data Source: 2015 American Community Survey 5-year Estimates; 2014 North Carolina Physician Licensure Data 44

45 American Indian / Alaska Native population and physician distributions somewhat similar Population Data Source: 2015 American Community Survey 5-year Estimates; 2014 North Carolina Physician Licensure Data 45
46 IMGs comprise a significant part of the nation s physician workforce 24.5% of 2016 active physicians were International Medical Graduates (IMGs) % of active residents were International Medical Graduates (IMGs) State Physician Workforce Data Report, AAMC Workforce Studies AAMC Report on Residents, December
47 Deferred Action for Childhood Arrivals (DACA) program uncertainty could impact workforce diversity Students with DACA status: 113 Applied to U.S. medical schools for the year 65 Enrolled in U.S. medical schools in the year AAMC expects increased enrollment of DACA Dreamers in since most with confirmed DACA status have not yet finished their undergraduate degrees
48 Education pipeline Diversity 48
49 Small but important gains from medical school expansion Most expansion - highest proportions in primary care and practicing in underserved and rural areas. Racial and ethnic diversity of matriculants increased modestly - new schools contributed disproportionately. Shipman, Jones, Erikson, & Sandberg Exploring the Workforce Implications of a Decade of Medical School Expansion: Variations in Medical School Growth 49and Changes in Student Characteristics and Career Plans. Academic Medicine 88(12):
50 Percentage of U.S. medical school graduates by sex, % 70% 60% 50% 40% 30% 20% Female Male 10% 0% Source: AAMC Data Warehouse: Student file, as of 1/7/
51 Percentage of U.S. medical school white graduates by sex, % 70% 60% 50% 40% 30% 20% Female Male 10% 0% Source: AAMC Data Warehouse: Student data and Applicant and Matriculant file, as of 7/11/
52 Percentage of U.S. medical school Hispanic graduates by sex, % 70% 60% 50% 40% 30% Female 20% Male 10% 0% Source: AAMC Data Warehouse: Student data and Applicant and Matriculant file, as of 7/11/
53 Percentage of U.S. medical school Asian graduates by sex, % 70% 60% 50% 40% 30% 20% Female Male 10% 0% Source: AAMC Data Warehouse: Student data and Applicant and Matriculant file, as of 7/11/
54 Percentage of U.S. medical school American Indian/Alaska Native graduates by sex, % 70% 60% 50% 40% 30% 20% 10% Female Male 0% Source: AAMC Data Warehouse: Student data and Applicant and Matriculant file, as of 7/11/
55 Percentage of U.S. medical school Black or African American graduates by sex, % 70% 60% 50% 40% 30% 20% 10% 0% Female Male Source: AAMC Data Warehouse: Student data and Applicant and Matriculant file, as of 7/11/
56 Percentage of U.S. medical school female, % 70% 60% 50% 40% 30% 20% 10% Hispanic Black or African American Asian White 0% Source: AAMC Data Warehouse: Student data and Applicant and Matriculant file, as of 7/11/
57 After 30+ years, Black male matriculation is slowly increasing above 1980 levels Male matriculants to US medical schools, 1980 to Black/African American 700 Black Alone 600 Black Alone or in Combination with Another Race Source: AAMC AMCAS APP_BIO tables. Race is only available for permanent residents. 57

58 Most USMD schools have programs or policies designed to recruit a diverse student body Percentage of programs Minority groups currently underrepresented in medicine 90% Students with disadvantaged backgrounds 88% Students from rural communities 60% Students from underserved communities 61% Students from local underserved communities 70% 0% 25% 50% 75% 100% Source: AAMC 2016 Medical School Enrollment Survey Report 58

59 Recruitment programs begin in elementary school Percentage of schools with specific admissions programs or policies Elementary school students 23% Middle school students 59% High school students 91% Community college students--nationwide 8% Community college students--local 42% Four-year-university students--nationwide 59% Four-year-university students--local 86% 0% 10% 20% 30% 40% 50% 60% 70% 80% 90% 100% Source: AAMC 2016 Medical School Enrollment Survey Report 59
60 Demand Population 60

61 Source: AAMC, 2017 Update: Complexities of Physician Supply and Demand: Projections from 2015 to More absolute future growth in utilization projected from whites than other groups Projected Growth in Physician Demand by Patient Race and Ethnicity 70,000 60,000 50,000 40,000 30,000 20,000 10,000 Projected growth in FTE physician demand, 2015 to White Black Asians, Pacific Islanders, Native Americans, and Alaskan Natives Hispanic 61

62 Source: AAMC, 2017 Update: Complexities of Physician Supply and Demand: Projections from 2015 to Much faster utilization growth rates projected for other groups than for whites 60% Projected Growth in Physician Demand by Patient Race and Ethnicity 50% 40% 30% 20% 10% 10% Projected percentage growth in FTE physician demand, 2015 to % 45% 49% 0% White Black Asians, Pacific Islanders, Native Americans, and Alaskan Natives Hispanic 62
63 Source: AAMC, 2017 Update: Complexities of Physician Supply and Demand: Projections from 2015 to The vast majority of physician demand current and projected is in metropolitan areas FTE physician demand FTE physician demand Metro, 2015 Metro, Non-metro, 2015 Non metro, , , , , , , , , , ,000 50,000 50,000 0 Primary Care Medical Specialties Surgery Other 0 Primary Care Medical Specialties Surgery Other 63

64 Access to care Population 64

65 AAMC collects data on health care access from consumers Needed care last 12 months-always able to get it, 50% Did not need care, 43% Could not afford, 3% Could not get appointment soon enough, 1% Could not find provider, 2% 7% of U.S. adults (>17 million people) could not always get care Transportation problems, 1% Other, 0% Source: AAMC Consumer Survey of Health Care Access (June, 2017) 65

66 LGB individuals consistently face greater challenges accessing care Gay, lesbian, or bisexual Heterosexual or straight Source: AAMC Consumer Survey of Healthcare Access. 66
67 Access to care appears to be improving, though racial/ethnic disparities persist 35 Percent of respondents not always able to get care White Black/African American Hispanic and Other Asian Hispanic/Latino Multi-race (non- Hispanic) Source: AAMC Consumer Survey of Health Care Access Native Hawaiian/Other Pacific Islander & Other excluded due to sample size. American Indian/Alaska Native 67


68 The nation s rural population is not homogenous 68
69 Rural access varies by race/ethnicity 69
70 The diversity of American medicine and the conversations, ideas and breakthroughs this diversity sparks may be one reason for our competitiveness as a global leader in biomedical research and innovation. - Dhruv Khullar, MD Aaron Carroll, Why America Needs Foreign Medical Graduates. 70
71 The AAMC Workforce Studies Team Da Shia Davis, BS Kara Fisher, MPH Sarah Hampton, BA Karen Jones, MApStat Scott Shipman, MD Imam Xierali, PhD Preeti Iyer, BSE (in progress) Michelle Ogunwole, MD 71


72 Data Snapshots 72


73 Physician data reports State and specialty rankings and data on: Physician Supply UME/GME In-State Retention 73

74 Health Workforce Research Conference Tysons, VA May 9-11,
75 Production of new physicians not keeping up with aging workforce and population 58, % 20,000 53,000 Residents/Pop. 65+ in thousands 48,000 43,000 38,000 33,000 28, % + 19% 17,500 15,000 12,500 Physicians turning 65 23, ,000 Residents entering ACGME Pop 65+ Physicians turning 65 Source: ACGME, Census, AMA Physician Masterfile; US Census Bureau 75


76 PROJECTIONS SHORTAGES NOT KEEPING UP WITH AGING Projections Pulling it all together Diversity DIVERSITY A GOOD THING PROGRESS NEED MORE PROGRESS Population POPULATION AGING DIVERSE DEALING WITH DISPARITIES 76
77 Where do we go from here? Extent of current shortages Work hours and retirement PAs and APRNs Clinical training/clerkships Distribution solutions Pipeline programs Keep tracking access 77
78 Questions? 78
Status of Women of Color in Science, Engineering, and Medicine
 Status of Women of Color in Science, Engineering, and Medicine The figures and tables below are based upon the latest publicly available data from AAMC, NSF, Department of Education and the US Census Bureau.
Pathways to Health Professions of the Future
 Pathways to Health Professions of the Future Stephen C. Shannon, DO, MPH American Association of Colleges of Osteopathic Medicine Copyright 2014 AACOM, all rights reserved. Photo courtesy of LECOM The
Supply and Demand of Instructional School Personnel
 Supply and Demand of Instructional School Personnel Presentation to the 82 nd Annual Virginia Middle and High School Principals Conference and Exposition Mrs. Patty S. Pitts Assistant Superintendent of
Enrollment Trends. Past, Present, and. Future. Presentation Topics. NCCC enrollment down from peak levels
 Presentation Topics 1. Enrollment Trends 2. Attainment Trends Past, Present, and Future Challenges & Opportunities for NC Community Colleges August 17, 217 Rebecca Tippett Director, Carolina Demography
File Print Created 11/17/2017 6:16 PM 1 of 10
 Success - Key Measures Graduation Rate: 4-, 5-, and 6-Year 9. First-time, full-time entering, degree-seeking, students enrolled in a minimum of 12 SCH their first fall semester who have graduated from
Iowa School District Profiles. Le Mars
 Iowa School District Profiles Overview This profile describes enrollment trends, student performance, income levels, population, and other characteristics of the public school district. The report utilizes
Port Graham El/High. Report Card for
 School: District: Kenai Peninsula Grades: K - 12 School Enrollment: 20 Title I School? No Title 1 Program: Accreditation: Report Card for 2008-2009 A Title 1 school receives federal money in support low-achieving
Demographic Survey for Focus and Discussion Groups
 Appendix F Demographic Survey for Focus and Discussion Groups Demographic Survey--Lesbian, Gay, and Bisexual Discussion Group Demographic Survey Faculty with Disabilities Discussion Group Demographic Survey
Transportation Equity Analysis
 2015-16 Transportation Equity Analysis Each year the Seattle Public Schools updates the Transportation Service Standards and bus walk zone boundaries for use in the upcoming school year. For the 2014-15
The number of involuntary part-time workers,
 University of New Hampshire Carsey School of Public Policy CARSEY RESEARCH National Issue Brief #116 Spring 2017 Involuntary Part-Time Employment A Slow and Uneven Economic Recovery Rebecca Glauber The
Frank Phillips College. Accountability Report
 Frank Phillips College Accountability Report January 2016 Accountability System, January 2016 1 of 22 Participation - Key Measures Enrollment 1. Fall Headcount (Unduplicated) Fall 2000 Fall 2014 Fall 2015
HSC/SOM GOAL 1: IMPROVE HEALTH AND HEALTHCARE IN THE POPULATIONS WE SERVE.
 SOM STRATEGIC PLAN 2017-2020 (with metrics/action plan for 2018) revised 8/30/17 HSC/SOM GOAL 1: IMPROVE HEALTH AND HEALTHCARE IN THE POPULATIONS WE SERVE. Measure of success: Improvement in state ranking
National Survey of Student Engagement The College Student Report
 The College Student Report This is a facsimile of the NSSE survey (available at nsse.iub.edu/links/surveys). The survey itself is administered online. 1. During the current school year, about how often
Western Australia s General Practice Workforce Analysis Update
 Western Australia s General Practice Workforce Analysis Update NOVEMBER 2015 PUBLISHED MAY 2016 Rural Health West This work is copyright. Apart from any use as permitted under the Copyright Act 1968, no
Final. Developing Minority Biomedical Research Talent in Psychology: The APA/NIGMS Project
 Final Report Developing Minority Biomedical Research Talent in Psychology: A Collaborative and Systemic Approach for Strengthening Institutional Capacity for Recruitment, Retention, Training, and Research
Updated: December Educational Attainment
 Updated: Educational Attainment Among 25- to 29-year olds, the proportions who have attained a high school education, some college, or a bachelor s degree are all rising, according to longterm trends.
Los Angeles City College Student Equity Plan. Signature Page
 Los Angeles City College Student Equity Plan Signature Page Los Angeles Community College Los Angeles City College President, Board of Trustees Date District Chancellor: College President: Academic Senate
Suggested Citation: Institute for Research on Higher Education. (2016). College Affordability Diagnosis: Maine. Philadelphia, PA: Institute for
. College Affordability Diagnosis: Maine. Philadelphia, PA: Institute for") MAINE Suggested Citation: Institute for Research on Higher Education. (2016). College Affordability Diagnosis: Maine. Philadelphia, PA: Institute for Research on Higher Education, Graduate School of Education,
MAINE Suggested Citation: Institute for Research on Higher Education. (2016). College Affordability Diagnosis: Maine. Philadelphia, PA: Institute for Research on Higher Education, Graduate School of Education,
5 Programmatic. The second component area of the equity audit is programmatic. Equity
 5 Programmatic Equity It is one thing to take as a given that approximately 70 percent of an entering high school freshman class will not attend college, but to assign a particular child to a curriculum
Effective Recruitment and Retention Strategies for Underrepresented Minority Students: Perspectives from Dental Students
 Critical Issues in Dental Education Effective Recruitment and Retention Strategies for Underrepresented Minority Students: Perspectives from Dental Students Naty Lopez, Ph.D.; Rose Wadenya, D.M.D., M.S.;
Strategic Plan Dashboard Results. Office of Institutional Research and Assessment
 29-21 Strategic Plan Dashboard Results Office of Institutional Research and Assessment Binghamton University Office of Institutional Research and Assessment Definitions Fall Undergraduate and Graduate
Educational Attainment
 A Demographic and Socio-Economic Profile of Allen County, Indiana based on the 2010 Census and the American Community Survey Educational Attainment A Review of Census Data Related to the Educational Attainment
2012 ACT RESULTS BACKGROUND
 Report from the Office of Student Assessment 31 November 29, 2012 2012 ACT RESULTS AUTHOR: Douglas G. Wren, Ed.D., Assessment Specialist Department of Educational Leadership and Assessment OTHER CONTACT
12-month Enrollment
 12-month Enrollment 2016-17 Institution: Potomac State College of West Virginia University (237701) Overview 12-month Enrollment Overview The 12-Month Enrollment component collects unduplicated student
The Demographic Wave: Rethinking Hispanic AP Trends
 The Demographic Wave: Rethinking Hispanic AP Trends Kelcey Edwards & Ellen Sawtell AP Annual Conference, Las Vegas, NV July 19, 2013 Exploring the Data Hispanic/Latino US public school graduates The Demographic
Lesson M4. page 1 of 2
 Lesson M4 page 1 of 2 Miniature Gulf Coast Project Math TEKS Objectives 111.22 6b.1 (A) apply mathematics to problems arising in everyday life, society, and the workplace; 6b.1 (C) select tools, including
Serving Country and Community: A Study of Service in AmeriCorps. A Profile of AmeriCorps Members at Baseline. June 2001
 Serving Country and Community: A Study of Service in AmeriCorps Cambridge, MA Lexington, MA Hadley, MA Bethesda, MD Washington, DC Chicago, IL Cairo, Egypt Johannesburg, South Africa A Profile of AmeriCorps
Like much of the country, Detroit suffered significant job losses during the Great Recession.
 36 37 POPULATION TRENDS Economy ECONOMY Like much of the country, suffered significant job losses during the Great Recession. Since bottoming out in the first quarter of 2010, however, the city has seen
Invest in CUNY Community Colleges
 Invest in Opportunity Invest in CUNY Community Colleges Pat Arnow Professional Staff Congress Invest in Opportunity Household Income of CUNY Community College Students
Please complete these two forms, sign them, and return them to us in the enclosed pre paid envelope.
 Anatomical Donation Program Jack and Pearl Resnick Campus 1300 Morris Park Avenue, Rm F627N Bronx, NY 10461 Phone: 718.430.3142 Fax: 718.430.8997 anatomical.gifts@einstein.yu.edu We sincerely thank you
UW-Waukesha Pre-College Program. College Bound Take Charge of Your Future!
 UW-Waukesha Pre-College Program College Bound 2017 Take Charge of Your Future! This is a great program to increase your knowledge on various subjects. Students will be engaged in workshops and hands-on
EDUCATIONAL ATTAINMENT
 EDUCATIONAL ATTAINMENT By 2030, at least 60 percent of Texans ages 25 to 34 will have a postsecondary credential or degree. Target: Increase the percent of Texans ages 25 to 34 with a postsecondary credential.
Denver Public Schools
 2017 Candidate Surveys Denver Public Schools Denver School Board District 4: Northeast DPS District 4 - Introduction School board elections offer community members the opportunity to reflect on the state
Diversity Registered Student Organizations
 Acronym Name Description AAOWP American Association of Osteopathic Women Physicians AAOWP is a women's organization concerned with the unique issues that face us in the medical profession. We host lecture
46 Children s Defense Fund
 Nationally, about 1 in 15 teens ages 16 to 19 is a dropout. Fewer than two-thirds of 9 th graders in Florida, Georgia, Louisiana and Nevada graduate from high school within four years with a regular diploma.
PUBLIC INFORMATION POLICY
 CALIFORNIA STATE POLYTECHNIC UNIVERSITY, POMONA Landscape Architecture College of Environmental Design PUBLIC INFORMATION POLICY Landscape Architecture Accreditation Board (LAAB) accredited programs are
2018 Great Ideas Conference SAMPLE SUBMISSION FORM
 2018 Great Ideas Conference SAMPLE SUBMISSION FORM To prepare for completing the required online form, use this sample to gather proposal details and complete content leader information for each presenter/co-presenter
Shelters Elementary School
 Shelters Elementary School August 2, 24 Dear Parents and Community Members: We are pleased to present you with the (AER) which provides key information on the 23-24 educational progress for the Shelters
Legacy of NAACP Salary equalization suits.
 Why tests, anyway? Legacy of NAACP Salary equalization suits. If you can t beat em, test em. Boom! Legacy of teacher tests NTE PRAXIS-II Pearson Content Examinations GRE ACT SAT All are statistically significantly
https://secure.aacte.org/apps/peds/print_all_forms.php?view=report&prin...
 1 of 35 4/25/2012 9:56 AM A» 2011 PEDS» Institutional Data inst id: 3510 Institutional Data A_1 Institutional Information This information will be used in all official references to your institution. Institution
The Condition of College & Career Readiness 2016
 The Condition of College and Career Readiness This report looks at the progress of the 16 ACT -tested graduating class relative to college and career readiness. This year s report shows that 64% of students
SMILE Noyce Scholars Program Application
 ONLINE POST-BABACCALAUREATE TEACHER PREPARATION PROGRAM SMILE yce Scholars Program Application Introduction: Rio Salado College is soliciting applicants for the Science and Math Innovative Learning Environments
NATIONAL CENTER FOR EDUCATION STATISTICS
 NATIONAL CENTER FOR EDUCATION STATISTICS Palm Desert, CA The Integrated Postsecondary Education Data System (IPEDS) is the nation s core postsecondary education data collection program. It is a single,
University of Utah. 1. Graduation-Rates Data a. All Students. b. Student-Athletes
 University of Utah FRESHMAN-COHORT GRADUATION RATES All Students Student-Athletes # 2009-10 Graduation Rate 64% 64% Four-Class Average 61% 64% Student-Athlete Graduation Success Rate 87% 1. Graduation-Rates
APPLICANT INFORMATION. Area Code: Phone: Area Code: Phone:
 MARQUETTE UNIVERSITY HEALTH CAREERS OPPORTUNITY PROGRAM College Science Enrichment Program (CSEP) & Pre-Enrollment Support Program (PESP) Website: http://www.mu.edu/hcop INSTRUCTIONS: Please type or print
Surgical Residency Program & Director KEN N KUO MD, FACS
 Surgical Residency Program & Director KEN N KUO MD, FACS 1 Taiwan Surgical Association Residency Director Meeting September 17, 2011 November 5, 2011 2 Three Stages of Education Undergraduate medical education
UIC HEALTH SCIENCE COLLEGES
 Academic Mission Report: Board of Trustees March 10, 2010 Joseph A. Flaherty, MD Dean, College of Medicine INNOVATION EXCELLENCE SERVICE Brief History 1858 Illinois Eye and Ear Infirmary opens 1859 College
EDUCATIONAL ATTAINMENT
 EDUCATIONAL ATTAINMENT By 2030, at least 60 percent of Texans ages 25 to 34 will have a postsecondary credential or degree. Target: Increase the percent of Texans ages 25 to 34 with a postsecondary credential.
Undergraduates Views of K-12 Teaching as a Career Choice
 Undergraduates Views of K-12 Teaching as a Career Choice A Report Prepared for The Professional Educator Standards Board Prepared by: Ana M. Elfers Margaret L. Plecki Elise St. John Rebecca Wedel University
ILLINOIS DISTRICT REPORT CARD
 -6-525-2- HAZEL CREST SD 52-5 HAZEL CREST SD 52-5 HAZEL CREST, ILLINOIS and federal laws require public school districts to release report cards to the public each year. 2 7 ILLINOIS DISTRICT REPORT CARD
Kansas Adequate Yearly Progress (AYP) Revised Guidance
 Revised Guidance") Kansas State Department of Education Kansas Adequate Yearly Progress (AYP) Revised Guidance Based on Elementary & Secondary Education Act, No Child Left Behind (P.L. 107-110) Revised May 2010 Revised May
Kansas State Department of Education Kansas Adequate Yearly Progress (AYP) Revised Guidance Based on Elementary & Secondary Education Act, No Child Left Behind (P.L. 107-110) Revised May 2010 Revised May
ILLINOIS DISTRICT REPORT CARD
 -6-525-2- Hazel Crest SD 52-5 Hazel Crest SD 52-5 Hazel Crest, ILLINOIS 2 8 ILLINOIS DISTRICT REPORT CARD and federal laws require public school districts to release report cards to the public each year.
National Survey of Student Engagement Spring University of Kansas. Executive Summary
 National Survey of Student Engagement Spring 2010 University of Kansas Executive Summary Overview One thousand six hundred and twenty-one (1,621) students from the University of Kansas completed the web-based
Graduate Division Annual Report Key Findings
 Graduate Division 2010 2011 Annual Report Key Findings Trends in Admissions and Enrollment 1 Size, selectivity, yield UCLA s graduate programs are increasingly attractive and selective. Between Fall 2001
Facts and Figures Office of Institutional Research and Planning
 Facts and Figures 2008-2009 Office of Institutional Research and Planning Office of Institutional Research Fall 2009 Facts at a Glance Credit Headcount Enrollments Headcount Ethnicity Headcount Percent
Coming in. Coming in. Coming in
 212-213 Report Card for Glenville High School SCHOOL DISTRICT District results under review by the Ohio Department of Education based upon 211 findings by the Auditor of State. Achievement This grade combines
Student Mobility Rates in Massachusetts Public Schools
 Student Mobility Rates in Massachusetts Public Schools Introduction The Massachusetts Department of Elementary and Secondary Education (ESE) calculates and reports mobility rates as part of its overall
A Guide to Finding Statistics for Students
 San Joaquin Valley Statistics http://pegasi.us/sjstats/ 1 of 2 6/12/2010 5:00 PM A Guide to Finding Statistics for Students CV Stats Home By Topic By Area About the Valley About this Site Population Agriculture
KENT STATE UNIVERSITY
 KENT STATE UNIVERSITY Regents STARTALK Teacher Leadership Academy: Chinese, Russian Director: Brian J. Baer / Co-director: Theresa A. Minick Program Dates: Thursday, July 7 - Saturday, July 16 Summer 2016
Data Glossary. Summa Cum Laude: the top 2% of each college's distribution of cumulative GPAs for the graduating cohort. Academic Honors (Latin Honors)
") Institutional Research and Assessment Data Glossary This document is a collection of terms and variable definitions commonly used in the universities reports. The definitions were compiled from various
Institutional Research and Assessment Data Glossary This document is a collection of terms and variable definitions commonly used in the universities reports. The definitions were compiled from various
SAT Results December, 2002 Authors: Chuck Dulaney and Roger Regan WCPSS SAT Scores Reach Historic High
 ABOUT THE SAT 2001-2002 SAT Results December, 2002 Authors: Chuck Dulaney and Roger Regan WCPSS SAT Scores Reach Historic High The Scholastic Assessment Test (SAT), more formally known as the SAT I: Reasoning
University of Arizona
 Annual Report Submission View Questionnaire (Edit) University of Arizona Annual Report Submission for the year 2009. Report has been submitted 1 times. Report was last submitted on 11/30/2009 7:12:09 PM.
RAISING ACHIEVEMENT BY RAISING STANDARDS. Presenter: Erin Jones Assistant Superintendent for Student Achievement, OSPI
 RAISING ACHIEVEMENT BY RAISING STANDARDS Presenter: Erin Jones Assistant Superintendent for Student Achievement, OSPI Agenda Introductions Definitions History of the work Strategies Next steps Debrief
Redirected Inbound Call Sampling An Example of Fit for Purpose Non-probability Sample Design
 Redirected Inbound Call Sampling An Example of Fit for Purpose Non-probability Sample Design Burton Levine Karol Krotki NISS/WSS Workshop on Inference from Nonprobability Samples September 25, 2017 RTI
An Empirical Analysis of the Effects of Mexican American Studies Participation on Student Achievement within Tucson Unified School District
 An Empirical Analysis of the Effects of Mexican American Studies Participation on Student Achievement within Tucson Unified School District Report Submitted June 20, 2012, to Willis D. Hawley, Ph.D., Special
1.0 INTRODUCTION. The purpose of the Florida school district performance review is to identify ways that a designated school district can:
 1.0 INTRODUCTION 1.1 Overview Section 11.515, Florida Statutes, was created by the 1996 Florida Legislature for the purpose of conducting performance reviews of school districts in Florida. The statute
EARNING. THE ACCT 2016 INVITATIONAL SYMPOSIUM: GETTING IN THE FAST LANE Ensuring Economic Security and Meeting the Workforce Needs of the Nation
 THE ACCT 2016 INVITATIONAL SYMPOSIUM: GETTING IN THE FAST LANE Ensuring Economic Security and Meeting the Workforce Needs of the Nation Discussion Papers 2016 Invitational Symposium LEARNING WHILE EARNING
Global Health Kitwe, Zambia Elective Curriculum
 Global Health Kitwe, Zambia Elective Curriculum Title of Clerkship: Global Health Zambia Elective Clerkship Elective Type: Department(s): Clerkship Site: Course Number: Fourth-Year Elective Clerkship Psychiatry,
Why Graduate School? Deborah M. Figart, Ph.D., Dean, School of Graduate and Continuing Studies. The Degree You Need to Achieve TM
 Why Graduate School? Deborah M. Figart, Ph.D., Dean, School of Graduate and Continuing Studies Message from the Dean Prospective Graduate Students: As an economist, I want to relate how crucial it is for
THE UNIVERSITY OF TEXAS HEALTH SCIENCE CENTER AT HOUSTON MCGOVERN MEDICAL SCHOOL CATALOG ADDENDUM
 THE UNIVERSITY OF TEXAS HEALTH SCIENCE CENTER AT HOUSTON MCGOVERN MEDICAL SCHOOL 2016-18 CATALOG ADDENDUM Index Page I. Mission II. Fees and Charges III. Curriculum IV. Pre-Entry Program Pages 7-8 CURRENT:
5.7 Country case study: Vietnam
 5.7 Country case study: Vietnam Author Nguyen Xuan Hung, Secretary, Vietnam Pharmaceutical Association, xuanhung29@vnn.vn Summary Pharmacy workforce development has only taken place over the last two decades
John F. Kennedy Middle School
 John F. Kennedy Middle School CUPERTINO UNION SCHOOL DISTRICT Steven Hamm, Principal hamm_steven@cusdk8.org School Address: 821 Bubb Rd. Cupertino, CA 95014-4938 (408) 253-1525 CDS Code: 43-69419-6046890
Australia s tertiary education sector
 Australia s tertiary education sector TOM KARMEL NHI NGUYEN NATIONAL CENTRE FOR VOCATIONAL EDUCATION RESEARCH Paper presented to the Centre for the Economics of Education and Training 7 th National Conference
Basic Skills Initiative Project Proposal Date Submitted: March 14, Budget Control Number: (if project is continuing)
") Basic Skills Initiative Project Proposal 2016-2017 Date Submitted: March 14, 2016 Check One: New Proposal: Continuing Project: X Budget Control Number: (if project is continuing) Control # 87-413 - EOPS
Basic Skills Initiative Project Proposal 2016-2017 Date Submitted: March 14, 2016 Check One: New Proposal: Continuing Project: X Budget Control Number: (if project is continuing) Control # 87-413 - EOPS
A Diverse Student Body
 A Diverse Student Body No two diversity plans are alike, even when expressing the importance of having students from diverse backgrounds. A top-tier school that attracts outstanding students uses this
Cooper Upper Elementary School
 LIVONIA PUBLIC SCHOOLS http://cooper.livoniapublicschools.org 215-216 Annual Education Report BOARD OF EDUCATION 215-16 Colleen Burton, President Dianne Laura, Vice President Tammy Bonifield, Secretary
Moving the Needle: Creating Better Career Opportunities and Workforce Readiness. Austin ISD Progress Report
 Moving the Needle: Creating Better Career Opportunities and Workforce Readiness Austin ISD Progress Report 2013 A Letter to the Community Central Texas Job Openings More than 150 people move to the Austin
Rural Education in Oregon
 Rural Education in Oregon Overcoming the Challenges of Income and Distance ECONorthwest )'3231-'7 *-2%2') 40%22-2+ Cover photos courtesy of users Lars Plougmann, San José Library, Jared and Corin, U.S.Department
medicaid and the How will the Medicaid Expansion for Adults Impact Eligibility and Coverage? Key Findings in Brief
 on medicaid and the uninsured July 2012 How will the Medicaid Expansion for Impact Eligibility and Coverage? Key Findings in Brief Effective January 2014, the ACA establishes a new minimum Medicaid eligibility
U VA THE CHANGING FACE OF UVA STUDENTS: SSESSMENT. About The Study
 About The Study U VA SSESSMENT In 6, the University of Virginia Office of Institutional Assessment and Studies undertook a study to describe how first-year students have changed over the past four decades.
Longitudinal Integrated Clerkship Program Frequently Asked Questions
 Longitudinal Integrated Clerkship Program Frequently Asked Questions The University of Vermont Larner College of Medicine offers a rural longitudinal integrated clerkship (LIC) at the Hudson Headwaters
JOB OUTLOOK 2018 NOVEMBER 2017 FREE TO NACE MEMBERS $52.00 NONMEMBER PRICE NATIONAL ASSOCIATION OF COLLEGES AND EMPLOYERS
 NOVEMBER 2017 FREE TO NACE MEMBERS $52.00 NONMEMBER PRICE JOB OUTLOOK 2018 NATIONAL ASSOCIATION OF COLLEGES AND EMPLOYERS 62 Highland Avenue, Bethlehem, PA 18017 www.naceweb.org 610,868.1421 TABLE OF CONTENTS
2/3 9.8% 38% $0.78. The Status of Women in Missouri: 2016 ARE WOMEN 51% 22% A Comprehensive Report of Leading Indicators and Findings.
 A Missouri WOMAN WORKING FULL-TIME EARNS ONLY $0.78 FOR EACH DOLLAR A MAN EARNS 2/3 OF Missouri SENIORS LIVING IN POVERTY ARE WOMEN 9.8% The Status of Women in Missouri: 2016 A Comprehensive Report of
Student Admissions, Outcomes, and Other Data
 Student Admissions, Outcomes, and Other Data Data on Incoming Class UNL Clinical Psychology Training Program (CPTP) August Academic Year of Entry 7 8 9 Number of Applicants 9 7 8 8 8 Number Interviewed
CHA/PA Newsletter. Exploring the Field of Hospitalist Medicine. CHA/PA Fall Banquet
 Page 1 of 9 Current information about the CHA/PA Physician Assistant Program at the University of Colorado Denver. Is this email not displaying correctly? View it in your browser. CHA/PA Newsletter Read
Welcome. Paulo Goes Dean, Eller College of Management Welcome Our region
 Welcome. Paulo Goes Dean, Welcome. Our region Outlook for Tucson Patricia Feeney Executive Director, Southern Arizona Market Chase George W. Hammond, Ph.D. Director, University of Arizona 1 Visit the award-winning
Women, Minorities, and Persons with Disabilities in Science and Engineering
 2017 Women, Minorities, and Persons with Disabilities in Science and Engineering Emilda B. Rivers, Deputy Director National Center for Science and Engineering Statistics National Science Foundation www.nsf.gov/statistics
2012 New England Regional Forum Boston, Massachusetts Wednesday, February 1, More Than a Test: The SAT and SAT Subject Tests
 2012 New England Regional Forum Boston, Massachusetts Wednesday, February 1, 2012 More Than a Test: The SAT and SAT Subject Tests 1 Presenters Chris Lucier Vice President for Enrollment Management, University
Psychometric Research Brief Office of Shared Accountability
 August 2012 Psychometric Research Brief Office of Shared Accountability Linking Measures of Academic Progress in Mathematics and Maryland School Assessment in Mathematics Huafang Zhao, Ph.D. This brief
Basic Standards for Residency Training in Internal Medicine. American Osteopathic Association and American College of Osteopathic Internists
 Basic Standards for Residency Training in Internal Medicine American Osteopathic Association and American College of Osteopathic Internists BOT Rev. 2/2011 TABLE OF CONTENTS I. Introduction... 3 II Mission...
STEM Academy Workshops Evaluation
 OFFICE OF INSTITUTIONAL RESEARCH RESEARCH BRIEF #882 August 2015 STEM Academy Workshops Evaluation By Daniel Berumen, MPA Introduction The current report summarizes the results of the research activities
Improving recruitment, hiring, and retention practices for VA psychologists: An analysis of the benefits of Title 38
 Improving recruitment, hiring, and retention practices for VA psychologists: An analysis of the benefits of Title 38 Introduction / Summary Recent attention to Veterans mental health services has again
Volunteer State Community College Strategic Plan,
 Volunteer State Community College Strategic Plan, 2005-2010 Mission: Volunteer State Community College is a public, comprehensive community college offering associate degrees, certificates, continuing
Best Colleges Main Survey
 Best Colleges Main Survey Date submitted 5/12/216 18::56 Introduction page 1 / 146 BEST COLLEGES Data Collection U.S. News has begun collecting data for the 217 edition of Best Colleges. The U.S. News
READY OR NOT? CALIFORNIA'S EARLY ASSESSMENT PROGRAM AND THE TRANSITION TO COLLEGE
 READY OR NOT? CALIFORNIA'S EARLY ASSESSMENT PROGRAM AND THE TRANSITION TO COLLEGE Michal Kurlaender University of California, Davis Policy Analysis for California Education March 16, 2012 This research
Trends & Issues Report
 Trends & Issues Report prepared by David Piercy & Marilyn Clotz Key Enrollment & Demographic Trends Options Identified by the Eight Focus Groups General Themes 4J Eugene School District 4J Eugene, Oregon
Cooper Upper Elementary School
 LIVONIA PUBLIC SCHOOLS www.livoniapublicschools.org/cooper 213-214 BOARD OF EDUCATION 213-14 Mark Johnson, President Colleen Burton, Vice President Dianne Laura, Secretary Tammy Bonifield, Trustee Dan
Student Support Services Evaluation Readiness Report. By Mandalyn R. Swanson, Ph.D., Program Evaluation Specialist. and Evaluation
 Student Support Services Evaluation Readiness Report By Mandalyn R. Swanson, Ph.D., Program Evaluation Specialist and Bethany L. McCaffrey, Ph.D., Interim Director of Research and Evaluation Evaluation
TRENDS IN. College Pricing
 2008 TRENDS IN College Pricing T R E N D S I N H I G H E R E D U C A T I O N S E R I E S T R E N D S I N H I G H E R E D U C A T I O N S E R I E S Highlights 2 Published Tuition and Fee and Room and Board
Application for Full-Time Freshman Admission
 Application for Full-Time Freshman Admission About You Biographical Information Name Fill in legal name exactly as it appears on official documents. Are you a New York State resident? First/given name