Austin Partners in Education
|
|
|
- Brent David Parrish
- 6 years ago
- Views:
Transcription


1 November 2017 Austin Partners in Education Annual Evaluation Report,
2 Table of Contents Purpose Statement... 4 Results for Classroom Coaching: 8 th -grade Math... 5 Results for College Readiness Conclusion Appendix A: APIE Evaluation Methodology Appendix B: Middle School Student Survey Instrument Appendix C: Demographics of APIE and Comparison Groups Appendix D: College Readiness Exam Results References Table of Figures Figure 1. APIE provided academic support programs for students in...schools... 4 Figure 2. A total of 725 students participated in APIE s Math Classroom Coaching... 5 Figure 3. In 2017, a significantly greater percentage of APIE (n=581) math students... 5 Figure 4. APIE 8th-grade math students had a greater difference between 2016 and Figure 5. More APIE 8th-grade math students than did the matched comparison group... 6 Figure 6. A significantly greater percentage of ELLs than of the matched comparison group... 7 Figure 7. More APIE ELL math students were in the accelerated growth category... 7 Figure 8. Participants in the Math Classroom Coaching program reported... 8 Figure 9. Most Math Classroom Coaching program students agreed or strongly agreed... 8 Figure 10. APIE volunteers found registration easy, found communication with APIE... 9 Figure 11. APIE volunteers understood their role in the program... 9 Figure 12. APIE volunteers believed their time was used effectively Figure 13. APIE volunteers believed students enjoyed participating Figure 14. APIE s College Readiness Program participants (n=514) differed Figure 15. Significantly greater percentages of APIE...took college admissions tests Figure 16. Significantly greater percentages of APIE...met the college readiness standards Figure 17. Across all college readiness assessments (SAT, ACT, and TSI) Figure 18. Most APIE seniors understood why they were in the program Figure 19. Most seniors ratings of their College Readiness Program advocates Figure 20. Most APIE seniors reported always or often spending their time focused Figure 21. While ratings were slightly lower in 2017 than in 2016,, most APIE seniors
3 Figure 22. Most seniors perceived positive college preparation outcomes Figure 23. Significantly greater percentages of APIE College Readiness Figure 24. Although the postsecondary enrollment rate for seniors districtwide Figure 25. Scale Score Ranges for Each Grade Level Category
 and its stakeholders to help them facilitate decisions about program implementation and improvement.")
4 Purpose The Austin Independent School District s (AISD) Department of Research and Evaluation (DRE) staff conducted this program evaluation to provide information about program effectiveness to Austin Partners in Education (APIE) and its stakeholders to help them facilitate decisions about program implementation and improvement. APIE designed its programs to improve students academic outcomes and promote their enjoyment of learning. Thus, this evaluation report describes the academic outcomes for students in each APIE program, as well as factors that may have influenced their learning. In the school year, two of APIE s academic support programs, which served approximately 725 AISD middle school math students and 514 high school students working toward college readiness, were evaluated. These programs were tailored to meet students academic needs, to model desired academic behaviors, and to encourage students engagement. Figure 1 APIE provided academic support programs for students in middle and high schools. APIE Programs for Direct Student Support Classroom Coaching 8th Grade Math 1x per week for all students in class small groups (3:1 or below) College Readiness Scheduled APIE class Grade x per week One- on-one and small group (3-5 students) Source. APIE program records In , the annual program evaluation focused on these major questions: What were the academic outcomes for APIE participants, and how did the outcomes compare with those for similar nonparticipants? Were APIE programs implemented effectively, as evidenced by volunteers preparation and satisfaction? Did students academic self-confidence change as a result of their participation in APIE programs? Did APIE participation improve students engagement? Did APIE students and volunteers believe the program was effective? Detailed information about the evaluation methodology used in this report is provided in Appendix A. 4
.")

5 Results for Classroom Coaching: 8 th -Grade Math Who participated in APIE s 8 th -grade Math Classroom Coaching program? Eighth-grade students from Burnet, Covington, Martin, Mendez, and Webb Middle Schools participated in APIE s 8 th -grade Math Classroom Coaching Program (Figure 2). Total participants included anybody who participated in the program in at any time during the school year. Figure 2 A total of 725 students participated in APIE s Math Classroom Coaching program. Source. AISD student enrollment records, What were the academic outcomes for Math Classroom Coaching program participants? APIE participants and a matched comparison group differed significantly in meeting the passing standard for 8 th -grade State of Texas Assessment of Academic Readiness (STAAR) math, with 76% and 70% passing, respectively (Figure 3). The sample of APIE students and the comparison group included those students with STAAR scores in 2016 and For more information on how the comparison group was selected, see Appendix A. Figure 3 In 2017, a significantly greater percentage of APIE (n=581) math students than of the matched comparison group (n=570) met the STAAR passing standard. Source. District STAAR math test files, 2016 and 2017 * Statistically significant (p <.05) 5

6 The change in math scores was greater for 8 th -grade APIE students than for the comparison group (Figure 4). In 2016, the comparison group had higher scale scores than did APIE students. However, in 2017, APIE students had higher scale scores than did the matched comparison group. More information about what scale scores mean and how they should be interpreted is provided in Appendix A. Figure 4 APIE 8th-grade math students had a greater difference between 2016 and 2017 STAAR scale scores than did the matched comparison group Source. District STAAR math test files, 2016 and 2017 The change from 2016 scores to 2017 scores was also highlighted in students growth (Figure 5). More APIE students than students in the comparison group moved into the accelerated growth category in Students in the approaches-grade-level category met the minimum passing standard scale score. Although these results showed some growth from 2016 to 2017, the differences between students in each category were not statistically significant. For more information on the details of the progress measure used by the Texas Education Agency (TEA), see Appendix A. Figure 5 More APIE 8th-grade math students than did the matched comparison group met expected or accelerated growth expectations. Source. District STAAR math test files, 2016 and
.")
 in the APIE (n=193) math program met the STAAR passing standard. Source.")
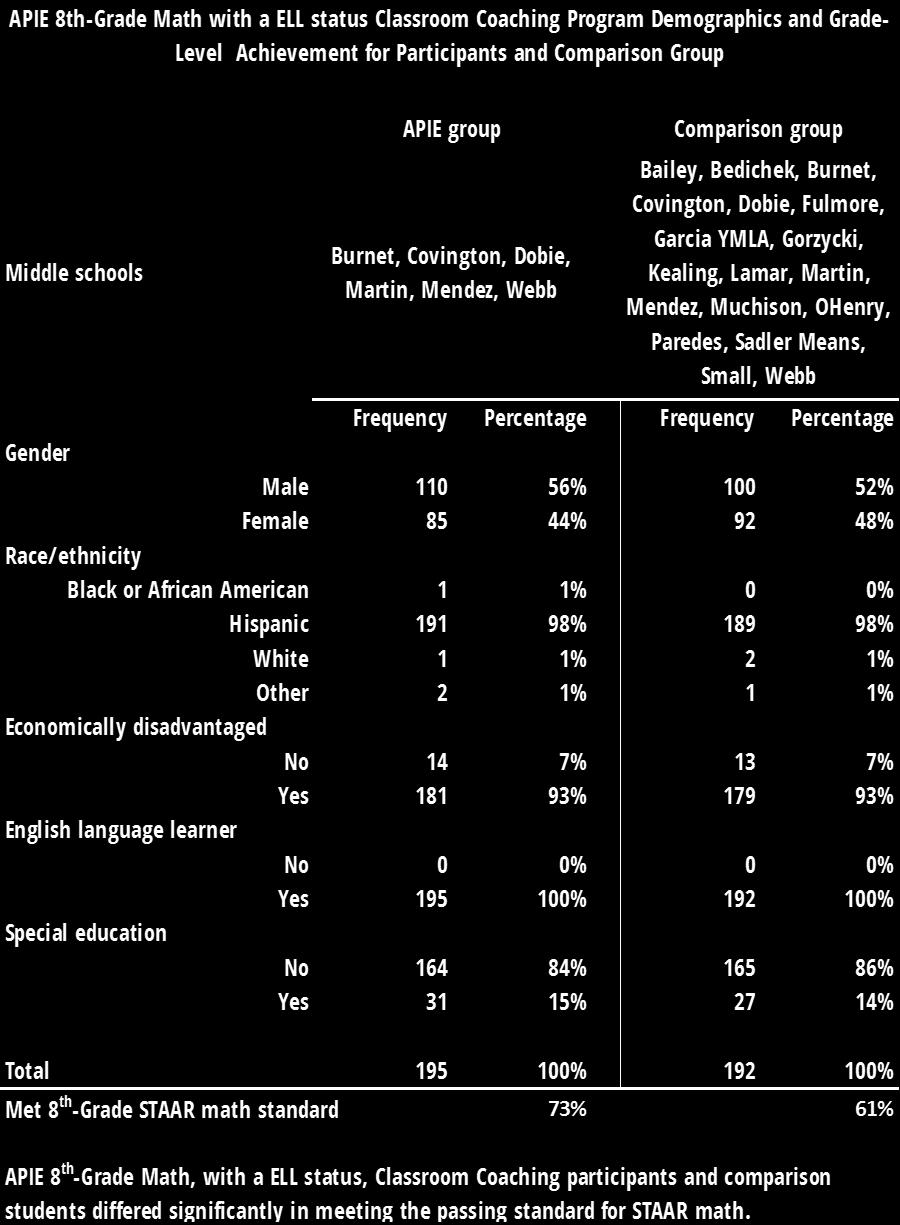
7 Because a high proportion (47%) of APIE students were categorized as English language learners (ELLs), evaluators disaggregated results for APIE students who were ELLs and a matched comparison group. Overall, APIE students identified with an ELL status met the STAAR passing standard at significantly higher rates than did the matched comparison group (Figure 6). More information about the sampling method used with ELLs and the rationale is provided in Appendix A. Figure 6 A significantly greater percentage of ELLs than of the matched comparison group (n=192) in the APIE (n=193) math program met the STAAR passing standard. Source. District STAAR math test files, 2016 and 2017 * Statistically significant (p <.05) Additionally, a greater percentage of APIE ELLs than of those in the comparison group were in the accelerated growth category (Figure 7). Although these results showed some growth from 2016 to 2017, the differences between students in each category were not statistically significant. Figure 7 More APIE ELL math students were in the accelerated growth category and fewer were in the expected and limited categories, compared with students in the matched comparison group. Source. District STAAR math test files, 2016 and

8 What did APIE s 8 th -grade math students report about their academic self-confidence, school engagement, and experiences with the program? Three hundred and sixty-one 8 th -grade Math Classroom Coaching program participants took both the pre- and post- APIE student surveys, a response rate of 50%. Academic self-confidence and behavioral engagement scores were at desirable levels (i.e., 3.0 or higher) at the beginning and end of the school year. Participants reported a significant increase in academic self-confidence and decrease in emotional disaffection (e.g., I feel discouraged or I feel bored ); however, behavioral disaffection (e.g., I just act like I m working or My mind wanders ) increased significantly (Figure 8). When asked about the effects of the math program, most students reported the APIE support helped them in math (Figure 9). The percentages of participants reporting positive outcomes (i.e., like, understood, or were better at math) remained stable from 2016 to Figure 8 Participants in the Math Classroom Coaching program reported a significant increase in academic self-confidence and significant decrease in emotional disaffection from the beginning to the end of the school year; however, behavioral disaffection increased significantly. Source. APIE Student Survey, Note. In the areas of behavioral and emotional disaffection, scores are preferably as low as possible, indicating students are less disaffected. Interpret survey results with caution because no survey results are available for a comparison group to determine whether to attribute outcomes to the program. * Statistically significant (p <.05) *** Statistically significant (p <.001) Figure 9 Most Math Classroom Coaching program students agreed or strongly agreed that they liked, understood, or were better at math because of APIE. Source. APIE Student Survey,
.")

9 What did volunteers say about the 8 th -grade Math Classroom Coaching program? Ninety-six volunteers from APIE s 8 th -grade Math Classroom Coaching program participated in the end-of-year survey, a response rate of 42% (Figures 10 through 13). Volunteers responded favorably to survey questions at a rate exceeding APIE s goal of 90% Figure 10 APIE volunteers found registration easy, found communication with APIE timely, and were satisfied with the placement process. Source. APIE Volunteer Survey, Figure 11 APIE volunteers understood their role in the program, felt prepared, and understood how to use APIE materials. How should I interpret sample data? When it is not feasible to survey an entire population, researchers may use samples instead. When using a sample to make inferences about a population, interpret results with caution. For example, although 99% of a sample may select a particular survey response, this does not necessarily mean 99% of the entire population feels the same way. To interpret the sample data cautiously, researchers from the AISD DRE used the population size and the sample size to construct a 95% confidence interval for each item. The interval allows one to be 95% confident that the true population result falls within that range. Based on the sample of 96 volunteers who answered the survey and the total population volunteers of 231, the confidence interval for volunteers is + and - 8 percentage points. To determine whether APIE met the threshold 90% for each survey question, subtract 8 percentage points from the total percentage for each item. If the intervals or ranges do not go below 90%, there is 95% certainty that APIE met its goal of 90% for each item. Source. APIE Volunteer Survey, I felt like my volunteer work was really having an impact. I got to work with the same three boys throughout the semester so I felt like I was able to build a relationship with them and have an impact. I noticed that one of my students began to engage better later in the semester once we had developed more of a relationship. APIE volunteer, Spring


10 Figure 12 APIE volunteers believed their time was used effectively, felt their contribution was meaningful, and were likely to recommend APIE. Source. APIE Volunteer Survey, Figure 13 APIE volunteers believed students enjoyed participating in the program. Source. APIE Volunteer Survey, I enjoyed the "career share" activity that each classroom coach did during the school year. I felt like the students got a lot out of hearing about the career paths of professionals in different STEM areas. APIE volunteer, Spring 2017 Overall, volunteers reported they enjoyed their experience with students and felt the program was well designed. They reported the materials had gotten better and students were gaining more confidence in math. They spoke highly about the APIE coordinator and enjoyed the addition of the career share activities. Regarding things they would change, they suggested getting more volunteers to decrease the size of groups, improving communication between APIE and schools about cancelations, providing strategies to handle disruptive students, working with the same students throughout the year. 10

11 Results for College Readiness APIE s College Readiness Program focused on preparing seniors to meet college readiness standards on the Texas Success Initiative (TSI) exam. For the Class of 2017, seniors also may have taken the SAT and/or ACT as they neared graduation to meet college admissions requirements. The APIE College Readiness Program targeted high school seniors who were eligible to graduate but may have been struggling to meet the more stringent college readiness standards on college admissions assessments. In some cases, they may not have taken any type of college admissions exam prior to program participation. Who participated in APIE s College Readiness Program? Overall, 514 seniors from 10 high schools participated in APIE s College Readiness Program: Akins, Anderson Austin, Crockett, Eastside, LBJ, Lanier, McCallum, Reagan, and Travis High Schools (Figure 14). APIE college readiness participants differed demographically from seniors district wide. They were more likely to be Hispanic and categorized as economically disadvantaged than were seniors across all high schools. Figure 14 APIE s College Readiness Program participants (n=514) differed demographically from seniors districtwide. Source. AISD student enrollment records,

12 What were the outcomes for College Readiness Program participants? Overall, significantly greater percentages of APIE College Readiness Program participants than of the matched comparison group and of seniors across the district took one or more college admissions tests (Figure 15). Ninety-five percent of APIE participants reported they felt well prepared for the exam on the end-of-year student survey. Figure 15 Significantly greater percentages of APIE College Readiness Program participants than of the matched comparison group and of seniors across the district took college admissions tests. Source. District SAT, ACT, and TSI testing records provided by College Board and ACT (TEAMS) On the TSI, significantly higher percentages of APIE participants than of the matched comparison group and of seniors across the district met the college readiness standards in English language arts (ELA), math, and both subjects (Figure 16). APIE program participation was a positive and predictive factor in whether a student met the college readiness standard on the TSI in ELA, math, and both subject areas. Figure 16 Significantly greater percentages of APIE participants than of a matched comparison group and of seniors across the district met the college readiness standards on the TSI assessments in ELA, math, and both subjects. Source. District TSI testing records provided by College Board and ACT (TEAMS) Note. Refer to Appendix D for counts of students in each group and numbers of test takers. * Statistically significant (p <.05) College Readiness Criteria To be considered college ready, a student must have met college readiness criteria on the TAKS, SAT, ACT, and/or TSI test. The criteria for each are as follows: ELA SAT: 480 on the Evidence-Based Reading and Writing portion of the assessment or ACT: 19 on English and 23 composite or TSI: 351 on reading and 363 on writing and 4 on essay or 351 on reading and 5 on essay Math SAT: 5030 on the math portion of the assessment or ACT: 19 on math and 23 composite or TSI: 350 on the math assessment For more information on these assessments, please refer to the following sites. SAT collegereadiness.collegeboard.or g/ pdf/educator-benchmarkbrief.pdf ACT act/en/college-and-careerreadiness/standards.html TSI accuplacer.collegeboard.org/ sites/default/files/accuplacer-tsiassessment-interpreting-scorev2.pdf 12
13 SAT and ACT results also were analyzed to determine whether there were differences in students overall college readiness status (Figure 17). Across all college readiness assessments (i.e., SAT, ACT, and TSI tests), APIE participants and district seniors met the college readiness standards at significantly higher rates in ELA, math, and both subjects than did the comparison group students. Figure 17 Across all college readiness assessments (SAT, ACT, and TSI), significantly higher percentages of APIE participants and district seniors met the college readiness standards compared with the matched comparison group. Source. District SAT, ACT, and TSI testing records provided by College Board and ACT, Inc. Note. Refer to Appendix D for counts of students in each group and numbers of test-takers. * Statistically significant (p <.05) What did seniors say about the College Readiness Program? Upon their completion of the college readiness tutoring, all APIE college readiness participants were asked to complete a survey to elicit their perceptions of the program s helpfulness and college readiness outcomes, and 91% completed the survey. The survey results were highly positive in both 2016 and 2017 (Figures 18 through 22). Figure 18 Most APIE seniors understood why they were in the program and believed they had appropriate materials for their work. Source. APIE College Readiness student survey,


14 Figure 19 Most APIE seniors ratings of their College Readiness Program advocates. My College Readiness advocate Source. APIE College Readiness student survey, Figure 20 Most APIE seniors reported always or often spending their time focused on their academic needs and college preparation topics when working with their advocates. Source. APIE College Readiness student survey,

15 Figure 21 Although ratings were slightly lower in 2017 than in 2016, most APIE seniors perceived positive academic outcomes as a result of the program. As a result of this program, and in the subject area in which I was tutored, my... Source. APIE College Readiness student survey, Figure 22 Most APIE seniors perceived positive college preparation outcomes as a result of the program. As a result of the program, I gained a better understanding of Source. APIE College Readiness student survey,
16 In open-ended survey responses, seniors overwhelmingly reported high levels of tutor expertise and encouragement that led to successful academic outcomes. Many also appreciated support in completing college admissions and financial aid applications. Most APIE College Readiness Program participants reported that they would not change anything about the program. Some requested additional opportunities to learn more about what college life was actually like and about career opportunities. I liked the way our teacher taught us, the way she motivated us to go to college after high school. I also liked the way the program gives you a lot of information about college. APIE College Readiness Program student, Spring 2017 Did APIE College Readiness Program participants complete other steps in preparation for postsecondary enrollment? Analysis of Apply Texas and Free Application for Federal Student Aid (FAFSA) applications revealed significantly greater percentages of APIE College Readiness Program participants than of the matched comparison group and seniors district wide completed these applications (Figures 23 and 24). Although APIE staff focused on preparing program participants to meet college readiness standards on college admissions exams, conversations also included discussion about other college preparation steps, such as completing applications to college and for financial aid. These conversations supported the district s Strategic Plan and Direct to College Initiative (DTC), which assisted students in completing the Apply Texas application for postsecondary enrollment in Texas. Ninety-nine percent of APIE survey respondents indicated the program provided them with a better understanding of other college preparation steps. Figure 23 Significantly greater percentages of APIE College Readiness Program participants than of the matched comparison group and seniors district wide completed these applications. FAFSA Apply Texas 40% 100% Source. District Apply Texas and FAFSA records provided by The Apply Texas Counselors Suite,
17 Figure 24 Although the postsecondary enrollment rate for seniors districtwide was significantly higher than for both APIE College Readiness Program participants and the matched comparison group, APIE participants enrolled at significantly higher rates than did the matched comparison group. Source. National Student Clearinghouse

18 Conclusion Program evaluation is a systematic method for collecting, analyzing, and using information to answer questions about programs, particularly about their effectiveness. In this case, three major questions were answered. Was the program implemented well? Across both APIE programs, it was determined that APIE staff effectively implemented them. Volunteers serving as classroom coaches rated program implementation attributes highly and reported positive program experiences. Most believed students were making academic progress as a result of the program. APIE provided program participants opportunities to engage with caring and supportive adults, and most students reported positive experiences. Did changes occur in students academic self-confidence and school engagement? The average academic self-confidence and emotional disaffection scores for program participants were at desirable levels at the end of the school year. Consistent with results in prior school years, participants in the Math Classroom Coaching Program reported a significant increase in academic self-confidence from the beginning to the end of the school year. APIE College Readiness Program participants also perceived greater academic confidence as a result of the program. Did participants experience positive academic outcomes as a result of their participation? Eighth-grade students participating in APIE s Math Classroom Coaching program had significantly greater academic outcomes than did the matched comparison group. Gains in academic outcomes were also observed among APIE students with ELL status. Overall, significantly greater percentages of APIE College Readiness Program participants than of the matched comparison group and of district seniors took one or more college admissions tests, and they outperformed the other groups in most instances. APIE College Readiness Program students also submitted college and FAFSA applications at higher rates than did the matched comparison group and seniors across the district. Former APIE College Readiness Program participants from the school years enrolled in postsecondary institutions at significantly higher rates than did the matched comparison group. 18


19 AUSTIN INDEPENDENT SCHOOL DISTRICT Karen Looby, Ph.D. Claude Bonazzo, Ph.D. Department of Research and Evaluation 1111 West 6th Street, Suite D-350 Austin, TX fax: November 2017 Publication
20 APPENDICES 20
21 Appendix A APIE Evaluation Methodology Data Collection To assess the processes and impact of APIE programs, DRE staff conducted qualitative and quantitative analyses using various forms of data. Staff used district information systems to obtain students demographic, course enrollment, and testing history records. APIE staff collected program participation information. Students, teachers, and volunteers submitted surveys about their experiences with APIE. Participation Records APIE staff tracked participating classrooms in the school year. At the end of the year, DRE reviewed cumulative student participation records with APIE staff to ensure the accuracy of student lists. Assessments In this evaluation, DRE staff used multiple assessments to determine academic outcomes for APIE participants and matched comparison groups. Descriptions of the assessments are as follows. STAAR. The State of Texas Assessments of Academic Readiness (STAAR) includes annual tests in reading and math for 3 rd through 8 th grade, writing tests for 4 th and 7 th grade, science assessments for 5 th and 8 th grade, a social studies test for 8 th graders, and end-of course EOC assessments for 9 th through 11 th graders in English I, English II, algebra I, biology, and U.S. history. For more information, refer to staar/ TSI. The Texas Success Initiative (TSI) assessment is used to gauge whether high school students are ready for college-level material in the areas of reading, writing, and math. The TSI assessment also provides information on what type of intervention would help a student prepare for college-level coursework. For more information, refer to SAT. The SAT is a college admission test that measures knowledge in the areas of reading, writing, and math. The SAT also offers optional subject tests in various areas. For more information, refer to home ACT. The ACT is a college readiness assessment that tests English, math, reading, and science reasoning. It also includes an optional writing section. For more information, refer to Surveys Students, teachers, and volunteers completed surveys to describe program implementation, participants attitudes, and perceived outcomes. In addition, student participants pre- and post-surveys measured their academic self-confidence and engagement and disaffection with learning. General information about each program survey is provided in the following paragraphs. Middle School Surveys. Students who participated in APIE s Math Classroom Coaching program completed program surveys in the fall and spring semesters that measured their academic self-confidence, emotional and behavioral engagement, and disaffection. The academic self-confidence survey questions were those used in the AISD Student Climate Survey, administered annually to all district students from 3 rd through 11 th grade. Additional survey items from the Engagement vs. Disaffection With Learning Survey also were used. All APIE survey items 1 21
22 were validated for use with 3 rd through 6 th graders. High School Surveys. Students who participated in the APIE College Readiness Program took an exit survey after completing the program. Students responded to questions about program implementation, program activities, and overall results, and they commented on what they liked best and what they would like to change about the program. Volunteer Surveys. This survey asked volunteers for their views on registration and placement, training and classroom materials, overall experience, and perceived student outcomes. As part of the survey, volunteers were asked two open-ended questions about what they most liked and what they would like to change about their APIE program. Data Analysis DRE staff used a mixed-methods approach to determine outcomes for APIE programs. Quantitative data (e.g., test scores and surveys) were summarized using descriptive statistics (e.g., numbers and percentages). Inferential statistics (e.g., tests of statistical significance, and linear and logistic regression analyses) were used to make judgments of the probability that an observed difference between groups might have happened as a result of the program, rather than by chance. Qualitative data were analyzed using content analysis techniques to identify important details, themes, and patterns within survey responses. Results from all analyses were triangulated, or cross-examined, to determine the consistency of results and provide a more detailed and balanced picture of program outcomes. To calculate academic progress for APIE participants and their comparison groups, DRE staff followed the TEA criteria and methodology. The TEA measures academic progress on the STAAR exam in each content area from year to year for students who meet certain criteria, such as taking the test in the same language and test version from one year to the next. The scale score is a measure that takes into account the difficulty level of the specific set of test questions on which it is based. It quantifies a student s performance relative to the passing standards or proficiency levels. Students who fall in approaches-grade-level category meet the minimum passing standard scale score within the score ranges of 1595 and 1685 (Figure 25). Figure 25 Scale Score Ranges for Each Grade Level Category for The agency publishes a STAAR Progress Measure or a Texas English Language Learner (ELL) Progress Measure for those students. These progress measures indicate whether students did or did not meet an expected level of progress, as defined by the TEA. Only students with a TEA progress measure were included in the APIE academic growth analyses. Linear regression analyses were used to determine whether APIE program participation influenced a change in STAAR scores from the school year to the school year. The dependent variable in the linear regression analysis was students STAAR scores. The independent variables in the models were variables that might 1 Skinner, E., Kindermann, T., & Furrer, C. (2008). A motivational perspective on engagement and disaffection: Conceptualization and assessment of children s behavioral and emotional participation in academic activities in the classroom. Educational and Psychological Measurement, 69(3),
23 directly or indirectly influence STAAR scores. These variables included students previous year scores, race/ethnicity, economic status, ELL status, attendance, gender, and APIE program participation. In some instances, the small number of students within a group prevented the use of linear regression, and the difference in mean scores for both APIE participants and a comparison group were analyzed using t tests to see whether a significant difference existed between them. Selection of Comparison Groups To determine whether academic outcomes were related to program participation, a matched student comparison group was selected using propensity score matching. This statistical technique considers variables that may influence program participation (e.g., prior test scores, attendance, gender, economic disadvantage status) when matching APIE program participants to students with very similar observable characteristics. This technique is useful when there are numerous characteristics on which to match students, and a sufficient number of possible comparison students from which to choose. The procedure also is used to achieve a high level of rigor when it is impossible to conduct a random experiment. Multiple variables were used in the selection of the matched comparison groups. The variables included gender, ethnicity, economic status, special education status, school attendance, and prior-year test scores before program implementation. Different assessments were used for matched comparison group selection and were program dependent. Comparison groups were primarily selected from students attending APIE schools who were not receiving APIE services. In some cases, students from non-apie schools were included in the comparison group because a larger group of students with similar characteristics was needed to ensure an appropriate match. An additional propensity score matching analysis was conducted to evaluate whether APIE had an impact on ELLs. It is suggested that the comparison sample be three to four times that of the treatment group. Because ELLs were a small subset (28.2%) of the AISD population and there was also a reduced number of ELLs from which to select a sample, a random sample of APIE students was selected from the original total treatment group of 581 students. For the College Readiness Program, a stratified random sampling process was used due to the lack of additional schools needed for propensity score matching. Limitations The lack of comparison groups in some instances limited what could be concluded from the results presented in this report. Because only APIE participants were surveyed, it was not possible to compare their results with those of similar students in the district. 23
24 Appendix B Middle School Student Survey Instrument The APIE survey of middle school program participants included questions from the Engagement vs. Disaffection With Learning Survey and the AISD Climate Survey. The survey had a total of 25 items, and three additional items about their experience with APIE were asked in the spring only. Surveys were administered in both English and Spanish. To interpret the results of the survey, it is important to understand the constructs of engagement and disaffection that are measured. Engagement has both behavioral and emotional aspects. Engaged behaviors include persistence, attention, and concentration. Engaged emotions include enthusiasm, interest, and enjoyment. The term disaffection is used in this survey to describe not only behaviors and emotions opposite those of engagement (e.g., passivity, lack of initiation, discouragement, and apathy), but also behaviors and emotions designed to adapt to that environment, such as going through the motions; disruptive noncompliance; giving up; and feeling frustrated, bored, tired, or sad (Skinner et al., 2008). Interpret average scores on the survey with care. For most items, it is desirable to have an average response of at least 3.0. For items addressing disaffection, scores should be as low as possible. A decrease in disaffection scores is desirable. The following is a key to which questions were included in the indices for each survey, and the list of survey question asked for the middle school reading and math participants are provided on the following page. Academic self-confidence: Questions 1 5 Behavioral engagement: Questions 6, 11, 13, 22, 25 Emotional engagement: Questions 7, 10, 15, 17, 20 Behavioral disaffection: Questions 9, 16, 19, 21, 24 Emotional disaffection: Questions 8, 12, 14, 18, 23 24
25 APIE Middle School Math Student Survey Please choose the answer that fits the way you feel. Never Not Don t Sometimes Always a lot know 1. I can do even the hardest schoolwork in math if I try. O O O O O 2. I felt well prepared for the STAAR exam in math. O O O O O 3. In my math class, I try hard to do my best work. O O O O O 4. I feel successful in mymath schoolwork. O O O O O 5. I can reach the goals I set for myself. O O O O O Not at all true Not very true Sort of true Very true 6. I try hard to do well in school. O O O O 7. I enjoy learning new things in math class. O O O O 8. When we work on something in math class, I feel discouraged. O O O O 9. In math, I do just enough to get by. O O O O 10. Math class is fun. O O O O 11. In math class, I work as hard as I can. O O O O 12. When I can't answer a question in math class, I feel frustrated. O O O O 13. When I'm in math class, I listen very carefully. O O O O 14. When we start something new in math class, I feel nervous. O O O O 15. When we work on something in math class, I get involved. O O O O 16. When I'm in math class, I think about other things. O O O O 17. When we work on something in math class, I feel interested. O O O O 18. Math class is not all that fun for me. O O O O 19. When I'm in math, I just act like I'm working. O O O O 20. When I'm in math class, I feel good. O O O O 21. When I'm in math class, my mind wanders. O O O O 22. When I'm in math class, I participate in class discussions. O O O O 23. When we work on something in math class, I feel bored. O O O O 24. I don't try very hard at school. O O O O 25. I pay attention in math class. O O O O Strongly Strongly Disagree Agree disagree agree 26. I like math more because of my math coach. O O O O 27. I understand more about math because of my math coach. O O O O 28. I am better at math because of my math coach. O O O O 25

26 Appendix C Demographics of APIE and Comparison Groups, by Program 26
27 27

28 Appendix D College Readiness Exam Results A total of 514 seniors completed the College Readiness Program in APIE program participants may have received tutoring in ELA, math, or both subjects. Source. District SAT, ACT, and TSI testing records provided by College Board and ACT 28
29 References Skinner, E., Furrer, C., Marchand, G., & Kindermann, T. (2008). Engagement and disaffection in the classroom: Part of a larger motivational dynamic? Journal of Educational Psychology, 100(4),
Moving the Needle: Creating Better Career Opportunities and Workforce Readiness. Austin ISD Progress Report
 Moving the Needle: Creating Better Career Opportunities and Workforce Readiness Austin ISD Progress Report 2013 A Letter to the Community Central Texas Job Openings More than 150 people move to the Austin
Evaluation of Teach For America:
 EA15-536-2 Evaluation of Teach For America: 2014-2015 Department of Evaluation and Assessment Mike Miles Superintendent of Schools This page is intentionally left blank. ii Evaluation of Teach For America:
Miami-Dade County Public Schools
 ENGLISH LANGUAGE LEARNERS AND THEIR ACADEMIC PROGRESS: 2010-2011 Author: Aleksandr Shneyderman, Ed.D. January 2012 Research Services Office of Assessment, Research, and Data Analysis 1450 NE Second Avenue,
Practices Worthy of Attention Step Up to High School Chicago Public Schools Chicago, Illinois
 Step Up to High School Chicago Public Schools Chicago, Illinois Summary of the Practice. Step Up to High School is a four-week transitional summer program for incoming ninth-graders in Chicago Public Schools.
AC : DEVELOPMENT OF AN INTRODUCTION TO INFRAS- TRUCTURE COURSE
 AC 2011-746: DEVELOPMENT OF AN INTRODUCTION TO INFRAS- TRUCTURE COURSE Matthew W Roberts, University of Wisconsin, Platteville MATTHEW ROBERTS is an Associate Professor in the Department of Civil and Environmental
African American Male Achievement Update
 Report from the Department of Research, Evaluation, and Assessment Number 8 January 16, 2009 African American Male Achievement Update AUTHOR: Hope E. White, Ph.D., Program Evaluation Specialist Department
School Performance Plan Middle Schools
 SY 2012-2013 School Performance Plan Middle Schools 734 Middle ALternative Program @ Lombard, Principal Roger Shaw (Interim), Executive Director, Network Facilitator PLEASE REFER TO THE SCHOOL PERFORMANCE
NDPC-SD Data Probes Worksheet
 NDPC-SD Data Probes Worksheet This worksheet from the National Dropout Prevention Center for Students with Disabilities (NDPC- SD) is an optional tool to help schools organize multiple years of student
Shelters Elementary School
 Shelters Elementary School August 2, 24 Dear Parents and Community Members: We are pleased to present you with the (AER) which provides key information on the 23-24 educational progress for the Shelters
Early Warning System Implementation Guide
 Linking Research and Resources for Better High Schools betterhighschools.org September 2010 Early Warning System Implementation Guide For use with the National High School Center s Early Warning System
2012 ACT RESULTS BACKGROUND
 Report from the Office of Student Assessment 31 November 29, 2012 2012 ACT RESULTS AUTHOR: Douglas G. Wren, Ed.D., Assessment Specialist Department of Educational Leadership and Assessment OTHER CONTACT
A Pilot Study on Pearson s Interactive Science 2011 Program
 Final Report A Pilot Study on Pearson s Interactive Science 2011 Program Prepared by: Danielle DuBose, Research Associate Miriam Resendez, Senior Researcher Dr. Mariam Azin, President Submitted on August
READY OR NOT? CALIFORNIA'S EARLY ASSESSMENT PROGRAM AND THE TRANSITION TO COLLEGE
 READY OR NOT? CALIFORNIA'S EARLY ASSESSMENT PROGRAM AND THE TRANSITION TO COLLEGE Michal Kurlaender University of California, Davis Policy Analysis for California Education March 16, 2012 This research
BENCHMARK TREND COMPARISON REPORT:
 National Survey of Student Engagement (NSSE) BENCHMARK TREND COMPARISON REPORT: CARNEGIE PEER INSTITUTIONS, 2003-2011 PREPARED BY: ANGEL A. SANCHEZ, DIRECTOR KELLI PAYNE, ADMINISTRATIVE ANALYST/ SPECIALIST
University-Based Induction in Low-Performing Schools: Outcomes for North Carolina New Teacher Support Program Participants in
 University-Based Induction in Low-Performing Schools: Outcomes for North Carolina New Teacher Support Program Participants in 2014-15 In this policy brief we assess levels of program participation and
Student Support Services Evaluation Readiness Report. By Mandalyn R. Swanson, Ph.D., Program Evaluation Specialist. and Evaluation
 Student Support Services Evaluation Readiness Report By Mandalyn R. Swanson, Ph.D., Program Evaluation Specialist and Bethany L. McCaffrey, Ph.D., Interim Director of Research and Evaluation Evaluation
EXECUTIVE SUMMARY. Online courses for credit recovery in high schools: Effectiveness and promising practices. April 2017
 EXECUTIVE SUMMARY Online courses for credit recovery in high schools: Effectiveness and promising practices April 2017 Prepared for the Nellie Mae Education Foundation by the UMass Donahue Institute 1
Intentional coaching and planning: Integrating mathematics teaching practices into content instruction
 : Integrating mathematics teaching practices into content instruction Conference for the Advancement of Mathematics Teaching (CAMT), San Antonio, Texas Wednesday, June 29, Ann Roman, Professional Learning
NATIONAL SURVEY OF STUDENT ENGAGEMENT (NSSE)
") NATIONAL SURVEY OF STUDENT ENGAGEMENT (NSSE) 2008 H. Craig Petersen Director, Analysis, Assessment, and Accreditation Utah State University Logan, Utah AUGUST, 2008 TABLE OF CONTENTS Executive Summary...1
NATIONAL SURVEY OF STUDENT ENGAGEMENT (NSSE) 2008 H. Craig Petersen Director, Analysis, Assessment, and Accreditation Utah State University Logan, Utah AUGUST, 2008 TABLE OF CONTENTS Executive Summary...1
EFFECTS OF MATHEMATICS ACCELERATION ON ACHIEVEMENT, PERCEPTION, AND BEHAVIOR IN LOW- PERFORMING SECONDARY STUDENTS
 EFFECTS OF MATHEMATICS ACCELERATION ON ACHIEVEMENT, PERCEPTION, AND BEHAVIOR IN LOW- PERFORMING SECONDARY STUDENTS Jennifer Head, Ed.S Math and Least Restrictive Environment Instructional Coach Department
Colorado s Unified Improvement Plan for Schools for Online UIP Report
 Colorado s Unified Improvement Plan for Schools for 2015-16 Online UIP Report Organization Code: 2690 District Name: PUEBLO CITY 60 Official 2014 SPF: 1-Year Executive Summary How are students performing?
THE PENNSYLVANIA STATE UNIVERSITY SCHREYER HONORS COLLEGE DEPARTMENT OF MATHEMATICS ASSESSING THE EFFECTIVENESS OF MULTIPLE CHOICE MATH TESTS
 THE PENNSYLVANIA STATE UNIVERSITY SCHREYER HONORS COLLEGE DEPARTMENT OF MATHEMATICS ASSESSING THE EFFECTIVENESS OF MULTIPLE CHOICE MATH TESTS ELIZABETH ANNE SOMERS Spring 2011 A thesis submitted in partial
State Parental Involvement Plan
 A Toolkit for Title I Parental Involvement Section 3 Tools Page 41 Tool 3.1: State Parental Involvement Plan Description This tool serves as an example of one SEA s plan for supporting LEAs and schools
TESTING. Who Must Take the TSI Assessment Exam? Who Does Not Have to Take the TSI Assessment Exam? When Must a Student Take the TSI Assessment Exam?
 TESTING It is the intent the Texas Higher Education Codinating Board that Texas public institutions higher education use the flexibility responsibility granted under the Texas Success Initiative (TSI)
Intentional coaching and planning: Integrating practices into content instruction
 : Integrating practices into content instruction NCSM, Oakland, CA (April 11 13, ) Monday, April 11 Ann Roman, Professional Learning Facilitator, Mathematics Katey Arrington, Manager, K 12 System Services
Alief Independent School District Liestman Elementary Goals/Performance Objectives
 Alief Independent School District 2017-2018 Goals/Performance Objectives Generated by Plan4Learningcom 1 of 8 Mission Statement Liestman will educate children in a safe environment that is infused with
TSI Operational Plan for Serving Lower Skilled Learners
 TSI Operational Plan for Serving Lower Skilled Learners VERSION 2.0* *This document represents a work in progress that is informed by and revised based on stakeholder comments and feedback. Each revised
College and Career Ready Performance Index, High School, Grades 9-12
 Dr. John D. Barge, State School Superintendent Making Education Work for All of Georgia s Students College and Career Ready Performance Index, High School, Grades 9-12 CONTENT MASTERY (END of COURSE TESTS
Kansas Adequate Yearly Progress (AYP) Revised Guidance
 Revised Guidance") Kansas State Department of Education Kansas Adequate Yearly Progress (AYP) Revised Guidance Based on Elementary & Secondary Education Act, No Child Left Behind (P.L. 107-110) Revised May 2010 Revised May
Kansas State Department of Education Kansas Adequate Yearly Progress (AYP) Revised Guidance Based on Elementary & Secondary Education Act, No Child Left Behind (P.L. 107-110) Revised May 2010 Revised May
Guidelines for the Use of the Continuing Education Unit (CEU)
") Guidelines for the Use of the Continuing Education Unit (CEU) The UNC Policy Manual The essential educational mission of the University is augmented through a broad range of activities generally categorized
Guidelines for the Use of the Continuing Education Unit (CEU) The UNC Policy Manual The essential educational mission of the University is augmented through a broad range of activities generally categorized
NATIONAL CENTER FOR EDUCATION STATISTICS RESPONSE TO RECOMMENDATIONS OF THE NATIONAL ASSESSMENT GOVERNING BOARD AD HOC COMMITTEE ON.
 NATIONAL CENTER FOR EDUCATION STATISTICS RESPONSE TO RECOMMENDATIONS OF THE NATIONAL ASSESSMENT GOVERNING BOARD AD HOC COMMITTEE ON NAEP TESTING AND REPORTING OF STUDENTS WITH DISABILITIES (SD) AND ENGLISH
NCEO Technical Report 27
 Home About Publications Special Topics Presentations State Policies Accommodations Bibliography Teleconferences Tools Related Sites Interpreting Trends in the Performance of Special Education Students
Alvin Elementary Campus Improvement Plan
 Goal 1: Student academic performance on state and national exams will reflect continuous improvement and excellence in learning. 1.1 Maintain 90% or higher of students in grades 3 through 5 passing the
GradinG SyStem IE-SMU MBA
 Grading System IE-SMU MBA With the aim of encouraging students to reach their full potential in a healthy competitive environment and to obtain a rigorous information about their performance during the
National Survey of Student Engagement (NSSE) Temple University 2016 Results
 Temple University 2016 Results") Introduction The National Survey of Student Engagement (NSSE) is administered by hundreds of colleges and universities every year (560 in 2016), and is designed to measure the amount of time and effort
Introduction The National Survey of Student Engagement (NSSE) is administered by hundreds of colleges and universities every year (560 in 2016), and is designed to measure the amount of time and effort
Colorado State University Department of Construction Management. Assessment Results and Action Plans
 Colorado State University Department of Construction Management Assessment Results and Action Plans Updated: Spring 2015 Table of Contents Table of Contents... 2 List of Tables... 3 Table of Figures...
Omak School District WAVA K-5 Learning Improvement Plan
 Omak School District WAVA K-5 Learning Improvement Plan 2015-2016 Vision Omak School District is committed to success for all students and provides a wide range of high quality instructional programs and
What Is The National Survey Of Student Engagement (NSSE)?
?") National Survey of Student Engagement (NSSE) 2000 Results for Montclair State University What Is The National Survey Of Student Engagement (NSSE)? US News and World Reports Best College Survey is due next
National Survey of Student Engagement (NSSE) 2000 Results for Montclair State University What Is The National Survey Of Student Engagement (NSSE)? US News and World Reports Best College Survey is due next
Exams: Accommodations Guidelines. English Language Learners
 PSSA Accommodations Guidelines for English Language Learners (ELLs) [Arlen: Please format this page like the cover page for the PSSA Accommodations Guidelines for Students PSSA with IEPs and Students with
Undergraduates Views of K-12 Teaching as a Career Choice
 Undergraduates Views of K-12 Teaching as a Career Choice A Report Prepared for The Professional Educator Standards Board Prepared by: Ana M. Elfers Margaret L. Plecki Elise St. John Rebecca Wedel University
UK Institutional Research Brief: Results of the 2012 National Survey of Student Engagement: A Comparison with Carnegie Peer Institutions
 UK Institutional Research Brief: Results of the 2012 National Survey of Student Engagement: A Comparison with Carnegie Peer Institutions November 2012 The National Survey of Student Engagement (NSSE) has
Katy Independent School District Davidson Elementary Campus Improvement Plan
 Katy Independent School District 2017-2018 Campus Improvement Plan Accountability Rating: Met Standard Generated by Plan4Learningcom 1 of 26 Mission Statement Together with our community, the Davidson
Katy Independent School District Paetow High School Campus Improvement Plan
 Katy Independent School District 2017-2018 Campus Improvement Plan Generated by Plan4Learningcom 1 of 15 Table of Contents Comprehensive Needs Assessment 3 Demographics 3 Student Academic Achievement 4
Higher Education / Student Affairs Internship Manual
 ELMP 8981 & ELMP 8982 Administrative Internship Higher Education / Student Affairs Internship Manual College of Education & Human Services Department of Education Leadership, Management & Policy Table
REGISTRATION. Enrollment Requirements. Academic Advisement for Registration. Registration. Sam Houston State University 1
 Sam Houston State University 1 REGISTRATION Enrollment Requirements (p. 1) Academic Advisement for Registration (p. 1) Registration (p. 1) Change of Schedule (Adding and Dropping Courses) (p. 2) Resignations
Effective practices of peer mentors in an undergraduate writing intensive course
 Effective practices of peer mentors in an undergraduate writing intensive course April G. Douglass and Dennie L. Smith * Department of Teaching, Learning, and Culture, Texas A&M University This article
Upward Bound Program
 SACS Preparation Division of Student Affairs Upward Bound Program REQUIREMENTS: The institution provides student support programs, services, and activities consistent with its mission that promote student
An Empirical Analysis of the Effects of Mexican American Studies Participation on Student Achievement within Tucson Unified School District
 An Empirical Analysis of the Effects of Mexican American Studies Participation on Student Achievement within Tucson Unified School District Report Submitted June 20, 2012, to Willis D. Hawley, Ph.D., Special
AMERICA READS*COUNTS PROGRAM EVALUATION. School Year
 AMERICA READS*COUNTS PROGRAM EVALUATION School Year 2014-15 October 2015 ABOUT THE LEDUC CENTER FOR CIVIC ENGAGEMENT The University of Massachusetts Dartmouth seeks to prepare students for life as active
NORTH CAROLINA VIRTUAL PUBLIC SCHOOL IN WCPSS UPDATE FOR FALL 2007, SPRING 2008, AND SUMMER 2008
 E&R Report No. 08.29 February 2009 NORTH CAROLINA VIRTUAL PUBLIC SCHOOL IN WCPSS UPDATE FOR FALL 2007, SPRING 2008, AND SUMMER 2008 Authors: Dina Bulgakov-Cooke, Ph.D., and Nancy Baenen ABSTRACT North
The Condition of College & Career Readiness 2016
 The Condition of College and Career Readiness This report looks at the progress of the 16 ACT -tested graduating class relative to college and career readiness. This year s report shows that 64% of students
Connecting Academic Advising and Career Advising. Advisory Board for Advisor Training
 Connecting Academic Advising and Career Advising Advisory Board for Advisor Training Committee Team Members Susan Koenig, L&S Academic Deans' Office (Co-chair) Shaylea Stensven, L&S Career Services (Co-chair)
ADMISSION TO THE UNIVERSITY
 ADMISSION TO THE UNIVERSITY William Carter, Director of Admission College Hall 140. MSC 128. Extension 2315. Texas A&M University-Kingsville adheres to high standards of academic excellence and admits
Senior Parent Meeting What s next?
 Senior Parent Meeting What s next? { 2017 Agenda Introductions Graduation Plans and Requirements Mega Lunch EOC Testing Exemption Policy College Planning SAT, ACT, TSI, AP Exams Paying for College Free/Reduced
Instructional Intervention/Progress Monitoring (IIPM) Model Pre/Referral Process. and. Special Education Comprehensive Evaluation.
 Model Pre/Referral Process. and. Special Education Comprehensive Evaluation.") Instructional Intervention/Progress Monitoring (IIPM) Model Pre/Referral Process and Special Education Comprehensive Evaluation for Culturally and Linguistically Diverse (CLD) Students Guidelines and Resources
Instructional Intervention/Progress Monitoring (IIPM) Model Pre/Referral Process and Special Education Comprehensive Evaluation for Culturally and Linguistically Diverse (CLD) Students Guidelines and Resources
Calculators in a Middle School Mathematics Classroom: Helpful or Harmful?
 University of Nebraska - Lincoln DigitalCommons@University of Nebraska - Lincoln Action Research Projects Math in the Middle Institute Partnership 7-2008 Calculators in a Middle School Mathematics Classroom:
Probability and Statistics Curriculum Pacing Guide
 Unit 1 Terms PS.SPMJ.3 PS.SPMJ.5 Plan and conduct a survey to answer a statistical question. Recognize how the plan addresses sampling technique, randomization, measurement of experimental error and methods
Peer Influence on Academic Achievement: Mean, Variance, and Network Effects under School Choice
 Megan Andrew Cheng Wang Peer Influence on Academic Achievement: Mean, Variance, and Network Effects under School Choice Background Many states and municipalities now allow parents to choose their children
Pathways to College Preparatory Advanced Academic Offerings in the Anchorage School District
 Pathways to College Preparatory Advanced Academic Offerings in the Anchorage School District Prepared by: Rosyland Frazier Diane Hirshberg Prepared for: CITC s Anchorage Realizing Indigenous Student Excellence
Statistical Peers for Benchmarking 2010 Supplement Grade 11 Including Charter Schools NMSBA Performance 2010
 Statistical Peers for Benchmarking 2010 Supplement Grade 11 Including Charter Schools NMSBA Performance 2010 September 2010 River Dunavin 1 ALBUQUERQUE PUBLIC SCHOOLS BOARD OF EDUCATION PAULA MAES Vice
Basic Skills Initiative Project Proposal Date Submitted: March 14, Budget Control Number: (if project is continuing)
") Basic Skills Initiative Project Proposal 2016-2017 Date Submitted: March 14, 2016 Check One: New Proposal: Continuing Project: X Budget Control Number: (if project is continuing) Control # 87-413 - EOPS
Basic Skills Initiative Project Proposal 2016-2017 Date Submitted: March 14, 2016 Check One: New Proposal: Continuing Project: X Budget Control Number: (if project is continuing) Control # 87-413 - EOPS
08-09 DATA REVIEW AND ACTION PLANS Candidate Reports
 08-09 DATA REVIEW AND ACTION PLANS Candidate Reports Data Observations Implications for Change Action for Change Admitted to TEP Only ~24% of students Recruit more secondary majors Develop recruitment
Cooper Upper Elementary School
 LIVONIA PUBLIC SCHOOLS http://cooper.livoniapublicschools.org 215-216 Annual Education Report BOARD OF EDUCATION 215-16 Colleen Burton, President Dianne Laura, Vice President Tammy Bonifield, Secretary
Quality Teaching for English Learners (QTEL) Impact Study
 Impact Study") Quality Teaching for English Learners (QTEL) Impact Study June 2012 Quality Teaching for English Learners (QTEL) Impact Study A collaboration of the Quality Teaching for English Learners initiative and
Quality Teaching for English Learners (QTEL) Impact Study June 2012 Quality Teaching for English Learners (QTEL) Impact Study A collaboration of the Quality Teaching for English Learners initiative and
Implementing an Early Warning Intervention and Monitoring System to Keep Students On Track in the Middle Grades and High School
 Implementing an Early Warning Intervention and Monitoring System to Keep Students On Track in the Middle Grades and High School National High School Center Facilitator: Joseph Harris, Ph.D. Presenters:
Linking the Common European Framework of Reference and the Michigan English Language Assessment Battery Technical Report
 Linking the Common European Framework of Reference and the Michigan English Language Assessment Battery Technical Report Contact Information All correspondence and mailings should be addressed to: CaMLA
Math Pathways Task Force Recommendations February Background
 Math Pathways Task Force Recommendations February 2017 Background In October 2011, Oklahoma joined Complete College America (CCA) to increase the number of degrees and certificates earned in Oklahoma.
EDUCATIONAL ATTAINMENT
 EDUCATIONAL ATTAINMENT By 2030, at least 60 percent of Texans ages 25 to 34 will have a postsecondary credential or degree. Target: Increase the percent of Texans ages 25 to 34 with a postsecondary credential.
Running head: DEVELOPING MULTIPLICATION AUTOMATICTY 1. Examining the Impact of Frustration Levels on Multiplication Automaticity.
 Running head: DEVELOPING MULTIPLICATION AUTOMATICTY 1 Examining the Impact of Frustration Levels on Multiplication Automaticity Jessica Hanna Eastern Illinois University DEVELOPING MULTIPLICATION AUTOMATICITY
Standardized Assessment & Data Overview December 21, 2015
 Standardized Assessment & Data Overview December 21, 2015 Peters Township School District, as a public school entity, will enable students to realize their potential to learn, live, lead and succeed. 2
CONSISTENCY OF TRAINING AND THE LEARNING EXPERIENCE
 CONSISTENCY OF TRAINING AND THE LEARNING EXPERIENCE CONTENTS 3 Introduction 5 The Learner Experience 7 Perceptions of Training Consistency 11 Impact of Consistency on Learners 15 Conclusions 16 Study Demographics
STUDENT LEARNING ASSESSMENT REPORT
 STUDENT LEARNING ASSESSMENT REPORT PROGRAM: Sociology SUBMITTED BY: Janine DeWitt DATE: August 2016 BRIEFLY DESCRIBE WHERE AND HOW ARE DATA AND DOCUMENTS USED TO GENERATE THIS REPORT BEING STORED: The
A Guide to Adequate Yearly Progress Analyses in Nevada 2007 Nevada Department of Education
 A Guide to Adequate Yearly Progress Analyses in Nevada 2007 Nevada Department of Education Note: Additional information regarding AYP Results from 2003 through 2007 including a listing of each individual
Bellehaven Elementary
 Overall istrict: Albuquerque Public Schools Grade Range: KN-05 Code: 1229 School Grade Report Card 2013 Current Standing How did students perform in the most recent school year? are tested on how well
Cuero Independent School District
 Cuero Independent School District Texas Superintendent: Henry Lind Primary contact: Debra Baros, assistant superintendent* 1,985 students, prek-12, rural District Description Cuero Independent School District
2012 New England Regional Forum Boston, Massachusetts Wednesday, February 1, More Than a Test: The SAT and SAT Subject Tests
 2012 New England Regional Forum Boston, Massachusetts Wednesday, February 1, 2012 More Than a Test: The SAT and SAT Subject Tests 1 Presenters Chris Lucier Vice President for Enrollment Management, University
STEM Academy Workshops Evaluation
 OFFICE OF INSTITUTIONAL RESEARCH RESEARCH BRIEF #882 August 2015 STEM Academy Workshops Evaluation By Daniel Berumen, MPA Introduction The current report summarizes the results of the research activities
Testing for the Homeschooled High Schooler: SAT, ACT, AP, CLEP, PSAT, SAT II
 Testing for the Homeschooled High Schooler: SAT, ACT, AP, CLEP, PSAT, SAT II Does my student *have* to take tests? What exams do students need to take to prepare for college admissions? What are the differences
Closing the. Higher. Achievement. Education. Gap: Strategies. Ecosystems. from the Field
 Closing the Higher Achievement Education Gap: Strategies Ecosystems from the Field Bill Moses Managing Director Kresge Foundation The Kresge Foundation 2016 ACCE Annual Convention Savannah Higher Education
Aalya School. Parent Survey Results
 Aalya School Parent Survey Results 2016-2017 Parent Survey Results Academic Year 2016/2017 September 2017 Research Office The Research Office conducts surveys to gather qualitative and quantitative data
National Survey of Student Engagement Spring University of Kansas. Executive Summary
 National Survey of Student Engagement Spring 2010 University of Kansas Executive Summary Overview One thousand six hundred and twenty-one (1,621) students from the University of Kansas completed the web-based
STUDENT PERCEPTION SURVEYS ACTIONABLE STUDENT FEEDBACK PROMOTING EXCELLENCE IN TEACHING AND LEARNING
 1 STUDENT PERCEPTION SURVEYS ACTIONABLE STUDENT FEEDBACK PROMOTING EXCELLENCE IN TEACHING AND LEARNING Presentation to STLE Grantees: December 20, 2013 Information Recorded on: December 26, 2013 Please
Abu Dhabi Indian. Parent Survey Results
 Abu Dhabi Indian Parent Survey Results 2016-2017 Parent Survey Results Academic Year 2016/2017 September 2017 Research Office The Research Office conducts surveys to gather qualitative and quantitative
School Leadership Rubrics
 School Leadership Rubrics The School Leadership Rubrics define a range of observable leadership and instructional practices that characterize more and less effective schools. These rubrics provide a metric
Cooper Upper Elementary School
 LIVONIA PUBLIC SCHOOLS www.livoniapublicschools.org/cooper 213-214 BOARD OF EDUCATION 213-14 Mark Johnson, President Colleen Burton, Vice President Dianne Laura, Secretary Tammy Bonifield, Trustee Dan
Effectiveness of McGraw-Hill s Treasures Reading Program in Grades 3 5. October 21, Research Conducted by Empirical Education Inc.
 Effectiveness of McGraw-Hill s Treasures Reading Program in Grades 3 5 October 21, 2010 Research Conducted by Empirical Education Inc. Executive Summary Background. Cognitive demands on student knowledge
Abu Dhabi Grammar School - Canada
 Abu Dhabi Grammar School - Canada Parent Survey Results 2016-2017 Parent Survey Results Academic Year 2016/2017 September 2017 Research Office The Research Office conducts surveys to gather qualitative
Your Guide to. Whole-School REFORM PIVOT PLAN. Strengthening Schools, Families & Communities
 Your Guide to Whole-School REFORM PIVOT PLAN Strengthening Schools, Families & Communities Why a Pivot Plan? In order to tailor our model of Whole-School Reform to recent changes seen at the federal level
Longitudinal Analysis of the Effectiveness of DCPS Teachers
 F I N A L R E P O R T Longitudinal Analysis of the Effectiveness of DCPS Teachers July 8, 2014 Elias Walsh Dallas Dotter Submitted to: DC Education Consortium for Research and Evaluation School of Education
ABET Criteria for Accrediting Computer Science Programs
 ABET Criteria for Accrediting Computer Science Programs Mapped to 2008 NSSE Survey Questions First Edition, June 2008 Introduction and Rationale for Using NSSE in ABET Accreditation One of the most common
5 Programmatic. The second component area of the equity audit is programmatic. Equity
 5 Programmatic Equity It is one thing to take as a given that approximately 70 percent of an entering high school freshman class will not attend college, but to assign a particular child to a curriculum
Evaluation of a College Freshman Diversity Research Program
 Evaluation of a College Freshman Diversity Research Program Sarah Garner University of Washington, Seattle, Washington 98195 Michael J. Tremmel University of Washington, Seattle, Washington 98195 Sarah
Garfield High School
 Garfield High 2-Year limate Survey Report High Student Survey Environment #Positive #Responses %Positive District #Positive #Responses %Positive District My teachers set clear rules for how to behave in
What effect does science club have on pupil attitudes, engagement and attainment? Dr S.J. Nolan, The Perse School, June 2014
 What effect does science club have on pupil attitudes, engagement and attainment? Introduction Dr S.J. Nolan, The Perse School, June 2014 One of the responsibilities of working in an academically selective
Table of Contents PROCEDURES
 1 Table of Contents PROCEDURES 3 INSTRUCTIONAL PRACTICE 3 INSTRUCTIONAL ACHIEVEMENT 3 HOMEWORK 4 LATE WORK 5 REASSESSMENT 5 PARTICIPATION GRADES 5 EXTRA CREDIT 6 ABSENTEEISM 6 A. Enrolled Students 6 B.
STA 225: Introductory Statistics (CT)
") Marshall University College of Science Mathematics Department STA 225: Introductory Statistics (CT) Course catalog description A critical thinking course in applied statistical reasoning covering basic
Marshall University College of Science Mathematics Department STA 225: Introductory Statistics (CT) Course catalog description A critical thinking course in applied statistical reasoning covering basic
Gifted & Talented. Dyslexia. Special Education. Updates. March 2015!
 Gifted & Talented Dyslexia Special Education Updates Gifted & Talented Where Are We Now? Program of Services! Identification! Professional Development! Communication! GT Update Percent of Students in RISD
Undergraduate Admissions Standards for the Massachusetts State University System and the University of Massachusetts. Reference Guide April 2016
 Undergraduate Admissions Standards for the Massachusetts State University System and the University of Massachusetts Reference Guide April 2016 Massachusetts Department of Higher Education One Ashburton
Eastbury Primary School
 Eastbury Primary School Dawson Avenue, Barking, IG11 9QQ Inspection dates 26 27 September 2012 Overall effectiveness Previous inspection: Satisfactory 3 This inspection: Requires improvement 3 Achievement
Expanded Learning Time Expectations for Implementation
 I. ELT Design is Driven by Focused School-wide Priorities The school s ELT design (schedule, staff, instructional approaches, assessment systems, budget) is driven by no more than three school-wide priorities,