2009 Council of Chief State School Officers and Pearson Foundation Finland Delegation Pre-Reading Materials Table of Contents
|
|
|
- Derick Black
- 6 years ago
- Views:
Transcription
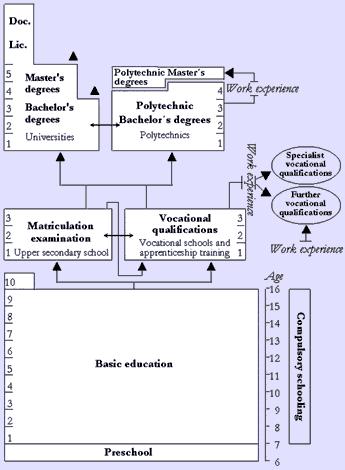
1 2009 Council of Chief State School Officers and Pearson Foundation Finland Delegation Pre-Reading Materials Table of Contents I. Finnish Educational System Diagram pg. 2 II. OECD Pisa Results and Related Documents pgs III. News Articles pgs IV. CoSN Scandinavian Report pgs
2
3 The Programme for International Student Assessment (PISA) PISA is a triennial survey of the knowledge and skills of 15-year-olds. It is the product of collaboration between participating countries and economies through the Organisation for Economic Co-operation and Development (OECD), and draws on leading international expertise to develop valid comparisons across countries and cultures. More than students from 57 countries making up close to 90% of the world economy took part in PISA The focus was on science but the assessment also included reading and mathematics and collected data on student, family and institutional factors that could help to explain differences in performance. This report summarises the main findings.
4 Contents 3 Key findings 3 Science performance 4 Reading performance 5 Mathematics performance 6 Student attitudes to science 7 School and system-level factors 9 PISA Background 10 PISA 2006 essentials 10 New in PISA Participating countries and economies 12 Assessing science 12 How PISA 2006 measured student performance in science 13 Science questions, student scores and proficiency levels 15 A sample of PISA science questions 16 Identifying scientific issues 17 Explaining scientific phenomena 18 Using scientific evidence 19 Science performance 19 A profile of student performance in science 19 Student proficiency in science 21 Average student performance 23 In which aspects of science are students stronger or weaker in different countries? 26 Attitudes to science 26 A profile of student engagement in science 26 The importance of attitudes to science 26 A new way of assessing attitudes 26 Do students support scientific enquiry? 27 Do students believe they can succeed in science? 27 Are students interested in science? 29 Do students feel responsible towards resources and the environment? 30 Gender differences in attitudes to science 31 Quality and equity 31 Results by school and student background 31 What role do school differences play? 33 Can socio-economic equity be reconciled with school quality? 34 What do patterns of school and socio-economic differences imply for policy in different countries? 38 School and system-level factors 38 The impact of school and system practices, policies and resources 38 Admitting, selecting and grouping 39 Parental pressure and choice 40 Accountability policies 41 School autonomy 42 School resources 43 Educational quality and equity: factors associated with student performance 46 Reading performance 46 Reading performance in PISA 2006 and changes since PISA Reading proficiency 48 Average reading scores 48 Changes since PISA Gender differences 51 Mathematics performance 51 Mathematics performance in PISA 2006 and changes since PISA Mathematics proficiency 52 Average mathematics scores 52 Changes since PISA Gender differences PISA 2006: Science Competencies for Tomorrow s World Executive Summary OECD 2007
5
6 Key findings Science performance Finland, with an average of 563 score points, was the highest-performing country on the PISA 2006 science scale. Six other high-scoring countries had mean scores of 530 to 542 points: Canada, Japan and New Zealand and the partner countries/economies Hong Kong-China, Chinese Taipei and Estonia. Australia, the Netherlands, Korea, Germany, the United Kingdom, the Czech Republic, Switzerland, Austria, Belgium and Ireland, and the partner countries/economies Liechtenstein, Slovenia and Macao-China also scored above the OECD average of 500 score points. On average across OECD countries, 1.3% of 15-year-olds reached Level 6 of the PISA 2006 science scale, the highest proficiency level. These students could consistently identify, explain and apply scientific knowledge, and knowledge about science, in a variety of complex life situations. In New Zealand and Finland this figure was at least 3.9%, three times the OECD average. In the United Kingdom, Australia, Japan and Canada, as well as the partner countries/economies Liechtenstein, Slovenia and Hong Kong-China, between 2 and 3% reached Level 6. The number of students at Level 6 cannot be reliably predicted from a country s overall performance. Korea was among the highest-performing countries on the PISA science scale, with an average of 522 score points, while the United States performed below the OECD average, with a score of 489. Nevertheless, the United States and Korea had similar percentages of students at Level 6. Over one in five students in Finland (21%) and over one in six in New Zealand (18%) reached at least Level 5. In Japan, Australia and Canada, and the partner economies Hong Kong-China and Chinese Taipei, this figure was between 14 and 16% (OECD average 9%). By contrast, 15 of the countries in the survey had fewer than 1% of students reaching either Level 5 or Level 6, and nearly 25 countries had 5% or fewer reaching the two highest levels. The number of students at very low proficiency is also an important indicator not necessarily in relation to the development of future scientific personnel but in terms of citizens ability to participate fully in society and in the labour market. At Level 2, students start to demonstrate the science competencies that will enable them to participate actively in life situations related to science and technology. Across the OECD, on average 19.2% were classified as below Level 2, including 5.2% below Level 1. Males and females showed no difference in average science performance in the majority of countries, including 22 of the 30 OECD countries. In 12 countries, females outperformed males, on average, while males outperformed females in 8 countries. Most of these differences were small. In no OECD country was the gender difference larger than 12 points on the science scale. This is different from reading and mathematics where significant gender differences were observed. However, similarities in average performance mask certain gender differences: In most countries, females were stronger in identifying scientific issues, while males were stronger PISA 2006: Science Competencies for Tomorrow s World Executive Summary OECD 2007
7 at explaining phenomena scientifically. Males performed substantially better than females when answering physics questions. Last but not least, in most countries more females attend higher performing, academically oriented tracks and schools than do males. As a result of this, in many countries gender differences in science were substantial within schools or programmes, even if they appeared small overall. On average across OECD countries, around one-third of all variation in student performance (33%) was between schools, but this varied widely from one country to another. In Germany and the partner country Bulgaria performance variation between schools was about twice the OECD average. It was over one and a half times the average in the Czech Republic, Austria, Hungary, the Netherlands, Belgium, Japan and Italy, and the partner countries Slovenia, Argentina and Chile. In most of these countries, the grouping or tracking of students affected this result. In other countries, school differences played only a minor part in performance variation. In Finland less than 5% of the overall performance variation among OECD countries lay between schools and in Iceland and Norway it was still less than 10%. Other countries in which performance was not very closely related to the schools in which students were enrolled included Sweden, Poland, Spain, Denmark and Ireland as well as the partner countries Latvia and Estonia. Considering that Finland also showed the highest overall performance in science suggests that Finnish parents can rely on high and consistent performance standards across schools in the entire education system. Students socio-economic differences accounted for a significant part of betweenschool differences in some countries. This factor contributed most to between-school performance variation in the United States, the Czech Republic, Luxembourg, Belgium, the Slovak Republic, Germany, Greece and New Zealand, and the partner countries Bulgaria, Chile, Argentina and Uruguay. Less than 10% of the variation in student performance was explained by student background in five of the seven countries with the highest mean science scores of above 530 points (Finland, Canada and Japan, and the partner countries/economies Hong Kong- China and Estonia). There is no relationship between the size of countries and the average performance of 15- year-olds in PISA. There is also no cross-country relationship between the proportion of foreign-born students in countries and the average performance of countries. Last but not least, an analysis undertaken in the context of the PISA 2003 assessment showed that there were few differences among countries in students test motivation. Reading performance Korea, with 556 score points, was the highest-performing country in reading. Finland followed second with 547 points and the partner economy Hong Kong-China third with 536 points. Canada and New Zealand had mean reading scores between 520 and 530, and the following countries still scored significantly above the OECD average of 492 scorepoints: Ireland, Australia, Poland, Sweden, the Netherlands, Belgium and Switzerland, and the partner countries Liechtenstein, Estonia and Slovenia. OECD 2007 Executive Summary PISA 2006: Science Competencies for Tomorrow s World
8 Reading is the area with the largest gender gaps. In all OECD countries in PISA 2006, females performed better in reading on average than males. In twelve countries, the gap was at least 50 score points. In Greece and Finland, females were 57 and 51 points ahead respectively, and the gap was 50 to 66 points in the partner countries Qatar, Bulgaria, Jordan, Thailand, Argentina, Slovenia, Lithuania, Kyrgyzstan, Latvia and Croatia. Across the OECD area, reading performance generally remained flat between PISA 2000 and PISA This needs to be seen in the context of significant rises in expenditure levels. Between 1995 and 2004 expenditure per primary and secondary student increased by 39% in real terms, on average across OECD countries. However, two OECD countries (Korea and Poland) and five partner countries/economies (Chile, Liechtenstein, Indonesia, Latvia and Hong Kong-China) have seen significant rises in reading performance since PISA Korea increased its reading performance between PISA 2000 and PISA 2006 by 31 score points, mainly by raising performance standards among the better performing students. Hong Kong-China has increased its reading performance by 11 score points since Poland increased its reading performance by 17 score points between PISA 2000 and PISA 2003 and by another 11 score points between PISA 2003 and PISA 2006 and now performs at 508 score points, for the first time clearly above the OECD average. Between the PISA 2000 and PISA 2003 assessments, Poland raised its average performance mainly through increases at the lower end of the performance distribution. As a result, in PISA 2003 fewer than 5% of students fell below performance standards that had not been reached by the bottom 10% of Polish students in PISA Since PISA 2003, performance in Poland has risen more evenly across the performance spectrum. The other countries that have seen significant performance increases in reading between PISA 2000 and PISA 2006 Chile (33 score points), Liechtenstein (28 score points), Indonesia (22 score points) and Latvia (21 score points) perform, with the exception of Liechtenstein, significantly below the OECD average. A number of countries saw a decline in their reading performance between PISA 2000 and PISA 2006, comprising nine OECD countries (in descending order) Spain, Japan, Iceland, Norway, Italy, France, Australia, Greece and Mexico, and the partner countries Argentina, Romania, Bulgaria, the Russian Federation and Thailand. Mathematics performance Finland and Korea, and the partners Chinese Taipei and Hong Kong-China, outperformed all other countries/economies in PISA Other countries with mean performances significantly above the OECD average were the Netherlands, Switzerland, Canada, Japan, New Zealand, Belgium, Australia, Denmark, the Czech Republic, Iceland and Austria, as well as the partner countries/economies Macao- China, Liechtenstein, Estonia and Slovenia. In Mexico mathematics performance was 20 score points higher in PISA 2006 than in PISA 2003 but at 406 score points it is still well below the OECD average. In Greece, mathematics performance was 14 score points higher in PISA 2006 than in PISA PISA 2006: Science Competencies for Tomorrow s World Executive Summary OECD 2007
9 In Indonesia, mathematics performance was 31 score points higher in PISA 2006 than in PISA 2003 and in Brazil it was 13 score points higher in PISA 2006 than in PISA Mathematics performance in 2006 was significantly lower in France (15 score points), Japan (11 score points), Iceland (10 score points) and Belgium (9 score points), and in the partner country Liechtenstein (11 score points). Overall gender differences in mathematics were less than one-third as large as for reading, 11 points on average across OECD countries. This has not changed since PISA Student attitudes to science Ninety-three per cent of students reported that science was important for understanding the natural world, 92% said that advances in science and technology usually improved people s living conditions, but only 57% said that science was very relevant to them personally. A strong acceptance by students that science is important for understanding nature and improving living conditions extends across all countries in the survey. However, this was mirrored to a much lesser extent in students responses to the wider socio-economic benefits of science. On average across OECD countries, 25% of students (and over 40% in Iceland and Denmark) did not agree with the statement advances in science usually bring social benefits. The majority of students reported that they were motivated to learn science, but only a minority reported interest in a career involving science: 72% said that it was important for them to do well in science; 67% said that they enjoyed acquiring new knowledge in science; 56% said that science was useful for further studies; but only 37% said they would like to work in a career involving science and 21% said that would like to spend their life doing advanced science. Twenty-one per cent said they regularly watched television programmes about science; 13% said they regularly visited websites about science; 8% said that they regularly borrowed books on science. Within each country, students who reported that they enjoyed learning science were more likely to have higher levels of science performance. While this does not show a causal link, the results suggest that students with greater interest and enjoyment of science are more willing to invest the effort needed to do well. Students with a more advantaged socio-economic background were more likely to show a general interest in science, and this relationship was strongest in Ireland, France, Belgium and Switzerland. One significant feature of a student s background was whether they had a parent in a science-related career. On average across OECD countries, 73% of the students said that they were aware of the consequences of clearing forests for other land use; 58% said that they were aware of the increase of greenhouse gases in the atmosphere; and 35% said that they were aware of the use of genetically modified organisms (GMOs). However, awareness of environmental issues varies by country, and within each country is stronger among students who perform better in science. There was some degree of pessimism among the students about the future of the natural environment: On average across OECD countries, only 21% of students reported that they believed the problems associated with energy shortages would improve over the next 20 years, 18% considered this to be the case for water shortages, 16% for air pollution, 15% for nuclear waste, 14% for the extinction of plants and animals and 13% for the clearing OECD 2007 Executive Summary PISA 2006: Science Competencies for Tomorrow s World
10 of forests for other land use. Students with higher performance in science, who reported greater awareness of environmental issues, also reported being more pessimistic about the future of the environment. Gender differences in attitudes to science were most prominent in Germany, Iceland, Japan, Korea, the Netherlands and the United Kingdom, and in the partners Chinese Taipei, Hong Kong-China and Macao-China, where males reported more positive characteristics on at least five aspects of attitude. Of the attitudes measured in PISA, the largest gender difference was observed in students self-concept regarding science. In 22 out of the 30 OECD countries in the survey, males thought significantly more highly of their own science abilities than did females. School and system-level factors Institutional tracking is closely related to the impact which socio-economic background had on student performance. The earlier that students are stratified into separate institutions or programmes, the stronger the impact which the school s average socio-economic background had on performance. Also schools that divided students by ability for all subjects tended to have lower student performance, on average. On average across the OECD, students in private schools outperformed students in public schools in 21 countries, while public schools outperformed private ones in four countries. The picture changed, however, when the socio-economic background of students and schools was taken into account. Public schools then had an advantage of 12 score points over private schools, on average across OECD countries. That said, private schools may still pose an attractive alternative for parents looking to maximise the benefits for their children, including those benefits that are conferred to students through the socio-economic level of schools intake. Across OECD countries, 60% of students were enrolled in schools whose principals reported competing with two or more other schools in the local area. Across countries, having a larger number of schools that compete for students is associated with better results, over and above the relationship with student background. Parents surveyed in 16 countries reported generally to be positive and well-informed about their children s schools, but this varied considerably across countries. For example, fewer than 50% of parents in Germany, but over 90% in Poland and the partner county Colombia, reported that the school provided regular and useful information on their child s progress. On average across OECD countries, the majority of students (54%) were enrolled in schools where school principals reported giving feedback to parents on their child s performance relative to the performance of other students at the school. In many OECD countries, the reporting of student performance information to parents is more commonly done relative to national benchmarks than relative to other students in the school. For example, in Sweden only 12% of 15-year-olds were enrolled in schools that reported performance data to parents relative to those of other students in the school, while 94% of 15-year-olds were enrolled in schools that reported data relative to national or regional standards or PISA 2006: Science Competencies for Tomorrow s World Executive Summary OECD

11 benchmarks. The pattern was similar in Japan, Finland, Norway, the United Kingdom and New Zealand, as well as the partner country Estonia. In the United Kingdom and the United States, school principals of more than 90% of 15-year-olds enrolled in school reported that school achievement data were posted publicly; in the Netherlands, as well as the partner countries Montenegro and Azerbaijan, this was still the case for more than 80%. In contrast, in Finland, Belgium, Switzerland and Austria, as well as in the partner country Argentina, this was the case for less than 10% of the students and in Japan, Spain, Germany, Korea and Ireland, and in the partner countries/economies Macao-China, Uruguay, Indonesia and Tunisia, it held for less than 20%. There are considerable differences in the scores of students in countries where schools posted their results publicly. Some of these differences were associated with other features of schools and school systems that tended to go along with strong accountability arrangements and with the socio-economic background of students in schools that had such arrangements. However, once these factors are taken into account, there still remains a significant positive association between schools making their achievement data public and having stronger results. Within countries, students in schools that exercise greater autonomy do not on average get better results, once the socio-economic context is accounted for. However, students in countries where autonomy is more common tend to do better in the science assessment, regardless of whether or not they themselves are enrolled in relatively autonomous schools. This is true for the aspects of school autonomy in formulating the school budget and deciding on budget allocations within the school, even after accounting for socioeconomic background factors, as well as other school and system-level factors. Resources such as an adequate supply of teachers and quality of educational resources at school are on average across countries associated with positive student outcomes, but many of these effects are not significant after taking account of the fact that students from a more advantaged socio-economic background tend to get access to more educational resources. After accounting for this, there remains a significant association between several aspects of learning time as well as school activities to promote students learning of science and performance. OECD 2007 Executive Summary PISA 2006: Science Competencies for Tomorrow s World
12 PISA 2006 Background PISA is the most comprehensive and rigorous international programme to assess student performance and to collect data on the student, family and institutional factors that can help to explain differences in performance. Decisions about the scope and nature of the assessments and the background information to be collected are made by leading experts in participating countries, and are steered jointly by governments on the basis of shared, policy-driven interests. Substantial efforts and resources are devoted to achieving cultural and linguistic breadth and balance in the assessment materials. Stringent quality assurance mechanisms are applied in translation, sampling and data collection. As a consequence, the results of PISA have a high degree of validity and reliability, and can significantly improve understanding of the outcomes of education in the world s economically most developed countries, as well as in a growing number of countries at earlier stages of economic development. Key features of PISA include its: Policy orientation, with the design and reporting methods determined by the goal to inform educational policy and practice. Innovative approach to literacy, which is concerned with the capacity of students to extrapolate from what they have learned and to analyse and reason as they pose, solve and interpret problems in a variety of situations. The relevance of the knowledge and skills measured by PISA is confirmed by recent studies tracking young people in the years after they have been assessed by PISA. Relevance to lifelong learning, which does not limit PISA to assessing students knowledge and skills but also asks them to report on their own motivation to learn, their beliefs about themselves and their attitudes to what they are learning. Regularity, enabling countries to monitor improvements in educational outcomes in the light of other countries performances. Consideration of student performance alongside characteristics of students and schools, in order to explore some of the main features associated with educational success. Breadth of geographical coverage, with the countries and economies participating in the PISA 2006 assessment representing almost nine-tenths of the world economy. Three PISA surveys have taken place so far, in 2000, 2003 and 2006, focusing on reading, mathematics and science, respectively. This sequence will be repeated with surveys in 2009, 2012 and 2015, allowing continuous and consistent monitoring of educational outcomes. PISA will also continue to develop new assessment instruments and tools according to the needs of participating countries. This includes collecting more detailed information on educational policies and practices. It also includes making use of computer-based PISA 2006: Science Competencies for Tomorrow s World Executive Summary OECD 2007
13 assessments, not only to measure Information and Communication Technology skills but also to allow for a wider range of dynamic and interactive tasks of student knowledge and skills. PISA 2006 essentials More than students in 57 countries participated in PISA 2006, which involved a two-hour test with both open and multiple-choice tasks. All 30 OECD member countries participated, as well as 27 partner countries and economies. Nationally-representative samples were drawn, representing 20 million 15-year-olds. Students also answered a half-hour questionnaire about themselves, and their principals answered a questionnaire about their schools. In 16 countries parents completed a questionnaire about their investment in their children s education and their views on science-related issues and careers. New in PISA 2006 A detailed profile of student performance in science (in PISA 2000, the focus was on reading, and in PISA 2003, on mathematics). Measures of students attitudes to learning science, the extent to which they are aware of the life opportunities that possessing science competencies may open, and the science learning opportunities and environments which their schools offer. Measures of school contexts, instruction, student access and use of computers, and parental perceptions of students and schools. Performance changes in reading over three PISA assessments (six years) and changes in mathematics over two PISA assessments (three years). The value of PISA in monitoring performance over time is growing, although it is not yet possible to assess to what extent the observed differences are indicative of longer-term trends. With science being the main assessment area for the first time, results in PISA 2006 provide the baseline for future measures of change in this subject. 10 OECD 2007 Executive Summary PISA 2006: Science Competencies for Tomorrow s World
14 Participating countries and economies Figure 1 A map of PISA countries and economies OECD countries Partner countries and economies in PISA 2006 Partner countries and economies in previous PISA surveys or in PISA 2009 Australia Korea Argentina Liechtenstein Albania Austria Luxembourg Azerbaijan Lithuania Shanghai-China Belgium Mexico Brazil Macao-China Dominican Republic Canada Netherlands Bulgaria Montenegro Macedonia Czech Republic New Zealand Chile Qatar Moldova Denmark Norway Colombia Romania Panama Finland Poland Croatia Russian Federation Peru France Portugal Estonia Serbia Singapore Germany Slovak Republic Hong Kong-China Slovenia Trinidad and Tobago Greece Spain Indonesia Chinese Taipei Hungary Sweden Israel Thailand Iceland Switzerland Jordan Tunisia Ireland Turkey Kyrgyzstan Uruguay Italy United Kingdom Latvia Japan United States Throughout figures and tables in this summary, OECD countries are listed in black, while partner countries and economies are listed in blue. PISA 2006: Science Competencies for Tomorrow s World Executive Summary OECD
15 Assessing science How PISA 2006 measured student performance in science Today, knowledge of science and about science is more important than ever. Science is relevant to everyone s life and an understanding of science is an essential tool for people in achieving their goals. This makes how science is taught and learned especially important. PISA s assessment of students scientific knowledge and skills is rooted in the concept of scientific literacy, defined as the extent to which an individual: Possesses scientific knowledge and uses that knowledge to identify questions, acquire new knowledge, explain scientific phenomena and draw evidence-based conclusions about science-related issues. Understands the characteristic features of science as a form of human knowledge and enquiry. Shows awareness of how science and technology shape our material, intellectual and cultural environments. Engages in science-related issues and with the ideas of science, as a reflective citizen. PISA 2006 assessed students ability to perform scientific tasks in a variety of situations, ranging from those that affect their personal lives to wider issues for the community or the world. These tasks measured students performance in relation both to their science competencies and to their scientific knowledge. PISA assessed three broad science competencies: Identifying scientific issues. This required students to recognise issues that can be explored scientifically, and to recognise the key features of a scientific investigation. Explaining phenomena scientifically. Students had to apply knowledge of science in a given situation to describe or interpret phenomena scientifically and predict changes. Using scientific evidence. This meant interpreting the evidence to draw conclusions, to explain them, to identify the assumptions, evidence and reasoning that underpin them and to reflect on their implications. The PISA tasks required scientific knowledge of two kinds: Knowledge of science. This entailed an understanding of fundamental scientific concepts and theories, in core scientific areas. The four content areas covered in PISA 2006 were Physical systems, Living systems, Earth and space systems, and Technology systems, representing key aspects of understanding the natural world. Knowledge about science. This included understanding the purposes and nature of scientific enquiry and understanding scientific explanations, which are the results of scientific enquiry. One can think of enquiry as the means of science (how scientists obtain evidence) and of explanations as the goals of science (how scientists use data). 12 OECD 2007 Executive Summary PISA 2006: Science Competencies for Tomorrow s World
16 Science questions, student scores and proficiency levels PISA measures scientific literacy across a continuum from basic literacy skills through high levels of knowledge of scientific concepts and examines students capacity to use their understanding of these concepts and to think scientifically about real-life problems. In PISA 2006, students were presented a series of questions based on the kinds of scientific problems that they might encounter in their life. Examples of questions are shown on the next pages. The PISA 2006 assessment included 108 different questions at varying levels of difficulty. Usually several questions were posed about a single scientific problem described in a text or diagram. In many cases, students were required to construct a response in their own words to questions based on the text given. Sometimes they had to explain their results or to show their thought processes. Each student was awarded a score based on the difficulty of questions that he or she could reliably perform. Scores were reported for each of the three science competencies, and for overall performance in science. The science performance scales have been constructed so that the average student score in OECD countries is 500 points. In PISA 2006, about two-thirds of students scored between 400 and 600 points (i.e. a standard deviation equals 100 points). Note that a score can be used to describe both the performance of a student and the difficulty of a question. Thus, for example, a student with a score of 650 can usually be expected to complete a question with a difficulty rating of 650, as well as questions with lower difficulty ratings. Student performance scores and the difficulty of questions were also divided into six proficiency levels. As shown in Figure 2, each of these levels can be described in terms of what kinds of science competencies students have. There is also information on students strengths in performing questions in each of the areas of scientific knowledge described above. PISA 2006: Science Competencies for Tomorrow s World Executive Summary OECD
17 Figure 2 Student proficiency in science Level Lower score limit Percentage of students able to answer questions at each level or above (OECD average) 1.3% of students across the OECD can answer questions at Level 6 9.0% of students across the OECD can answer questions at least at Level % of students across the OECD can answer questions at least at Level % of students across the OECD can answer questions at least at Level % of students across the OECD can answer questions at least at Level % of students across the OECD can answer questions at least at Level 1 What students can typically do at each level on the science scale At Level 6, students can consistently identify, explain and apply scientific knowledge and knowledge about science in a variety of complex life situations. They can link different information sources and explanations and use evidence from those sources to justify decisions. They clearly and consistently demonstrate advanced scientific thinking and reasoning, and they demonstrate willingness to use their scientific understanding in support of solutions to unfamiliar scientific and technological situations. Students at this level can use scientific knowledge and develop arguments in support of recommendations and decisions that centre on personal, socio-economic, or global situations. At Level 5, students can identify the scientific components of many complex life situations, apply both scientific concepts and knowledge about science to these situations, and can compare, select and evaluate appropriate scientific evidence for responding to life situations. Students at this level can use well-developed inquiry abilities, link knowledge appropriately and bring critical insights to situations. They can construct explanations based on evidence and arguments based on their critical analysis. At Level 4, students can work effectively with situations and issues that may involve explicit phenomena requiring them to make inferences about the role of science or technology. They can select and integrate explanations from different disciplines of science or technology and link those explanations directly to aspects of life situations. Students at this level can reflect on their actions and they can communicate decisions using scientific knowledge and evidence. At Level 3, students can identify clearly described scientific issues in a range of contexts. They can select facts and knowledge to explain phenomena and apply simple models or inquiry strategies. Students at this level can interpret and use scientific concepts from different disciplines and can apply them directly. They can develop short statements using facts and make decisions based on scientific knowledge. At Level 2, students have adequate scientific knowledge to provide possible explanations in familiar contexts or draw conclusions based on simple investigations. They are capable of direct reasoning and making literal interpretations of the results of scientific inquiry or technological problem solving. At Level 1, students have such a limited scientific knowledge that it can only be applied to a few, familiar situations. They can present scientific explanations that are obvious and follow explicitly from given evidence. Source: Figure 2.8, PISA 2006: Science Competencies for Tomorrow s World. 14 OECD 2007 Executive Summary PISA 2006: Science Competencies for Tomorrow s World
18 A sample of PISA science questions The three science questions shown here illustrate the range of questions used in PISA 2006, in six different dimensions: First, they show the different competencies that students needed. The CLOTHES question involves identifying which issues can be scientifically investigated and the GREENHOUSE question relates to scientific explanations, while ACID RAIN requires understanding of how to use evidence to support a conclusion. Second, they are of different difficulty levels, ranging from the very difficult GREENHOUSE question, which requires students not only to understand scientific methods but also to deal with abstract concepts and relationships, to the much easier ACID RAIN question, where several obvious cues allow students to draw a simple conclusion. Third, they require different knowledge categories. CLOTHES involves knowledge about science (the nature of scientific enquiry) and GREENHOUSE and ACID RAIN knowledge of science ( Earth and space systems and Physical systems, respectively). Fourth, they represent three areas of scientific application, specifically Frontiers of science and technology (CLOTHES), Environment (GREENHOUSE) and Hazards (ACID RAIN). Fifth, they are drawn from different contexts. The issues they raise are of social (CLOTHES), global (GREENHOUSE) and personal (ACID RAIN) relevance. Finally, these examples show the main question types used in PISA: multiple-choice questions in simple and complex forms (ACID RAIN and CLOTHES, respectively) and an open-response question (GREENHOUSE). PISA 2006: Science Competencies for Tomorrow s World Executive Summary OECD
19 Identifying scientific issues A question of medium difficulty Clothes A team of British scientists is developing intelligent clothes that will give disabled children the power of speech. Children wearing waistcoats made of a unique electrotextile, linked to a speech synthesiser, will be able to make themselves understood simply by tapping on the touchsensitive material. The material is made up of normal cloth and an ingenious mesh of carbon-impregnated fibres that can conduct electricity. When pressure is applied to the fabric, the pattern of signals that passes through the conducting fibres is altered and a computer chip can work out where the cloth has been touched. It then can trigger whatever electronic device is attached to it, which could be no bigger than two boxes of matches. The smart bit is in how we weave the fabric and how we send signals through it and we can weave it into existing fabric designs so you cannot see it s in there, says one of the scientists. Without being damaged, the material can be washed, wrapped around objects or scrunched up. The scientist also claims it can be mass-produced cheaply. Source: Steve Farrer, Interactive fabric promises a material gift of the garb, The Australian, 10 August QUESTION Can these claims made in the article be tested through scientific investigation in the laboratory? Circle either Yes or No for each. The material can be washed without being damaged. wrapped around objects without being damaged. scrunched up without being damaged. mass-produced cheaply. Can the claim be tested through scientific investigation in the laboratory? Yes / No Yes / No Yes / No Yes / No Correct answer: Yes, Yes, Yes, No Competency: Identifying scientific issues Knowledge category: Scientific enquiry (knowledge about science) Difficulty: 567 Percentage of correct answers (OECD countries): 47.9% 16 OECD 2007 Executive Summary PISA 2006: Science Competencies for Tomorrow s World
20 Explaining scientific phenomena A difficult question Greenhouse The greenhouse effect: fact or fiction? Living things need energy to survive. The energy that sustains life on the Earth comes from the Sun, which radiates energy into space because it is so hot. A tiny proportion of this energy reaches the Earth. The Earth s atmosphere acts like a protective blanket over the surface of our planet, preventing the variations in temperature that would exist in an airless world. Most of the radiated energy coming from the Sun passes through the Earth s atmosphere. The Earth absorbs some of this energy, and some is reflected back from the Earth s surface. Part of this reflected energy is absorbed by the atmosphere. As a result of this the average temperature above the Earth s surface is higher than it would be if there were no atmosphere. The Earth s atmosphere has the same effect as a greenhouse, hence the term greenhouse effect. The greenhouse effect is said to have become more pronounced during the twentieth century. It is a fact that the average temperature of the Earth s atmosphere has increased. In newspapers and periodicals the increased carbon dioxide emission is often stated as the main source of the temperature rise in the twentieth century. A student named André becomes interested in the possible relationship between the average temperature of the Earth s atmosphere and the carbon dioxide emission on the Earth. In a library he comes across the following two graphs. Carbon dioxide emission (thousand millions of tonnes per year) Average temperature of the Earth s atmosphere ( c) Years Years André concludes from these two graphs that it is certain that the increase in the average temperature of the Earth s atmosphere is due to the increase in the carbon dioxide emission. QUESTION André persists in his conclusion that the average temperature rise of the Earth s atmosphere is caused by the increase in the carbon dioxide emission. But Jeanne thinks that his conclusion is premature. She says: Before accepting this conclusion you must be sure that other factors that could influence the greenhouse effect are constant. Name one of the factors that Jeanne means. Competency: Explaining phenomena scientifically Knowledge category: Earth and space systems (knowledge of science) Difficulty: 709 Percentage of correct answers (OECD countries): 18.9% PISA 2006: Science Competencies for Tomorrow s World Executive Summary OECD

21 Using scientific evidence An easier question ACID RAIN Below is a photo of statues called Caryatids that were built on the Acropolis in Athens more than 2500 years ago. The statues are made of a type of rock called marble. Marble is composed of calcium carbonate. In 1980, the original statues were transferred inside the museum of the Acropolis and were replaced by replicas. The original statues were being eaten away by acid rain. The effect of acid rain on marble can be modelled by placing chips of marble in vinegar overnight. Vinegar and acid rain have about the same acidity level. When a marble chip is placed in vinegar, bubbles of gas form. The mass of the dry marble chip can be found before and after the experiment. QUESTION A marble chip has a mass of 2.0 grams before being immersed in vinegar overnight. The chip is removed and dried the next day. What will the mass of the dried marble chip be? A. Less than 2.0 grams B. Exactly 2.0 grams C. Between 2.0 and 2.4 grams D. More than 2.4 grams Correct answer: A Competency: Using scientific evidence Knowledge category: Physical systems (knowledge of science) Difficulty: 460 Percentage of correct answers (OECD countries): 66.7% Attitude question: The following question, which follows immediately after a series of questions on acid rain (including the one above), is an example of how PISA 2006 explored students attitudes to the scientific issues about which they were being tested. How much interest do you have in the following information? Tick only one box in each row. High Interest Medium Interest Low Interest No Interest Knowing which human activities contribute 1 most to acid rain Learning about technologies that minimise 1 the emission of gases that cause acid rain Understanding the methods used to repair 1 buildings damaged by acid rain OECD 2007 Executive Summary PISA 2006: Science Competencies for Tomorrow s World
22 Science performance A profile of student performance in science The following results show the: Distribution of student proficiency in PISA 2006 Overall performance levels of each country Extent to which countries were relatively stronger or weaker in different aspects of science Extent of gender differences in student performance in science Student proficiency in science Students in PISA 2006 were classified at one of six proficiency levels, according to the difficulty of science tasks that they could perform (see Figure 2). Those unable to perform even the easiest PISA tasks reliably were rated as below Level 1. Table 1 shows how many reached each level in PISA How many students show a high level of proficiency in science? A workforce highly skilled in science is important to the economic well-being of countries. While basic science competencies are generally considered important for the absorption of new technology, high-level science competencies are critical for the creation of new technology and innovation. In particular for countries near the technology frontier, this implies that the share of highly educated workers in the labour force is an important determinant of economic growth and socio-economic development. PISA therefore devotes significant attention to the assessment of students at the high end of the skill distribution. On average across OECD countries, 1.3% of 15-year-olds reached Level 6 of the PISA 2006 science scale, the highest level. These students could consistently identify, explain and apply scientific knowledge, and knowledge about science, in a variety of complex life situations. A total of 9% were proficient at least at Level 5, showing that they had a well-developed capacity for scientific enquiry and were able to combine knowledge and insight appropriately in scientific tasks (Table 2.1a). 1 In PISA 2006: More than 2% of students scored at Level 6 in nine countries. In New Zealand and Finland this figure was at least 3.9%, three times the OECD average. In the United Kingdom, Australia, Japan and Canada, as well as the partner countries/economies Liechtenstein, Slovenia and Hong Kong-China, between 2 and 3% reached this highest level of science performance. 1. All table, figure and box references in parentheses and italics refer to PISA 2006: Science Competencies for Tomorrow s World. PISA 2006: Science Competencies for Tomorrow s World Executive Summary OECD
23 Table 1 Percentage of students at each proficiency level on the science scale Proficiency levels in science Below Level 1 Level 1 Level 2 Level 3 Level 4 Level 5 Level 6 Finland Estonia Hong Kong-China Canada Macao-China Korea Chinese Taipei Japan Australia Liechtenstein Netherlands New Zealand Slovenia Hungary Germany Ireland Czech Republic Switzerland Austria Sweden United Kingdom Croatia Poland Belgium Latvia Denmark Spain Slovak Republic Lithuania Iceland Norway France Luxembourg Russian Federation Greece United States Portugal Italy Israel Serbia Chile Uruguay Bulgaria Jordan Thailand Turkey Romania Montenegro Mexico Argentina Colombia Brazil Indonesia a Tunisia Azerbaijan a Qatar Kyrgyzstan a Source: OECD PISA 2006 database. Table 2.1a, PISA 2006: Science Competencies for Tomorrow s World. Countries are ranked in descending order of percentage of students at Levels 2, 3, 4, 5 and The number of students at Level 6 cannot be reliably predicted from a country s overall performance. Korea was among the highest-performing countries on the PISA science test, in terms of students performance, with an average of 522 score points, while the United States performed below the OECD average, with a score of 489. Nevertheless, the United States and Korea had similar percentages of students at Level 6 (Tables 2.1a, 2.1c) Over one in five students in Finland (21%) and over one in six in New Zealand (18%) reached at least Level 5 (OECD average 9%). In Japan, Australia and Canada, and the partners Hong Kong-China and Chinese Taipei, this figure was between 14% and 16% (Table 2.1a). 20 OECD 2007 Executive Summary PISA 2006: Science Competencies for Tomorrow s World
24 By contrast, 15 of the countries in the survey had fewer than 1% of students reaching either Level 5 or Level 6, and nearly 25 countries had 5% or fewer reaching the two highest levels. This highly uneven distribution underlines the gap between countries with a significant pool of potential future scientists and those without this advantage (Table 2.1a). How many students show a low level of proficiency in science? The number of students at very low levels of proficiency is also an important indicator not necessarily in relation to scientific personnel but in terms of citizens ability to participate fully in society and in the labour market. At Level 2, students start to demonstrate the science competencies that will enable them to participate actively in life situations related to science and technology. Across the OECD, on average 19.2% were classified as below Level 2, including 5.2% below Level 1 (Table 2.1a). In PISA 2006: The majority of students did not reach Level 2 in ten countries. These included one OECD country, Mexico (Table 2.1a). In contrast, there were five countries or economies where around 10% or fewer of students were at Level 1 or below: Finland and Canada, and the partner countries/economies Estonia, Hong Kong-China and Macao-China (Table 2.1a). Level 2 thus represents a level of basic science competency that was held by the overwhelming majority of the population in some countries (eight in ten students on average across OECD countries), but was only achieved by a minority of students in other countries (Table 2.1a). How many students show a medium level of proficiency in science? Some countries in PISA 2006 had few students at either high or low levels of proficiency. Whereas on average across OECD countries, 72% were at Levels 2, 3 or 4, in the partner economy Macao-China it was 84% and in the partner country Estonia, 81%. These countries have neither the advantages of a plentiful supply of highly proficient students nor a large problem of low proficiency. Similarly in Korea, the percentage at Level 6 (1.1%) and at Level 1 or below (11%) were both below average (Table 2.1a). In contrast, the United States was the one country where the proportion of students both at low and at high levels of proficiency were at or above the average. One in four students (24%) were at Level 1 or below, while 9% were at Level 5 or 6. Average student performance For each country, students overall performance in science can be summarised in a mean score. On the basis of the samples of students assessed by PISA, it is not always possible to say with confidence which of two countries with similar performance has a higher mean score for the whole population. However, it is possible to give a range of possible rankings within which each country falls. This range is shown in Table 2 (Table 2.1c and Figure 2.11c). PISA 2006: Science Competencies for Tomorrow s World Executive Summary OECD
25 Table 2 Range of rank of countries/economies on the science scale Statistically significantly above the OECD average Not statistically significantly different from the OECD average Statistically significantly below the OECD average Science score S.E. Science scale OECD countries Range of rank All countries/economies Upper rank Lower rank Upper rank Lower rank Finland 563 (2.0) Hong Kong-China 542 (2.5) 2 2 Canada 534 (2.0) Chinese Taipei 532 (3.6) 3 8 Estonia 531 (2.5) 3 8 Japan 531 (3.4) New Zealand 530 (2.7) Australia 527 (2.3) Netherlands 525 (2.7) Liechtenstein 522 (4.1) 6 14 Korea 522 (3.4) Slovenia 519 (1.1) Germany 516 (3.8) United Kingdom 515 (2.3) Czech Republic 513 (3.5) Switzerland 512 (3.2) Macao-China 511 (1.1) Austria 511 (3.9) Belgium 510 (2.5) Ireland 508 (3.2) Hungary 504 (2.7) Sweden 503 (2.4) Poland 498 (2.3) Denmark 496 (3.1) France 495 (3.4) Croatia 493 (2.4) Iceland 491 (1.6) Latvia 490 (3.0) United States 489 (4.2) Slovak Republic 488 (2.6) Spain 488 (2.6) Lithuania 488 (2.8) Norway 487 (3.1) Luxembourg 486 (1.1) Russian Federation 479 (3.7) Italy 475 (2.0) Portugal 474 (3.0) Greece 473 (3.2) Israel 454 (3.7) Chile 438 (4.3) Serbia 436 (3.0) Bulgaria 434 (6.1) Uruguay 428 (2.7) Turkey 424 (3.8) Jordan 422 (2.8) Thailand 421 (2.1) Romania 418 (4.2) Montenegro 412 (1.1) Mexico 410 (2.7) Indonesia 393 (5.7) Argentina 391 (6.1) Brazil 390 (2.8) Colombia 388 (3.4) Tunisia 386 (3.0) Azerbaijan 382 (2.8) Qatar 349 (0.9) Kyrgyzstan 322 (2.9) Source: OECD PISA 2006 database. Table 2.1c and Figure 2.11c, PISA 2006: Science Competencies for Tomorrow s World OECD 2007 Executive Summary PISA 2006: Science Competencies for Tomorrow s World
26 In PISA 2006: Students in Finland scored 563 points on average, compared to the OECD mean of 500. This score was an estimated 21 points above that of any other country, making Finland the highest scoring country in science (Table 2.1c and Figure 2.11c). Six other high-scoring countries had mean scores of 530 to 542 points: Canada, Japan and New Zealand and the partner countries/economies Hong Kong-China, Chinese Taipei, Estonia. Other countries scoring above the OECD mean included Australia, the Netherlands, Korea, Germany, United Kingdom, Czech Republic, Switzerland, Austria, Belgium and Ireland (Table 2.1c and Figure 2.11c). There is no relationship between the size of countries and the average performance of 15-year-olds in PISA. There is also no cross-country relationship between the proportion of foreign-born students in countries and the average performance of countries. Last but not least, an analysis undertaken in the context of the PISA 2003 assessment showed that there were few differences among countries in students test motivation. In which aspects of science are students stronger or weaker in different countries? Three areas of science competency Students in each country were in some cases relatively stronger and weaker in the three science competencies measured in PISA: Identifying scientific issues Explaining phenomena scientifically Using scientific evidence It is important, but not sufficient, for students to understand scientific theories and facts well enough to explain phenomena scientifically. They must also be able to recognise which questions can be addressed scientifically and see how results can be used, in order to apply their scientific knowledge. In some countries, students were relatively stronger at explaining phenomena scientifically than in other science competencies. Students scored 10+ points higher in explaining phenomena scientifically than overall in science in the Czech Republic, Hungary and the Slovak Republic, as well as in the partner countries/economies Azerbaijan, Jordan, Chinese Taipei, Kyrgyzstan and Bulgaria. In some countries, the reverse was true students were stronger in other science competencies than explaining phenomena scientifically. Students scored 10+ points higher in science overall than in explaining phenomena scientifically, in France and Korea and in the partner country Israel (Figures 2.14a, 2.14b). In some countries, students showed a relative strength in using scientific evidence. Students scored 10+ points higher in using scientific evidence than in science overall in Korea, France and Japan and in the partner country Liechtenstein. In some countries, students showed a relative weakness in using scientific evidence. Students scored 10+ points lower in using scientific evidence than in science overall in Norway, the Czech Republic and the Slovak Republic, and in the partner countries Azerbaijan, Kyrgyzstan, Qatar, Jordan, Bulgaria, Brazil, Romania and Serbia (Figures 2.14c, 2.14d). PISA 2006: Science Competencies for Tomorrow s World Executive Summary OECD
27 In some of these cases, the differences between performance in two different competencies were substantial. For example, in France and Korea, students scored 30 and 27 points, respectively, higher in using scientific evidence than in explaining phenomena scientifically (Tables 2.3c, 2.4c). Some countries scored substantially higher in knowledge about science, that is knowledge about the purposes and nature of scientific enquiry and of scientific explanations, than in knowledge of science, that is knowledge of the natural world as articulated in the different scientific disciplines. Students scored over 20 points higher on average in questions requiring knowledge about science in France and the partner country Israel. Students also scored 10+ points higher in such questions in Belgium, New Zealand, Australia, the Netherlands and in the partner countries Colombia, Uruguay, Argentina, Chile and Tunisia (Figure 2.18a). In other countries, knowledge of science was stronger, suggesting that the curriculum has been relatively strong on transmitting specific scientific knowledge. This was particularly marked in East European countries, whose students tend to do less well in questions relating to the understanding of the nature of scientific work and scientific thinking. Students scored over 20 points higher, on average, in questions requiring knowledge of science in the Czech Republic, Hungary and the Slovak Republic as well as in the partner countries Azerbaijan, Jordan and Kyrgyzstan (Figure 2.18a). Students also scored 10+ points higher in such questions in Norway, Poland, Sweden and Austria and in the partner countries/economies Slovenia, Chinese Taipei, Bulgaria, Estonia, Qatar, Macao-China, Serbia, and Lithuania (Figure 2.18a). Knowledge of different areas of science Students knowledge of science can be broken down further into the content areas Physical systems, Living systems, Earth and space systems. Cases where a country s performance was substantially different in one content area are shown in the following table (Figures 2.19a, 2.19b, 2.19c). Table 3 Countries where students scored on average at least 15 points higher or lower in a particular science content area than in the average of the other two Content area Students scored higher than average Students scored lower than average Earth and space systems Korea, the United States and Iceland, France, Austria, Denmark, Sweden, Luxembourg, and the partner countries/ economies, Tunisia*, Israel*, Uruguay*, Hong Kong-China, Kyrgyzstan, Jordan, Romania, Brazil, Chinese Taipei, Macao-China and Azerbaijan. Living systems Luxembourg, the United Kingdom, France, Finland and the partner countries/economies Israel, Uruguay, Jordan, Brazil, Hong Kong-China, Montenegro and Tunisia. Korea*, Iceland, the Netherlands and the partner countries Azerbaijan and Slovenia. Physical systems Hungary, the Netherlands and the partner countries Azerbaijan*, Kyrgyzstan and Tunisia Spain, Portugal and the partner country Thailand * Shows at least 30 points higher/lower. Source: OECD PISA 2006 database. Figures 2.19a, 2.19b, 2.19c, PISA 2006: Science Competencies for Tomorrow s World OECD 2007 Executive Summary PISA 2006: Science Competencies for Tomorrow s World
28 Gender differences Males and females showed no difference in average science performance in the majority of countries, including 22 of the 30 OECD countries (Table 2.1c). In 12 countries, females outperformed males, on average, while males outperformed females in 8 countries. Most of these differences were small. In no OECD country was the gender difference larger than 12 points on the science scale. Some partner countries showed larger differences. In Qatar and Jordan, females were 32 and 29 points ahead of males, respectively. These gender differences were smaller than those observed in mathematics and much smaller than those observed in reading. However, similarities in average performance mask continuing differences: Some countries showed larger gender differences in particular science competencies. In most countries, females were stronger in identifying scientific issues, while males were stronger at explaining phenomena scientifically (Tables 2.2c, 2.3c). Males performed substantially better than females when answering Physical systems questions 26 points better on average, rising to 45 points in Austria (Table 2.10). In most countries more females attend higher performing, academically oriented tracks and schools than do males. As a result of this, in many countries gender differences in science were substantial within schools or programmes, even if they appeared small overall. From a policy perspective and for teachers in classrooms gender differences in science performance therefore warrant continued attention. PISA 2006: Science Competencies for Tomorrow s World Executive Summary OECD
29 Attitudes to science A profile of student engagement in science In PISA, student attitudes, and an awareness of the life opportunities that possessing science competencies may open, are seen as key components of an individual s scientific literacy. Data were collected on students support for scientific enquiry, their self-beliefs as science learners, their interest in science and their sense of responsibility towards resources and environments. The importance of attitudes to science Issues of motivation and attitudes are particularly relevant in science, which plays a key part in today s societies and economies, but appears not always to be taken up enthusiastically by young people at school. Engagement in science is important because: Continued investment in scientific endeavour relies on broad public support, which is influenced by citizens responses to science and technology. Scientific and technological advances are important influences on nearly everyone s life. A continued supply of scientific personnel requires a proportion of the population to take a close interest in science. Attitudes at age 15 have also been shown to influence whether students continue to study science and take a career path in science. A new way of assessing attitudes PISA 2006 used a questionnaire to ask students about a variety of aspects of how they viewed science. Questions looked at students general and personal value of science, as well as their interest and enjoyment of science, plus their self-concept of their own abilities in science and whether they are motivated to use science in the future. In some cases students were asked questions about their responses to the issues about which they were being tested. This allowed attitudes to be explored in the context of students who were, at that time, engaging with science, rather than just thinking about it in the abstract. Do students support scientific enquiry? In general, students showed strong support for scientific enquiry. On average across OECD countries: 93% said that science was important for understanding the natural world (Figure 3.2). 92% said that advances in science and technology usually improved people s living conditions (Figure 3.2). 26 OECD 2007 Executive Summary PISA 2006: Science Competencies for Tomorrow s World
30 75% said that science helped them to understand things around them (Figure 3.4). However, only 57% said that science was very relevant to them personally (Figure 3.4). The strong acceptance by students that science is important for understanding nature and improving living conditions extends across all countries in the survey. This acknowledgement among young people of the importance of science was mirrored to a much lesser extent in their responses to the wider socio-economic benefits of science. On average across OECD countries, 25% of students (and over 40% in Iceland and Denmark) did not report agreeing with the statement advances in science and technology usually bring social benefits. That said, over 90% of students reported that they agreed with this statement in Korea and the partner countries/economies Thailand, Hong Kong-China, Macao-China, Chinese Taipei, Chile and Azerbaijan (Figure 3.2). Do students believe they can succeed in science? Most students expressed confidence in being able to do scientific tasks, but more so for some tasks than others. For example, on average among students in OECD countries: 76% said they could explain why earthquakes occurred more frequently in some areas than in others (Figure 3.5). 64% said they could predict how changes to an environment would affect the survival of certain species (Figure 3.5). 51% said they could discuss how new evidence could lead to a change in understanding about the possibility of life on Mars (Figure 3.5). Just under one-half of students (47%) reported that they found school science topics easy (Figure 3.7). These questions addressed students belief both in whether they can handle tasks effectively and overcome difficulties (self-efficacy in science) and in their academic abilities (selfconcept in science). Both of these aspects are important because confidence in one s abilities can feed into motivation and learning behaviours. Self-efficacy was particularly closely related to performance, even if the causal nature of this relationship cannot be established (Figure 3.6). However, as shown in Figure 3, self-efficacy was not systematically strongest in countries with the highest performance: Self-efficacy was highest in Poland, the United States, Canada and Portugal, and the partner country Jordan. Self-efficacy was lowest in Japan, Korea and Italy and the partner countries Indonesia, Azerbaijan and Romania. Are students interested in science? The majority of students reported that they were motivated to learn science, but only a minority reported taking a close interest: PISA 2006: Science Competencies for Tomorrow s World Executive Summary OECD
31 72% said that it was important for them to do well in science (Figure 3.10). 67% said that they enjoyed acquiring new knowledge in science (Figure 3.10). 67% said that science was useful to them (Figure 3.12). 56% said that science was useful for further studies (Figure 3.12). 37% said they would like to work in a career involving science (Figure 3.13). 21% said that would like to spend their life doing advanced science (Figure 3.13). 21% said they regularly watched television programmes about science (Figure 3.16). 13% said they regularly visited websites about science (Figure 3.16). 8% said that they regularly borrowed books on science (Figure 3.16). Within each country, students who reported that they enjoyed learning science were more likely to have higher levels of science performance. While this does not show a clear causal link, it is appears that students with greater interest and enjoyment of science are more willing to invest the effort needed to do well. Figure 3 Performance in science and self-efficacy in science Students reporting self-efficacy in science believed they could perform the following tasks either easily or with a bit of effort: Explain why earthquakes occur more frequently in some areas than in others; recognise the science question that underlies a newspaper report on a health issue; interpret the scientific information provided on the labelling of food items; predict how changes to an environment will affect the survival of certain species; identify the science question associated with the disposal of garbage; describe the role of antibiotics in the treatment of disease; identify the better of two explanations for the formation of acid rain; discuss how new evidence can lead you to change your understanding about the possibility of life on Mars. Score Higher mean performance in science, but fewer students reporting self-efficacy in science OECD mean Lower mean performance in science and fewer students reporting self-efficacy in science Indonesia -0.6 Japan Azerbaijan Slovenia Austria and Macao-China Romania Liechtenstein Greece Russian Federation New Zealand Korea Switzerland 15 3 Luxembourg 14 Italy Kyrgyzstan Bulgaria Montenegro Argentina Tunisia Brazil Qatar Finland Higher mean performance in science and more students reporting Hong Kong- self-efficacy in science China Australia Chinese Taipei 4 Canada 11 Czech Republic 6 United Kingdom Ireland Poland United States 12 Portugal 1 7 OECD mean Israel Chile Serbia Uruguay Jordan Turkey Mexico Thailand Colombia 1 Belgium 2 Croatia 3 Denmark 4 Estonia 5 France 6 Germany 7 Hungary 8 Iceland 9 Latvia 10 Lithuania 11 Netherlands 12 Norway 13 Slovak Republic 14 Spain 15 Sweden Lower mean performance in science, but more students reporting self-efficacy in science Mean index of self-efficacy in science Source: OECD PISA2006 database. Tables 3.3 and 2.1c, Figure 3.6, PISA 2006: Science Competencies for Tomorrow s World OECD 2007 Executive Summary PISA 2006: Science Competencies for Tomorrow s World
32 Interest in science appears to be influenced by student background. Students from families with a more advantaged socio-economic background were more likely to show a general interest in science, and this relationship was strongest in Ireland, France, Belgium and Switzerland. Those with a more advantaged socio-economic background were also more likely to identify how science may be useful to them in the future (Table 3.22). One significant feature of a student s background was whether they have a parent in a science-related career. Among the 18% for whom this was so, one-third (6% of students) saw their own futures in such careers. A further 19% of students without a parent in a sciencerelated career reported that they expected to be in a science-related career at age 30, making a total of 25% of students (Table 3.14). Do students feel responsible towards resources and the environment? The PISA 2006 student questionnaire asked students how they felt about selected environmental issues. Score OECD mean Indonesia Figure 4 Performance in science and awareness of environmental issues Students who are aware of environmental issues reported that they were familiar with or knew something about the following: The consequences of clearing forests for other land use; acid rain; the increase of greenhouse gases in the atmosphere; nuclear waste; use of genetically modified organisms. Higher mean performance in science, but students are less aware of environmental issues Tunisia Finland United Kingdom Netherlands Estonia Liechtenstein Hong Kong-China Japan Australia Canada Chinese Taipei Korea Germany 1 Slovenia Switzerland Belgium 2 Ireland Sweden 3 Austria Iceland Latvia 4 Spain Poland Luxembourg Lithuania Croatia Slovak Republic Israel France Denmark Norway Italy Russian Federation Greece Uruguay Chile Bulgaria Serbia Portugal Romania Jordan Turkey Mexico Thailand Argentina Montenegro Qatar Lower mean performance in science and students are less aware of environmental issues Colombia Azerbaijan Kyrgyzstan New Zealand Brazil Mean index of awareness of environmental issues Source: OECD PISA2006 database. Table 3.16 and 2.1c, Figure 3.18, PISA 2006: Science Competencies for Tomorrow s World OECD mean Higher mean performance in science and students are more aware of environmental issues 1 Czech Republic 2 Hungary 3 Macao-China 4 United States Lower mean performance in science but students are more aware of environmental issues On average across OECD countries, students awareness of environmental issues varied considerably according to the issue: 73% said that they were aware of the consequences of clearing forests for other land use (Figure 3.17). 58% said that they were aware of the increase of greenhouse gases in the atmosphere (Figure 3.17). PISA 2006: Science Competencies for Tomorrow s World Executive Summary OECD
33 35% said that they were aware of the use of genetically modified organisms (GMOs) (Figure 3.17). As shown in Figure 4, awareness of environmental issues varies by country. Within each country, awareness of environmental issues is stronger among students who perform better in science (Figure 3.17). There was some degree of pessimism among the students about the future of the natural environment: On average across OECD countries, only 21% of students reported that they believed the problems associated with energy shortages would improve over the next 20 years, 18% considered this to be the case for water shortages, 16% for air pollution, 15% for nuclear waste, 14% for the extinction of plants and animals and 13% for the clearing of forests for other land use. Students with higher performance in science, who reported greater awareness of environmental issues, also reported being more pessimistic about the future of the environment (Figure 3.20). Gender differences in attitudes to science While overall gender differences in science performance were small, differing attitudes to science among males and females can potentially affect whether students go on to further studies in science and whether they choose a career in science. PISA 2006 showed that, in some countries, males and females were similar not only in science performance but also in attitudes. In other countries, however, there were important differences. Gender differences in attitudes to science were most prominent in Germany, Iceland, Japan, Korea, the Netherlands and the United Kingdom, as well as in the partners Chinese Taipei, Hong Kong-China and Macao-China, where males reported more positive characteristics on at least five aspects of attitude (Table 3.21). Of the attitudes measured in PISA, the largest gender difference was observed in students selfconcept regarding science. In 22 out of the 30 OECD countries in the survey, males thought significantly more highly of their own science abilities than did females (Table 3.21). 30 OECD 2007 Executive Summary PISA 2006: Science Competencies for Tomorrow s World
34 Quality and equity Results by school and student background A major focus and challenge for education policy is to foster high overall levels of student achievement (quality), while limiting the influence of socio-economic contexts on learning outcomes (equity), which can be considered an indicator of inefficiencies in education systems to fully capitalise on the cognitive potential of students. PISA allows the twin goals of quality and equity in education to be monitored by considering not only differences in results by country, but also performance differences between students and schools from varying socio-economic contexts. What role do school differences play? Within each country, there was a wide variation in the science performance of different students. In all OECD countries, the range of scores among the middle 90% of students from the 5 th to the 95 th percentile exceeded the difference between average performance in the highest-performing PISA country, Finland, and the lowest-performing, Kyrgyzstan. To what extent were these differences associated with students attending different schools? How closely was this associated with schools different socio-economic profiles? Figure 5 shows the extent to which variations in student performance consist of students doing better or worse at different schools. The remainder of student variation in performance is represented as within-school differences. In PISA 2006: On average, around one-third of all variation in student performance (33%) was between schools, but this varied widely from one country to another (Table 4.1a). In Germany and the partner country Bulgaria performance variation between schools was about twice the OECD average. It was over one and a half times the average in the Czech Republic, Austria, Hungary, the Netherlands, Belgium, Japan and Italy, and the partner countries Slovenia, Argentina and Chile. In most of these countries, the grouping and tracking of students by school affected this result (Table 4.1a). In other countries, school differences played only a minor part in performance variation. In Finland less than 5% of the overall performance variation among OECD countries lay between schools and in Iceland and Norway it was still less than 10%. Other countries in which performance was not very closely related to the schools in which students were enrolled included Sweden, Poland, Spain, Denmark and Ireland as well as the partner countries Latvia and Estonia. It is noteworthy that Finland showed also the highest overall performance in science, suggesting that parents can rely on high and consistent performance standards across schools in the entire education system (Table 4.1a). PISA 2006: Science Competencies for Tomorrow s World Executive Summary OECD
35 Students socio-economic differences accounted for a significant part of between-school differences in some countries. This factor contributed most to between-school variance in the United States, the Czech Republic, Luxembourg, Belgium, the Slovak Republic, Germany, Greece and New Zealand, and the partner countries Bulgaria, Chile, Argentina and Uruguay (Table 4.1a). Figure 5 Variance in student performance between schools and within schools on the science scale Expressed as a percentage of the average variance in student performance in OECD countries A B C D Between-school variance explained by the PISA index of economic, social and cultural status of students and schools Total between-school variance Within-school variance explained by the PISA index of economic, social and cultural status of students and schools Total within-school variance Between-school variance Within-school variance % A B C D Bulgaria Germany Slovenia Czech Republic Austria Hungary Netherlands Belgium OECD Argentina average Chile % Japan Italy Greece Chinese Taipei Israel Brazil Slovak Republic Turkey Uruguay Switzerland Romania Serbia Hong Kong-China Croatia Tunisia Korea Kyrgyzstan Luxembourg United States Portugal Thailand Mexico Lithuania Colombia Russian Federation United Kingdom Montenegro New Zealand Australia OECD Jordan average Indonesia % Macao-China Azerbaijan Canada Ireland Estonia Denmark Latvia Spain Poland Sweden Norway Iceland Finland Source: OECD PISA 2006 database. Figure 4.1 and Table 4.1a, PISA 2006: Science Competencies for Tomorrow s World OECD 2007 Executive Summary PISA 2006: Science Competencies for Tomorrow s World
36 Can socio-economic equity be reconciled with school quality? The results from PISA 2006 show that poor performance in school does not automatically follow from a disadvantaged home background. However, home background, measured on an index summarising each student s economic, social and cultural status, remains one of the most powerful factors influencing performance. On average across the OECD countries it explained 14% of the student performance variation in science. While in every country, student performance tended to be stronger for students with more favourable home backgrounds, this relationship (or socio-economic gradient ) was much more powerful in some countries than others. Two measures used in PISA to show the influence of socio-economic background on student performance are the: Strength of socio-economic gradient. This presents how accurately one can predict a student s score from their socio-economic background, expressed as the percentage of all performance variation that socio-economic background can explain. Steepness of socio-economic gradient. This presents the width of a gap in student scores predicted for two students of differing socio-economic backgrounds. Figure 6 Performance in science and the impact of socio-economic background Average performance of countries on the PISA science scale and the relationship between performance and the PISA index of economic, social and cultural status Strength of the relationship between performance and socio-economic background above the OECD average impact Strength of the relationship between performance and socio-economic background not statistically significantly different from the OECD average impact Strength of the relationship between performance and socio-economic background below the OECD average impact Score Above-average level of student performance in science Above-average impact of socio-economic background OECD mean Bulgaria Czech Republic Germany New Zealand Netherlands Liechtenstein Slovenia Hungary Belgium Luxembourg Chile France Slovak Republic Argentina Uruguay Switzerland United States Lithuania Portugal Greece Turkey Romania Thailand Mexico Brazil Austria Chinese Taipei United Kingdom Serbia Colombia Above-average level of student performance in science Below-average impact of socio-economic background Denmark Canada Estonia Hong Kong-China Japan Australia Korea Macao-China Ireland Sweden Jordan Finland Croatia Norway Iceland Spain Latvia Russian Federation Poland Italy Israel Indonesia Tunisia Montenegro Azerbaijan Below-average level of student performance in science Above-average impact of socio-economic background OECD mean Kyrgyzstan Below-average level of student performance in science Below-average impact of socio-economic background Percentage of variance in performance in science explained by the PISA index of economic, social and cultural status (r-squared X 100) Note: OECD mean used in this figure is the arithmetic average of all OECD countries. Source: OECD PISA2006 database. Table 4.4a and Figure 4.10, PISA 2006: Science Competencies for Tomorrow s World PISA 2006: Science Competencies for Tomorrow s World Executive Summary OECD
37 In Figure 6, countries with weaker socio-economic gradients, and thus more equitable outcomes, are shown on the right of the diagram, and those with stronger gradients on the left. The vertical scale indicates the average science score in each country. Countries are coloured according to whether the strength of the relationship is above, below or not statistically significant from the OECD mean. Figure 6 shows that quality and equity can be reconciled in some countries. Less than 10% of the variation in student performance was explained by student background in five of the seven countries with the highest mean science scores of above 530 (Finland, Canada and Japan, and the partner countries/economies Hong Kong-China and Estonia). These countries demonstrate that quality and equity can be jointly achieved. This compared to an OECD average of 14.4%. In the other two high-scoring countries, New Zealand and the partner Chinese Taipei, 16 and 13% of performance variation can be explained by student background (Table 4.4a). The countries where student background explained the largest proportion of performance variation (strongest socio-economic gradients) were Luxembourg, Hungary and France, and the partner countries Bulgaria and Chile (Table 4.4a). The countries where two students of different socio-economic background had the largest difference in expected science scores (steepest socio-economic gradients) were France, New Zealand, the Czech Republic, the United States, the United Kingdom, Belgium and Germany, and the partner countries Bulgaria and Liechtenstein (Table 4.4a). What do patterns of school and socioeconomic differences imply for policy in different countries? Many of the factors of socio-economic disadvantage are not directly amenable to education policy, at least not in the short term. For example, the educational attainment of parents can only gradually improve, and average family wealth depends on the long-term economic development of a country. This gives rise to a vital question for policy makers: to what extent can schools and school policies moderate the impact of socio-economic disadvantage on student performance? The overall relationship between socio-economic background and student performance provides an important indicator of the capacity of education systems to provide equitable learning opportunities. However, from a policy perspective, the relationship between socio-economic background and school performance is even more important as it indicates how equity is interrelated with systemic aspects of education. PISA provides rich data on these patterns, whose complexity is not always easy to interpret. However, a number of different phenomena seen to a greater or lesser extent in different countries can each help to inform policy. A concentration of low-performing students In some countries, the key issue to address is a relatively high number of students with low proficiency in science and other competencies: Among the lowest-performing countries in PISA, a very high proportion of students had low levels of proficiency, indicating a need to improve standards across the board, for example through improvements in the curriculum. In Mexico and Turkey, as well as the 34 OECD 2007 Executive Summary PISA 2006: Science Competencies for Tomorrow s World
38 partner countries Kyrgyzstan, Qatar, Azerbaijan, Tunisia, Indonesia, Brazil, Colombia, Argentina, Montenegro, Romania, Thailand, Jordan, Bulgaria and Uruguay, more than 40% of 15-year-old students performed at Level 1 or below (Table 2.1a). In another group of countries, fewer students were poor performers, but their numbers were still high relative to the overall performance of these countries. In the United States, 9% of students performed at Levels 5 and 6, roughly the OECD average for these levels, but 24% were at Level 1 or below in science (Table 2.1a). New Zealand, one of the best-performing countries on average, still had 14% of students performing at Level 1 or below (Table 2.1a). Other countries with a comparatively large gap between higher and lower performing students included the United Kingdom, France, Japan and Germany (Table 2.1a). Most of the above countries had medium between-school differences of about 20 to 30% of average student variation. In Germany and Japan, more than one-half of student variation is between schools, in Germany largely as a result of tracking (Table 4.1a). Large differences in performance by socio-economic background Should efforts to improve student performance be targeted mainly at those with low performance or low socio-economic background? The slope and strength of the gradient, described above, can provide useful information to answer this question. In countries with relatively shallow gradients, i.e. where predicted student performance tends to be similar across socio-economic groups, policies targeted just at disadvantaged students would be relatively ineffective. Canada, with a gradient of 33 score points, Korea (32), Spain (31), Finland (31), Turkey (31), Italy (31), Iceland (29), Portugal (28) and Mexico (25) had flatter gradients than the OECD average of 40 (Table 4.4a). In countries where the relationship is relatively weak, i.e. student background only explains a small part of performance variation, socio-economically targeted policies may not always reach the students who need help most. This may be true even where the gradient is relatively steep for example, where socio-economically advantaged students perform much better on average, but a substantial minority of them nevertheless perform poorly. Japan, for example, has a gradient about as steep as the OECD average, but this explains only 7% of variation in student performance (Table 4.4a). Less than 10% of student performance variation is accounted for by student background in: Iceland, Japan, Korea, Canada, Finland and Norway, and the partner countries/ economies Macao-China, Azerbaijan, Hong Kong-China, Montenegro, the Russian Federation, Kyrgyzstan, Estonia, Tunisia and Latvia (Table 4.4a). In Austria, the Czech Republic and the United Kingdom, the gradient is considerably steeper than average but its strength is only about average (Table 4.4a). In countries with relatively strong and steep socio-economic gradients, socio-economically targeted policies are likely to achieve most. In Hungary, France, Belgium, the Slovak Republic, Germany, the United States and New Zealand, and the partner country Bulgaria, the gradient is both steeper and stronger than average for OECD countries (Table 4.4a). PISA 2006: Science Competencies for Tomorrow s World Executive Summary OECD
39 A wide variation in the socio-economic background of students Countries need also to take account of how much difference exists in terms of the socioeconomic background of their students. Canada and Spain have similar socio-economic gradients, flatter than the OECD average, but Spain s students are more socio-economically diverse. These two countries have equally steep socio-economic gradients, but socio-economic difference accounts for nearly twice as much performance difference in Spain, so socio-economically targeted policies are more likely to help improve performance there (Table 4.4a). Mexico also has a relatively flat socio-economic gradient, but a highly diverse student population with a skew towards the bottom end, leading to higher than average performance variation associated with socio-economic difference. This suggests the relevance of compensatory policies to help the most disadvantaged students (Table 4.4a). Sweden, in contrast, has a socio-economic gradient of average steepness, but a relatively equal society so that differences between students of different backgrounds have a relatively small effect (Table 4.4a). Strong socio-economic differences across schools Socio-economic gradients also vary in important ways when comparing different schools. The slope of between-school gradients shows how much better students perform if they go to schools with a relatively advantaged socio-economic intake. The percentage of between-school performance differences accounted for by differences in school intakes the strength of the between-school gradient. The degree to which students of different backgrounds are separated into different schools. Germany, for example, has a steep socio-economic gradient, and differences in student intake account for about three-quarters of cross-school difference in performance. Spain has a very shallow socio-economic gradient across schools, but a very strong degree of separation of students from different backgrounds into different schools, and still over 40% of cross-school differences are explained by socio-economic factors. In contrast, Norway has less between-school difference associated with socio-economic difference, despite having a steeper gradient than Spain. Countries where a high level of variation is accounted for by between-school socio-economic factors particularly need to consider whether socioeconomic segregation by school is harming equity and/or overall performance (Table 4.4b). Strong socio-economic differences within schools Finally, how strong are differences in performance among students from different socioeconomic backgrounds within the same school? Within-school differences tended to be smaller in countries where students have already been separated by ability, so each school had a more homogeneous intake. Despite this, within-school differences are relatively similar in magnitude from one country to another: 36 OECD 2007 Executive Summary PISA 2006: Science Competencies for Tomorrow s World
.")

40 Executive summary Even Finland and New Zealand, which in other respects represent one of the least and one of the most unequal countries in terms of PISA results, have broadly similar within-school socio-economic gradients (Table 4.4b). In no country did within-school socio-economic differences in performance account for more than 12% of performance variation (Table 4.4b). Thus while there may be some instances where socio-economic differences in performance within schools need to be addressed, in no country can such measures succeed on their own in creating more even student performance. PISA 2006: Science Competencies for Tomorrow s World Executive Summary OECD
41 School and system-level factors The impact of school and system practices, policies and resources What can schools and school policies do to raise performance and to moderate the impact that socio-economic background has on student performance? PISA 2006 looked at various school and system-level factors including the policies and practices in admitting, selecting and grouping students, school management and funding, parental pressure and choice, accountability policies, school autonomy, and school resources. The association of these factors with student performance was estimated both before and after accounting for the demographic and socio-economic context of students, schools and countries. Admitting, selecting and grouping How do schools in different countries confront the formidable challenge of grouping students in order to provide effective instruction for a diverse student body? They vary considerably in the extent to which they group students, both across and within schools: While residence was the most important single factor determining the allocation of students to schools, about one-quarter (27%) of 15-year-old students in OECD countries were in schools that select by students academic record (Table 5.1). The age of first selection in the education system varies from age 10 to 17 across the countries. The first selection is at the age of 11 or below in Austria, Germany, the Czech Republic, Hungary, the Slovak Republic and Turkey and in the partner countries Bulgaria and Liechtenstein, while it is at the age of 16 or above in Australia, Canada, Denmark, Finland, Iceland, New Zealand, Norway, Poland, Spain, Sweden, the United Kingdom and the United States and in the partner countries Brazil, Jordan, Latvia, Thailand and Tunisia (Table 5.1). Fourteen percent of students in OECD countries were in schools that divided children by ability for all subjects between or within classes and 54% were in schools that practise ability grouping for some subjects, but not for all subjects (Table 5.3). 38 OECD 2007 Executive Summary PISA 2006: Science Competencies for Tomorrow s World
42 PISA 2006 allows these admitting, selecting and grouping policies and practices to be compared to student performance in science, even if it cannot establish the causal nature of the relationships. Not surprisingly, within each country, students in schools that select by academic criteria performed, on average, better. However, school systems where there were more schools selecting students by ability, performed neither better nor worse overall. Institutional tracking was closely related to the impact which socio-economic background had on student performance. The earlier students were stratified into separate institutions or programmes, the stronger was the impact which the school s average socio-economic background had on performance. A long-term trend in OECD countries has been to reduce the amount of separation and tracking in secondary education. The most recent major example of this is Poland, whose reading results before and after this education reform are reported in PISA. Here, an improvement in results among lower ability students immediately after the reform was not at the expense of higher ability students, whose results also rose in the subsequent period (Table 5.19a). Schools that divided students by ability for all subjects tended to have lower student performance, on average (Table 5.19a). On average across the countries with a significant share of private enrolment, students in private schools outperformed students in public schools in 21 countries, while public schools outperformed private ones in four countries. The picture changed, however, when the socio-economic background of students and schools was taken into account. Public schools then had an advantage of 12 score points over private schools, on average across OECD countries. That said, private schools may still pose an attractive alternative for parents looking to maximise the benefits for their children, including those benefits that are conferred to students through the socio-economic level of schools intake (Tables 5.4, 5.19b). Parental pressure and choice In recent years, some countries have increased the extent of choice of school, particularly in secondary education. But to what extent do schools compete for students, and does this have any effect on performance? Across OECD countries, 60% of students were enrolled in schools whose principals reported that they must compete with two or more other schools in the local area to enrol students. Does competition improve results? PISA 2006 showed that within countries, schools facing competition for students performed better, but this can be explained by the more favourable average socio-economic background of their students. Across countries, however, having a larger number of schools that compete for students was associated with better results, over and above the relationship with student background (Table 5.5). School choice is most prevalent in 10 countries or economies, where 80% of principals reported that students have a choice of at least two alternatives to their own school: Australia, the Slovak Republic, the United Kingdom, New Zealand and Japan, and the partner countries/economies Indonesia, Hong Kong-China, Chinese Taipei, Macao-China and Latvia. On the other hand, in Iceland, Norway, and Switzerland, and in the partner countries Qatar and Uruguay, the parents of at least one-half of the students had effectively no choice of schools, according to school principals (Table 5.5). PISA 2006: Science Competencies for Tomorrow s World Executive Summary OECD
43 On average, across OECD countries, 21% of students were enrolled in schools where school principals reported constant pressure from many parents who expected the school to set very high academic standards and to have the students achieve them. These reported pressures were highest in New Zealand, Sweden and Ireland (Table 5.6). Parents surveyed in 16 countries reported generally to be positive and well-informed about their children s schools, but this varied considerably across countries. For example, fewer than 50% of parents in Germany, but over 90% in Poland and the partner county Colombia, reported that the school provided regular and useful information on their child s progress (Table 5.7). Accountability policies The quest for performance standards has driven the creation of stronger and more visible systems of accountability for educational performance in many OECD countries. However, PISA 2006 shows that these vary in type and strength from country to country. On average across OECD countries, 65% of 15-year-olds were enrolled in schools where principals reported that performance data were tracked over time by an administrative authority. However, this ranged from over 90% in the United States, the United Kingdom, New Zealand, Mexico and Canada, as well as in the partner countries the Russian Federation and Kyrgyzstan, to over 80% in Australia, the Netherlands, Sweden, Iceland, Turkey and Luxembourg, as well as the partner countries Montenegro, Estonia, Brazil, Qatar, Croatia, Thailand, Tunisia, Jordan and Colombia, to less than 36% in Switzerland, Denmark, Italy and Japan (Table 5.8). On average across OECD countries, 43% of 15-year-olds were enrolled in schools where principals reported that they used performance data in the evaluation of teacher performance. In the United Kingdom, Hungary and the Czech Republic, as well as the partner countries the Russian Federation, Kyrgyzstan, Azerbaijan, Romania, Indonesia, Israel, Qatar and Latvia, this was more than 90%. In Poland and Mexico, as well as the partner countries Thailand, Estonia, Lithuania, Jordan and Tunisia, it was still more than 80%. However, in Luxembourg, Switzerland and Greece this happened in less than 10% of the schools and in Finland, Belgium and Canada in less than 20% of the schools. In most countries, student performance data were used more frequently to evaluate the performance of teachers than of principals, sometimes considerably so (Table 5.8). The use of performance data for decisions on instructional resource allocations tended to be less common. On average across OECD countries, 30% of 15-year-olds were enrolled in schools that reported such practices, but this varied from over 85% in the partner countries Chile and Indonesia to less than 10% in Greece, Iceland, Japan, Luxembourg, Finland, Hungary and the Czech Republic (Table 5.8). There remain diverging views on how results from evaluation and assessment can and should be used. Some see them primarily as tools to reveal best practices and identify shared problems in order to encourage teachers and schools to improve and develop more supportive and productive learning environments. Others extend their purpose to support contestability of public services or market-mechanisms in the allocation of resources, e.g. by making comparative results of schools publicly available to facilitate parental choice. 40 OECD 2007 Executive Summary PISA 2006: Science Competencies for Tomorrow s World
44 A widely debated question relates to the extent and ways in which information on student performance should be made available to parents and the public at large. On average across OECD countries, the majority of students (54%) were enrolled in schools, where school principals reported giving feedback to parents on their child s performance relative to the performance of other students at the school. In the Slovak Republic and the partner countries Indonesia, Azerbaijan, Romania, Serbia, Jordan, Kyrgyzstan and the Russian Federation, this held for more than 90% of students, while in Sweden, Finland and Italy this was only between 12 and 19% (Table 5.9). In many OECD countries, the reporting of student performance information to parents is more commonly done relative to national benchmarks than relative to other students in the school. For example, in Sweden only 12% of 15-year-olds were enrolled in schools that reported performance data to parents relative to those of other students in the school, while 94% of 15-year-olds were enrolled in schools that reported data relative to national or regional standards or benchmarks. The pattern was similar in Japan, Finland, Norway, the United Kingdom and New Zealand, as well as in the partner country Estonia (Table 5.9). It was far less common for parents to receive information on student performance in their school relative to students in other schools (Table 5.9). Providing assessment information to parents is one thing, but a more widely debated question in many countries is to what extent and how results from accountability systems should be made publicly available. In the United Kingdom and the United States, school principals of more than 90% of 15-year-olds enrolled in school reported that school achievement data were posted publicly; in the Netherlands, as well as the partner countries Montenegro and Azerbaijan, this was still the case for more than 80%. In contrast, in Finland, Belgium, Switzerland and Austria, as well as in the partner country Argentina, this was the case for less than 10% of the students and in Japan, Spain, Germany, Korea and Ireland, and in the partner countries/economies Macao-China, Uruguay, Indonesia and Tunisia, it held for less than 20% (Table 5.8). The PISA analysis showed considerable differences in the scores of students in countries where there were standards-based external examinations and where schools posted their results publicly. Some of these differences were associated with other features of schools and school systems that tended to go along with strong accountability arrangements and with the socio-economic background of students in schools that had such arrangements. However, once these factors are taken into account, there still remained a significant positive association between schools making their achievement data public and having stronger results. School autonomy Increased autonomy over many aspects of school management has become common over the past 20 years, with countries aiming to raise performance levels and responsiveness by devolving responsibilities. School principals in PISA reported varying amounts of control over the management of their schools. In most countries, for example, principals do not have much power over setting salaries. PISA 2006: Science Competencies for Tomorrow s World Executive Summary OECD
45 In other aspects, the picture is more varied. Principals were asked to what extent schools decide on matters. They reported that: The appointment of teachers was solely a school responsibility for almost all schools in 12 countries, but for almost no schools in seven countries. At least 95% of students attend schools where principals reported that the school took sole responsibility for this in the Slovak Republic, New Zealand, the Netherlands, the Czech Republic, Iceland, Sweden, the United States and Hungary, and in the partner countries/economies Lithuania, Montenegro, Macao-China and Estonia. Fewer than 10% were enrolled in such schools in Turkey, Greece, Italy and Austria, and the partner countries Romania, Tunisia and Jordan (Table 5.10). The setting of budgets was solely a school responsibility for schools enrolling at least 90% of students in the Netherlands and New Zealand and in the partner countries/economies Jordan, Macao-China, Indonesia and Hong Kong-China, but fewer than 10% in Poland and the partner country Azerbaijan (Table 5.10). The determination of course content was solely a school responsibility in schools with 90% of students in Japan, Poland and Korea, as well as in the partner countries/economies Macao-China and Thailand. But in Luxembourg, Greece and Turkey and the partner countries Tunisia, Serbia, Montenegro, Uruguay, Croatia, Jordan and Bulgaria fewer than 10% of schools reported determining content solely on their own (Table 5.10). Within countries, students in schools that exercise greater autonomy do not on average get better results. However, students in countries where autonomy is more common tend to do better in the science assessment, regardless of whether or not they themselves are enrolled in relatively autonomous schools. This is true for the aspects of school autonomy in formulating the school budget and deciding on budget allocations within the school, even after accounting for socio-economic background factors as well as other school and system-level factors. These results suggest that greater autonomy has a general impact at the system level, perhaps deriving from the greater independence of school managers in systems that authorise choice of responses to local conditions. School resources PISA also considers the supply of human resources in term of teachers, as well as various kinds of material and educational resources. In PISA 2006, principals reported on: The impact of teacher shortages, which were most frequently reported as hindering instruction in Turkey, Luxembourg and Mexico and in the partner countries Jordan, Kyrgyzstan, Indonesia, Thailand, Azerbaijan and the Russian Federation. They were least commonly reported as hindering instruction in Poland, Portugal, Spain, Hungary, Japan and Korea, and in partner countries Slovenia, Serbia, Romania and Montenegro (Table 5.13). The average number of students per teacher (this is not necessarily the class size average as it is taken across the whole school). This ratio was lowest (fewer than ten) in Portugal, Greece, Belgium, Italy and Luxembourg, and as well as in the partner country Azerbaijan, and highest (more than 20) in Mexico, as well as in the partner countries/economies Brazil, Chile, Colombia, Thailand and Macao-China (Table 5.14). 42 OECD 2007 Executive Summary PISA 2006: Science Competencies for Tomorrow s World
46 Shortfalls in educational resources were reported most frequently as hindering instruction in the partner countries Kyrgyzstan, Indonesia, Azerbaijan, Montenegro, the Russian Federation and Colombia, and least frequently in Switzerland, Japan and Australia, and the partner economy Chinese Taipei (Table 5.15). Across OECD countries 29% of students reported that they had four hours or more of regular science lessons at school per week. This varied from around 11% or less in Norway and Sweden and the partner country Croatia to over 60% in New Zealand and the United Kingdom (Table 5.17). Resources such as an adequate supply of teachers and quality of educational resources at school are associated with positive student outcomes, but many of these effects are not significant after taking account of the fact that students with a more advantaged socioeconomic background tend to get access to more educational resources. After accounting for this, there remains a significant association between several aspects of learning time as well as school activities to promote students learning of science and performance. Science performance is on average higher in schools with longer instruction hours (Table 5.19g). Educational quality and equity: factors associated with student performance A number of school factors measured by PISA show a relationship with performance, measured in a model that includes the most important school and system-level factors, even if PISA cannot establish the causal nature of this relationship. School factors, based on schools principals reports, that were associated with performance even after accounting for socio-economic background The practice of ability grouping for all subjects within schools (students in schools that practised ability grouping for all subjects within schools scored 4.5 points lower than students in schools that practised no ability grouping or ability grouping only for some subjects, all other things being equal) (Table 5.19g). High academic selectivity of school admittance (students in schools in which academic records or feeder school recommendations were a prerequisite for school admittance scored 14.4 points higher than students in schools that applied a moderate selective admittance policy, all other things being equal) (Table 5.19g). Whether the school s performance data were posted publicly (students in schools that posted performance data publicly scored 3.5 points higher compared with students in schools that did not post performance data publicly, all other things being equal) (Table 5.19g). The school average of the time students invest in learning for science, mathematics and language at school (students in schools with one additional average hour per week scored 8.8 points higher, all other things being equal), out-of school lessons (students in schools with one additional average hour per week scored 8.6 points lower, all other things being equal), and self-study (students in schools with one additional average hour per week scored 3.1 points higher, all other things being equal) (Table 5.19g). PISA 2006: Science Competencies for Tomorrow s World Executive Summary OECD
47 School activities to promote students learning of science (one additional unit of this index was equivalent to an advantage of 2.9 score points in student performance, all other things being equal) (Table 5.19g). System factor that was associated with performance even after accounting for socio-economic background Education systems where schools reported a higher degree of autonomy in budgeting (students in education systems with one additional standard deviation on the index of autonomy in budgeting score 25.7 points higher, all other things being equal) (Table 5.19g). School factors that were associated with performance only before taking socio-economic background into account The level of funding from government (students in schools with an additional 10% of public funding scored 2 points lower, all other things being equal) (Table 5.19g). Whether there is one or more other schools in the area that compete for the students (students in schools competing with other schools scored 6.0 points higher compared to students in schools not competing with other schools for students, all other things being equal) (Table 5.19g). The lack of qualified teachers hindering instruction (students in schools with one additional unit of this index scored 3.5 points lower, all other things being equal) (Table 5.19g). The quality of educational resources at the school (students in schools with one additional unit of this index scored 3.9 points better, all other things being equal) (Table 5.19g). A larger question is whether specific policy interventions responding to these effects are likely to be overshadowed by the high number of other influences on student performance, whether in terms of the multiple aspects of school learning environment and organisation not covered by any given policy or in terms of contextual influences including the socioeconomic background of the students attending each school. An overall measure of the combined effect of these factors suggests that about a quarter of the variation in students science performance across OECD countries can be associated with the ways in which these factors vary across countries and across schools, once the variation explained by socio-economic differences has been taken into account. However, most of this effect is not attributable to the school factors acting wholly independently of socio-economic factors, but rather a combined effect of the two. For example, schools that have longer learning hours may also enrol more socio-economically advantaged students, and while the higher predicted performance of such students can only partially account for the superior performance of such schools, the effects of longer hours and higher intake may appear to reinforce each other. At a policy level, this suggests that the potential for improving results through such school factors needs to be considered in combination with the extent to which schools with favourable characteristics are being accessed mainly by more advantaged students. The challenge is to find ways of spreading such characteristics to a wider section of the student population. 44 OECD 2007 Executive Summary PISA 2006: Science Competencies for Tomorrow s World

48 A crucial question for school systems is whether there are policies that can systematically improve equity, without threatening quality. In some cases, this requires difficult decisions about where to deploy finite educational resources. But some routes to improvement, such as accountability arrangements, are less linked to resources than to process. In such cases, there are opportunities to improve results across the board. A more complex issue is the effects of selection and differentiation. It is clearly not possible for every school to raise its students performance by becoming more selective about its intake. A clear-cut finding from PISA is that early differentiation of students by school is associated with wider than average socio-economic disparities and not with better results overall. There has been a trend among OECD countries to delay or reduce the separation of students early in secondary education, with Spain and Poland being the most recent examples. PISA 2006: Science Competencies for Tomorrow s World Executive Summary OECD
49 Reading performance Reading performance in PISA 2006 and changes since PISA 2000 PISA 2000 looked in detail at reading performance, while PISA 2003 and PISA 2006 provided briefer updates. It is now possible to see changes in reading performance over six years. PISA measures reading literacy in terms of students ability to use written information in situations that they encounter in their lives. This goes beyond the traditional notion of decoding information and literal interpretation. Students are shown different kinds of text, and required to retrieve information, to interpret the text and to reflect on and evaluate what they read. Reading proficiency Reading literacy in PISA is not an all or nothing measure: rather, students are placed at different levels of proficiency according to the difficulty of task that they can complete. Easier tasks require basic handling of simple texts, with harder ones involving increasing complexity and less explicit information. A minority of students (8.6% on average across OECD countries) were proficient at the highest reading level, Level 5. These students are capable of sophisticated, critical thinking. In PISA 2006 : Korea had the largest number of students at Level 5 (22%), followed by Finland and New Zealand (over 15%), Canada (14%) and Ireland, Poland and Belgium and the partner economy Hong Kong-China (over 11%) (Table 6.1a). At the other extreme, fewer than 1% were proficient at Level 5 in Mexico and in the partner countries/economies Indonesia, Kyrgyzstan, Azerbaijan, Tunisia, Jordan, Thailand, Serbia, Romania and Montenegro it was less than one-half of a percent (Table 6.1a). Countries with large numbers at Level 5 varied considerably in terms of how many students were at low proficiency levels, and therefore their mean performance. For example, Finland and New Zealand had 17% and 16% respectively at Level 5, but New Zealand had 15% at Level 1 or below compared to just 5% in Finland. Finland s average score of 547 was well above New Zealand s of 521 (Tables 6.1a, 6.1c). Most students (80% across OECD countries) were capable of basic reading tasks at Level 2 locating straightforward information, making low-level inferences of various types, working out what a well-defined part of a text means and using some outside knowledge to understand it. Longitudinal follow-up studies in Australia, Canada and Denmark suggest that the minority of students not capable of these tasks, those classified either at Level 1 or below, are likely to face difficulty using reading materials to fulfil their goals and to acquire knowledge (Box 6.1). 46 OECD 2007 Executive Summary PISA 2006: Science Competencies for Tomorrow s World
50 Table 4 Range of rank of countries/economies on the reading scale Statistically significantly above the OECD average Not statistically significantly different from the OECD average Statistically significantly below the OECD average Reading score S.E. Reading scale OECD countries Range of rank All countries/economies Upper rank Lower rank Upper rank Lower rank Korea 556 (3.8) Finland 547 (2.1) Hong Kong-China 536 (2.4) 3 3 Canada 527 (2.4) New Zealand 521 (3.0) Ireland 517 (3.5) Australia 513 (2.1) Liechtenstein 510 (3.9) 6 11 Poland 508 (2.8) Sweden 507 (3.4) Netherlands 507 (2.9) Belgium 501 (3.0) Estonia 501 (2.9) Switzerland 499 (3.1) Japan 498 (3.6) Chinese Taipei 496 (3.4) United Kingdom 495 (2.3) Germany 495 (4.4) Denmark 494 (3.2) Slovenia 494 (1.0) Macao-China 492 (1.1) Austria 490 (4.1) France 488 (4.1) Iceland 484 (1.9) Norway 484 (3.2) Czech Republic 483 (4.2) Hungary 482 (3.3) Latvia 479 (3.7) Luxembourg 479 (1.3) Croatia 477 (2.8) Portugal 472 (3.6) Lithuania 470 (3.0) Italy 469 (2.4) Slovak Republic 466 (3.1) Spain 461 (2.2) Greece 460 (4.0) Turkey 447 (4.2) Chile 442 (5.0) Russian Federation 440 (4.3) Israel 439 (4.6) Thailand 417 (2.6) Uruguay 413 (3.4) Mexico 410 (3.1) Bulgaria 402 (6.9) Serbia 401 (3.5) Jordan 401 (3.3) Romania 396 (4.7) Indonesia 393 (5.9) Brazil 393 (3.7) Montenegro 392 (1.2) Colombia 385 (5.1) Tunisia 380 (4.0) Argentina 374 (7.2) Azerbaijan 353 (3.1) Qatar 312 (1.2) Kyrgyzstan 285 (3.5) Source: OECD PISA 2006 database. Figure 6.8b, PISA 2006: Science Competencies for Tomorrow s World PISA 2006: Science Competencies for Tomorrow s World Executive Summary OECD
51 In PISA 2006: In every OECD country except Mexico, Turkey, the Slovak Republic and Greece, at least 73% of students were at Level 2 or above (Table 6.1a). Countries with the fewest students below Level 2 were: Finland (5%), Korea (6%) and the partner economy Hong Kong-China (7%). Between 10 and 15% of students were below Level 2 in Canada, Ireland, Australia, New Zealand, the Netherlands and Sweden, and the partner countries/economies Macao-China, Estonia, Liechtenstein and Chinese Taipei (Table 6.1a). On the other hand, a majority of students were at Level 1 or below in partner countries Kyrgyzstan, Qatar, Azerbaijan, Tunisia, Indonesia, Argentina, Montenegro, Colombia, Brazil, Romania, Serbia and Bulgaria (Table 6.1a). Average reading scores In reading, as with science, scores for each country can be summed up in a mean score. Again, with some countries with similar mean scores, it is not possible to say with confidence which is the higher, so rankings can only be reported within a range. In PISA 2006: Korea had significantly higher performance in reading than any other country, including Finland, the top performer in previous PISA reading surveys. Korea s mean score, 556 score points, was nearly one proficiency level above the OECD average of 492 score points. Finland was a clear second with 547 points and partner economy Hong Kong- China a clear third with 536 points (Table 6.1c). Canada and New Zealand had mean reading scores between 520 and 530, and the following other countries scored significantly above the OECD average: Ireland, Australia, Poland, Sweden, the Netherlands, Belgium and Switzerland as well as the partner countries Liechtenstein, Estonia and Slovenia (Table 6.1c). Changes since PISA 2000 It is now possible to track change in reading performance over a six-year period. The results suggest that, across the OECD area, reading performance has generally remained flat between PISA 2000 and PISA This needs to be seen in the context of significant rises in expenditure levels. Between 1995 and 2004 expenditure per primary and secondary student increased by 39% in real terms, on average across OECD countries (Table 2.6). In the short period between 2000, when the first PISA assessment was undertaken and 2004, the average increase amounted to 22% and in six countries to between 30 and 61%. However, two OECD countries (Korea and Poland) and five partner countries/economies (Chile, Liechtenstein, Indonesia, Latvia and Hong Kong-China) have seen significant rises in reading performance since PISA Korea increased its reading performance between PISA 2000 and PISA 2006 from an already high level by 31 score points, thus reaching the highest reading performance 48 OECD 2007 Executive Summary PISA 2006: Science Competencies for Tomorrow s World
52 among all participating countries even surpassing Finland, the performance of which remained stable at a high level. Korea achieved this increase mainly by significantly raising performance standards among the better performing students, while the performance at the lower end of the distribution remained essentially unchanged. Indeed, at the 95 th percentile, the point above which the 5% best performing students score, reading performance rose by 59 score points, to 688 score points, at the 90 th percentile still by 55 score points and at the 75 th percentile by 44 score points. In contrast, there was no significant change at the 5 th and 10 th percentiles for Korea (Tables 6.3a, 6.3c). Hong Kong-China is another country that has seen a significant increase, by 11 score points since PISA 2000, from an already high level of reading performance, reaching 536 score points in PISA Here the change was mainly driven by improvements among the lowest-performing students, with the 5 th percentile rising by 21 score points (Tables 6.3a, 6.3c). Poland increased its reading performance by 17 score points between PISA 2000 and PISA 2003 and another 11 score points between PISA 2003 and PISA 2006 and now performs at 508 score points, for the first time clearly above the OECD average. Between these two assessments, Poland raised its average performance mainly through increases at the lower end of the performance distribution. As a result, in PISA 2003 fewer than 5% of students fell below performance standards that had not been reached by the bottom 10% of Polish students in PISA Since PISA 2003, performance in Poland has risen more evenly across the performance spectrum (Tables 6.3a, 6.3c). The other countries that have seen significant performance increases in reading between PISA 2000 and PISA 2006 Chile (33 score points), Liechtenstein (28 score points), Indonesia (22 score points) and Latvia (21 score points) perform, with the exception of Liechtenstein, significantly below the OECD average (Tables 6.3a, 6.3c). A number of countries saw a decline in their reading performance between PISA 2000 and PISA 2006, comprising nine OECD countries (in descending order) Spain, Japan, Iceland, Norway, Italy, France, Australia, Greece, Mexico and the partner countries, Argentina, Romania, Bulgaria, the Russian Federation and Thailand. In France, Japan and Mexico, as well as the partner country Thailand, for example, performance declined slightly at the higher end of the student performance distribution, but declined markedly at the lower end. It is noteworthy that, among the countries with above-average performance levels only Australia has seen a statistically significant decline in their students reading performance, by 15 score points, which is attributable to a decline at the higher end of the performance spectrum. The other countries with a significant decline in reading performance between PISA 2000 and PISA 2006, all perform around or below the OECD average level. Of this latter group, Japan and Iceland previously performed above the OECD average. For the Czech Republic, the better performers have seen improvements, while the standards declined at the lower end of the performance distribution. In Switzerland, performance standards rose at the lower end of the distribution (Tables 6.3a, 6.3c). PISA 2006: Science Competencies for Tomorrow s World Executive Summary OECD

53 Gender differences In all OECD countries in PISA 2006, females perform better in reading on average than males. In PISA 2006: In twelve countries, the gap was at least 50 score points. In Greece and Finland, females were 57 and 51 points ahead respectively, and the gap was 50 to 66 points in the partner countries Qatar, Bulgaria, Jordan, Thailand, Argentina, Slovenia, Lithuania, Kyrgyzstan, Latvia and Croatia (Table 6.1c). The smallest gender gaps among OECD countries were in the Netherlands and the United Kingdom (24 and 29 points, respectively) (Table 6.1c). In Korea, males increased their performance by 20 score points between 2000 and 2006, but females at twice that rate. In Finland and Korea, over 60% of females were at high levels of reading proficiency, Level 4 or 5, compared to just over one-third (36%) of boys in Finland and below one-half (47%) of boys in Korea (Table 6.1b, 6.3a). 50 OECD 2007 Executive Summary PISA 2006: Science Competencies for Tomorrow s World
54 Mathematics performance Mathematics performance in PISA 2006 and changes since PISA 2003 PISA 2003 looked in detail at mathematics performance. PISA 2006 provides a briefer update, so it is now possible to see change in mathematics performance over three years. PISA uses a concept of mathematical literacy that is concerned with the capacity of students to analyse, reason and communicate effectively as they pose, solve and interpret mathematical problems in a variety of situations involving quantitative, spatial, probabilistic or other mathematical concepts. Mathematics proficiency In order to perform the hardest mathematics tasks in PISA, students must put together complex elements of a question, use reflection and creativity to solve unfamiliar problems and engage in some form of argument, often in the form of an explanation. Only 13% of students were rated at the top two proficiency levels, Levels 5 and 6 in PISA The highest percentage of students at Levels 5 and 6 were found in Korea (27%) and the partner Chinese Taipei (32%). Finland, Switzerland, Belgium and the Netherlands all had more than 20% of students at these top levels (Table 6.2a). With the exception of Mexico and Turkey, at least 5% of students in each OECD country reached Level 5 or 6 (Table 6.2a). Level 2 is considered a baseline level of mathematics proficiency at which students begin to demonstrate the kind of skills that enable them to use mathematics actively. Level 2 tasks require students to recognise mathematical problems requiring only direct inferences, to extract information from a single source and to make literal interpretations of their results. Over three-quarters (78.7%) of students on average across OECD countries were proficient at least at this level. In Finland and Korea, and the partner Hong Kong-China, more than 90% of students performed at or above Level 2 (Table 6.2a). In every OECD country except Mexico, Turkey, Italy, Greece and Portugal at least 70% of students were at Level 2 or above (Table 6.2a). The proportion falling short of this level varied widely across countries, from 6% in Finland to 56% in Mexico and, among partner countries/economies, from 10% in Hong Kong- China to 89% in Kyrgyzstan (Table 6.2a). PISA 2006: Science Competencies for Tomorrow s World Executive Summary OECD
55 Average mathematics scores In mathematics, as with reading and science, scores for each country can be summed up in a mean score. Again, with some countries with similar mean scores, it is not possible to say with confidence which is the higher, so rankings can only be reported within a range (Figure 6.20b). In PISA 2006: Finland and Korea, and the partners Chinese Taipei and Hong Kong-China, outperformed all other countries (Table 6.2c). Other countries with mean performances significantly above the OECD average were the Netherlands, Switzerland, Canada, Japan, New Zealand, Belgium, Australia, Denmark, the Czech Republic, Iceland and Austria, and the partner countries/economies Macao- China, Liechtenstein, Estonia, and Slovenia (Table 6.2c). Changes since PISA 2003 It is only possible so far to compare mean scores in mathematics over a three-year period, from PISA 2003 to PISA For most countries, performance in mathematics remained broadly unchanged between PISA 2003 and PISA However, for a few countries there were notable performance differences. Two OECD countries, Mexico and Greece, and two partner countries, Indonesia and Brazil, show higher performance in PISA 2006 than in PISA 2003 (Tables 6.3b, 6.3d). In Mexico mathematics performance was 20 score points higher in PISA 2006 than in PISA 2003 but at 406 score points it is still well below the OECD average. In reading, Mexican females performed significantly higher in PISA 2006 than in PISA 2003, while the performance of males remained unchanged; in mathematics both males and females saw similar performance increases between the two surveys (Tables 6.3b, 6.3d). In Greece, mathematics performance was 14 score points higher in PISA 2006 than in PISA Most of the increase was driven in the lower and middle range of the performance distribution. It is also noteworthy that the performance difference is mainly due to the significantly higher performance of females in PISA 2006 (Tables 6.3b, 6.3d). In Indonesia, mathematics performance was 31 score points higher in PISA 2006 than in PISA 2003, which was, as in the case of reading, largely driven by the higher performance of males in PISA 2006 (Tables 6.3b, 6.3d). In Brazil, mathematics performance was 13 score points higher in PISA 2006 than in PISA 2003, which was mainly driven by performance improvements at the lower end of the distribution (Tables 6.3b, 6.3d). Mathematics performance in PISA 2006 was significantly lower in France (15 score points essentially because of significantly lower performance at the lower end of the performance distribution), Japan (11 score point), Iceland (10 score points) and Belgium (9 score points). Among the partner countries, Liechtenstein performed 11 score points lower in PISA 2006 than in PISA 2003 (Tables 6.3b, 6.3d). 52 OECD 2007 Executive Summary PISA 2006: Science Competencies for Tomorrow s World

56 Table 5 Range of rank of countries/economies on the mathematics scale Statistically significantly above the OECD average Not statistically significantly different from the OECD average Statistically significantly below the OECD average Mathematics score S.E. Mathematics scale Range of rank OECD countries All countries/economies Upper rank Lower rank Upper rank Lower rank Chinese Taipei 549 (4.1) 1 4 Finland 548 (2.3) Hong Kong-China 547 (2.7) 1 4 Korea 547 (3.8) Netherlands 531 (2.6) Switzerland 530 (3.2) Canada 527 (2.0) Macao-China 525 (1.3) 7 11 Liechtenstein 525 (4.2) 5 13 Japan 523 (3.3) New Zealand 522 (2.4) Belgium 520 (3.0) Australia 520 (2.2) Estonia 515 (2.7) Denmark 513 (2.6) Czech Republic 510 (3.6) Iceland 506 (1.8) Austria 505 (3.7) Slovenia 504 (1.0) Germany 504 (3.9) Sweden 502 (2.4) Ireland 501 (2.8) France 496 (3.2) United Kingdom 495 (2.1) Poland 495 (2.4) Slovak Republic 492 (2.8) Hungary 491 (2.9) Luxembourg 490 (1.1) Norway 490 (2.6) Lithuania 486 (2.9) Latvia 486 (3.0) Spain 480 (2.3) Azerbaijan 476 (2.3) Russian Federation 476 (3.9) United States 474 (4.0) Croatia 467 (2.4) Portugal 466 (3.1) Italy 462 (2.3) Greece 459 (3.0) Israel 442 (4.3) Serbia 435 (3.5) Uruguay 427 (2.6) Turkey 424 (4.9) Thailand 417 (2.3) Romania 415 (4.2) Bulgaria 413 (6.1) Chile 411 (4.6) Mexico 406 (2.9) Montenegro 399 (1.4) Indonesia 391 (5.6) Jordan 384 (3.3) Argentina 381 (6.2) Colombia 370 (3.8) Brazil 370 (2.9) Tunisia 365 (4.0) Qatar 318 (1.0) Kyrgyzstan 311 (3.4) Source: OECD PISA 2006 database. Figure 6.20b, PISA 2006: Science Competencies for Tomorrow s World PISA 2006: Science Competencies for Tomorrow s World Executive Summary OECD

57 Gender differences In 35 of the 57 countries participating in PISA 2006, males performed significantly ahead of females. In 21 there was no significant difference, and in the partner country Qatar, females outperformed males. In 2006: Overall gender differences in mathematics were less than a third as large as for reading, 11 points on average across OECD countries. This has not changed since 2003 (Tables 6.2b, 6.2c). In 2006, males outperformed females by above 20 points only in Austria (23 points) and the partner countries Chile (28 points) and Colombia (22 points) (Table 6.2c). Males also had an above-average advantage of 12 to 20 points in Japan, Germany, the United Kingdom, Italy, Luxembourg, Portugal, Australia, the Slovak Republic, Canada, Switzerland and the Netherlands, and the partner countries/economies Brazil, Indonesia, Hong Kong-China, Tunisia, Croatia, Chinese Taipei, Uruguay and Argentina (Table 6.2c). 54 OECD 2007 Executive Summary PISA 2006: Science Competencies for Tomorrow s World
58 To learn more about PISA and to download our publications, data and brochure, please visit our website: To learn more about the OECD, please visit
59 Education at a Glance 2008 NO MEDIA OR WIRE TRANSMISSION BEFORE 9 SEPTEMBER 2008, 11:00 PARIS TIME OECD Briefing Note For Finland Governments are paying increasing attention to international comparisons as they search for effective policies that enhance individuals social and economic prospects, provide incentives for greater efficiency in the provision of education, and help to mobilise resources to meet rising demands. In response to this need, the OECD devotes a major effort to the development and analysis of quantitative, internationally comparable indicators, which are published annually in Education at a Glance. These indicators enable educational policy makers and practitioners alike to see their education systems in the light of other countries performances and, together with OECD s country policy reviews, are designed to support and review the efforts that governments are making towards policy reform. This note contrasts key findings for Finland with global trends among OECD countries, under the headings: quantity and quality challenges, resource and efficiency challenges and equity challenges. Education at a Glance 2008, as well as its executive summary and the underlying data can be downloaded free of charge at Questions can be directed to: Andreas Schleicher Head, Indicators and Analysis Division OECD Directorate for Education Tel: , Andreas.Schleicher@OECD.org 1
60 QUANTITY AND QUALITY CHALLENGES The decades-old expansion in educational participation and outputs continues and at a pace that outstrips many past projections. With completion of upper secondary education close to universal in most OECD countries, the greatest recent expansion has come in the tertiary sector. While, in 1995, 37% of a cohort went into university-level programmes it is now 57%, on average across OECD countries. It is hard to predict the future from past trends. Will the expansion of tertiary education continue at this rapid pace, driven by an ever-rising demand for the highly skilled? Or will it level off and will relative earnings decline? At the beginning of the 20th century, few would have predicted that, among OECD countries, upper secondary education would be largely universal by the end of the century. So it is equally difficult to predict how tertiary qualifications will have evolved by the end of the 21st century. Education at a Glance 2008 provides a profile of educational qualifications in populations as well as indicators on trends in the quantity and quality of the output of educational institutions. For the first time, it also relates the qualifications that are produced by the education system to their actual deployment across occupational groups. Global trends Key results for Finland Education systems continue to expand at a rapid pace Tertiary attainment levels have increased substantially, for the first time reaching one-third of the cohort of 25-to-34-year-olds, on average across OECD countries. In France, Ireland, Japan and Korea, there is a difference of 25 percentage points or more in tertiary attainment between the older and younger age group (Table A1.3a). Between 1995 and 2006 alone, the university-level graduation rate rose, on average across countries, from 20 to 37% (Table A3.2) and more than half of those at the typical age of graduation completed their first tertiary-type A degree in Australia, Finland, Iceland and New Zealand (Table A3.1). The social sciences, business and law are the major educational fields in most countries. Across OECD countries, they constitute 28% of the overall tertiarytype A attainment in the population. On average, there are 3.6 times as many individuals with degrees in these fields in the younger cohort entering the labour market than in the older one nearing retirement age. By contrast, in the field of education, this ratio is close to 1 in the OECD countries (Table A1.5). and current entry rates suggest that these trends will continue. Entry rates in tertiary-type A education increased substantially between 1995 and 2006, by 20 percentage points on average in OECD countries. Between 2000 and 2006, growth exceeded 10 percentage points in 11 of the 25 OECD countries for which data are available. In 2006, in Australia, Finland, Hungary, Iceland, New Zealand, Norway, Poland, the Slovak Republic and Sweden, and the partner country the Russian Federation, it is estimated that 65% or more of young adults will enter tertiary- 38% of 25-to34-year-olds in Finland have a tertiary qualification. Whereas, 27% of 55-to-64-year-olds have attained a tertiary qualification, it is now 38% among 25-to-34-yearolds (OECD average 33%) (Table A1.3a). Finland comes in as number one in terms of graduation rates from upper secondary programmes designed to prepare students for tertiary-type A education, over 90% (Table A2.2). This is probably a main factor which helps to secure Finland s top-5 status in terms of entry rates into tertiary education (over 70%). Only Australia, Iceland and Poland have higher entry levels (Table A2.4). Finland continues to produce an above-average tertiary graduation rate The graduation rate for first degree programmes in Finland remains, at 47%, significantly above the OECD average of 37% (Table A3.1). 2.1% obtain an advanced research qualification such as a Ph.D. well above the OECD average of 1.4%, putting Finland among the six countries with highest results on this indicator. International students make an increasing contribution to the tertiary graduate output in Finland. Among tertiary-type A second degrees (mainly Masters programmes) and advanced research programmes (including PhDs), but still no more than one-tenth of the graduate output can be attributed to international graduates (3% for tertiary-type A degrees and 10% for advanced research programmes) (Table A3.3). Compared to 2000, the number of foreign students enrolled in tertiary education in 2006 increased by 61% (Table C3.1). The enhanced attractiveness of Finland is likely related to the provision of many education programmes in English, and the absence of tuition fees for international as for domestic students.
61 type A programmes. In almost all countries, the majority of new entrants choose to follow tertiary programmes in the field of social sciences, business, law and services (Tables A2.4, A2.5 and A2.6). Overall, females represent 54% of new entrants in tertiary education in OECD countries. However, the breakdown by gender varies considerably according to the field of education. In the fields of health and welfare, the arts and humanities, and education between 68 and 75% of new entrants are women. The proportion of women choosing science studies (including life sciences, physical sciences, mathematics, computing, engineering, manufacturing and construction and agriculture) ranges from less than 25% in Japan, the Netherlands, Spain and Switzerland and the partner country Chile, to more than 35% in Denmark, Iceland, Italy and New Zealand (Table A2.6). but growth has levelled off In 2002 Finland had, at 49%, the highest graduation rates for tertiary-type A programmes, well above the OECD average which stood at 31% (Table A3.2). The graduation rate in Finland had decreased to 48% by 2006, while the OECD average increased to 37%, with three countries now showing higher graduation rates: Australia, Iceland, New Zealand (Table A3.2). Rates of current participation suggest that more countries are likely to surpass Finland graduation rates. The increase in tertiary enrolment between 1995 and 2005 was, at 18%, considerably below the OECD average level of 40% and well below increases in the Czech Republic, Greece, Hungary, Iceland, Korea, Mexico, Poland, Portugal, the Slovak Republic and Sweden and partner countries Brazil, Chile, Estonia and Israel, that ranged from 44% to 161% during the same period (Table B1.5). although a recent rise in new entrants may reverse the picture in the future. The most recent figures on entry rates to tertiary-type A programmes show a sharp rise from 73% in 2005 to 76% in 2006, the first increase since 2003 (Table A2.5). In Australia, Hungary, Iceland, New Zealand, Norway, Poland, the Slovak Republic, Sweden and the United States as well as the Russian Federation more than 60% of young people entered tertiary-type A programmes in 2006 (Table A2.4). Post-secondary practical, technical or occupational skills programmes ( Tertiary-type B ) in Finland are being phased out and the proportion of the age cohort graduating from these programmes has consequently fallen rapidly. Finland continues to turn out a high proportion of science graduates. In Finland, there are some people with universitylevel or advanced research qualifications in science per employed year-olds, compared with an OECD average of (Table A3.6). However, a comparison of younger to older age groups with science as a field of study shows that the increase in science graduates over recent decades has been faster in OECD countries on average than in Finland. The ratio of 25-to-34-year-olds with a university-level science qualification plus 30-to-39-year-olds with an advanced research qualification to 55-to-64-year-olds with a university-level or advanced research qualification in science is 1.6 in Finland, compared with an OECD average of 4.1. The largest difference between the young and the old age group in Finland is in the field of health and welfare where the ratio is 3.9 (only Portugal is doing better with 4.9) compared with an OECD average of 2.2, suggesting a substantial shift towards this field of education among 3
62 younger individuals (Table A1.5). This expansion relates to strong labour-market outcomes for those with advanced qualifications. Earnings increase with each level of education. Those who have attained upper secondary, postsecondary non-tertiary or tertiary education enjoy substantial earnings advantages compared with those of the same gender who have not completed upper secondary education (Table A9.1a). In 15 out of 21 countries with available data, the earnings premium for those with tertiary education increased during the last decade, often despite massive growth in tertiary participation. In Germany, Hungary, and Italy this increase has been between 30 and 40 percentage points (Table A9.2a). On average across countries, completion of tertiary education yields a 12 and 11% return for males and females, respectively, and returns are above 22% for males in the Czech Republic, Poland and Portugal. The rewards for tertiary education are relatively small in Germany, Norway, Spain, and Sweden where the rate of return ranges from 5 to 8% (Table A10.2). In most countries, the returns to investment in tertiary education in mid-career are lower, but still substantial enough to motivate the investment without government intervention (Table A10.4). Employment rates rise with educational attainment. With few exceptions, the employment rate for graduates of tertiary education is markedly higher than the rate for upper secondary graduates. For males, the gap is particularly wide between upper secondary graduates and those without an upper secondary qualification (Table A8.1a). Those with low educational attainment are both less likely to be labour force participants and more likely to be unemployed. Differences in employment rates between males and females are also wider among less educated groups. The labour-market penalties for low levels of education are particularly high for females. The chance of being employed is 23 percentage points higher for males than for females among those without upper secondary qualifications but falls to 10 points for the most highly qualified (Tables A8.1a and A8.2a). Employment rates tend to drop long before the stipulated retirement age in most countries. On average, employment rates among 55-to-64-year-olds are approximately 20 percentage points below those of the total working-age population (25-to-64-year-olds). However, employment rates increase with educational attainment in most countries, and in all countries The labour-market benefits of tertiary education are high in Finland In Finland, the earnings advantage for tertiary level graduates aged 25 to 64 over persons with an upper secondary qualification is 49% (Table A9.1a). Tertiary graduates in Finland also have a much greater chance of finding jobs (Table A8.3a). The earnings advantage of year-old tertiary graduates increased slightly in Finland from 48% in 1997 to 49% in 2004 (Table A9.2a). This suggests that the incentives for obtaining a tertiary qualification remain stable, despite the growth in tertiary qualifications. but vary somewhat between males and females. Although evidence that higher education brings earnings advantage for both males and females, males benefit more than females in Finland. Conversely in Australia, Austria, Canada, Korea, the Netherlands, New Zealand, Norway, Spain, Switzerland, Turkey and the United Kingdom, tertiary education enhances earnings relative to upper secondary education more for females than for males, year-old age group at tertiary level of education (Table A9.1a). The gender earnings differentials with the same educational attainment remain large. All levels of education included, the earnings of females between the age of 30 and 44 range from 51% of those of males in Korea, to 84% of those of males in Luxembourg; in Finland this rates is 70% (Table A9.1b). The private rates of return for education are strong even if below the OECD average... Regarding private rates of return to tertiary education as well as the private rates of returns to upper secondary education or post-secondary non-tertiary education for males, Finland has among the eight highest rates (out of 19 OECD countries with available data). The private rates of return to tertiary education study in Finland are at 10.7% for males and 9.3% for females, just below the OECD average rates 12% for males and 11% for females (Table A10.1). Private rates of returns to upper secondary education or post-secondary non-tertiary education are below rates for tertiary education, standing at 10.2% for males and 7.9% for females (table A10.2). Weighing up the costs and benefits of education, the private rates of returns to both upper secondary education or post-secondary non-tertiary education and tertiary education shows relatively large differencies between males and females in Finland (2.3 and 1.4 percentage point difference, respectively) (Tables A10.1 and A10.2).
63 except Iceland, tertiary attainment provides an important employment advantage at an older age. The advantage is particularly large in the Czech Republic, Italy, Luxembourg and the Slovak Republic (Table A8.4). There are also marked shifts towards more skilled jobs in labour markets. Across OECD countries between 1998 and 2006, there was a marked shift from semi-skilled jobs to skilled jobs, with an increase of almost 4 percentage points in skilled occupations and a close to 4 percentage point decline in semi-skilled occupations. In most countries, the decline has not been at the very low end of the skills distribution but among semiskilled jobs, with the proportion of the population working in unskilled occupations remaining substantially unchanged (Table A1.6). The proportion of skilled jobs is generally larger than the potential supply of tertiary graduates In OECD countries, the proportion of skilled jobs in the economy is generally larger than the potential supply of tertiary educated individuals. For countries in which work-based learning is central to occupational advancement, this difference is large. A broader initial skill base might require additional investment in higher education. In a few countries, tertiary attainment matches or marginally exceeds the proportion of skilled jobs, so that further expansion of higher education will to some extent depend on the growth of skilled jobs in the coming years (Tables A1.3a and A1.6). but more recently the growth in the proportion of people with tertiary qualifications has generally been faster than the growth in skilled jobs, suggesting that the gap is closing. The increase in skilled jobs has been met and exceeded in most OECD countries by increases in the proportion of the population with tertiary attainment. However, in most countries, there are still substantially more skilled jobs than tertiary educated individuals. On average, across OECD countries, 69% of all those with a tertiary type 5B qualification and 85% of those with a tertiary 5A/6 qualification have skilled jobs. However the matching of higher education to skilled jobs varies substantially among countries. Those with a tertiary 5A/6 qualification in Denmark, Finland, Luxembourg and the partner country Slovenia do substantially better in finding a skilled job given labour market conditions for those with tertiary education (Tables A1.6, A1.7, A3.2). Finland saw a shift towards more skilled jobs in labour markets.. As in most other contries, the proportion of skilled occupations in Finland increased by as semi-skilled occupations decline. Between 1998 and 2006, Finland saw a rise in the proportion of skilled occupations from 44 to 48%, comparable to the OECD average of 4 percentage point (Table A1.6). The number of skilled jobs to be filled still outnumbers the supply of tertiary educated individuals. The difference between the proportion of 25-to-64-yearolds in skilled jobs and the proportion of 25-to-64-year-olds with tertiary education is 13 percentage points in Finland indicating that further expansion of tertiary education can still be an option, although this difference is not as pronounced as in many other countries (Tables A1.3a and A1.6). In Finland, the proportion of the working population with tertiary-type A or advanced research qualification who are in skilled jobs (92%) is above the OECD average, but a larger proportion than the average are legislators, senior officials or managers (19% against and OECD average of 14% in that occupational group), the fourth highest proportion among OECD countries (Table A1.7). 5
64 The internationalisation of tertiary education is proceeding rapidly. In 2006, over 2.9 million tertiary students were enrolled outside their country of citizenship. This represented a 3% increase from the previous year in total foreign student intake reported to the OECD and the UNESCO Institute for Statistics (Box C3.1). Student mobility i.e. international students who travelled to a country different from their own for the purpose of tertiary study ranges from below 1 to almost 18% of tertiary enrolments across OECD countries. International students are most numerous in tertiary enrolments in Australia, Austria, New Zealand, Switzerland and the United Kingdom (Table C3.1). France, Germany, the United Kingdom and the United States receive 49% of all foreign students worldwide. The largest absolute numbers of international students from OECD countries are from France, Germany, Japan and Korea. Students from China and India comprise the largest numbers of international students from partner countries (Chart C3.2). International students make up 15% or more of the enrolments in tertiary education in Australia and New Zealand and more than 20% of enrolments in advanced research programmes in Belgium, Canada, New Zealand, Switzerland, the United Kingdom and the United States (Table C3.1).C3.1). 30% or more of international students are enrolled in sciences, agriculture or engineering in Finland, Germany, Hungary, Sweden, Switzerland and the United States (Table C3.5). New analyses of PISA data provide a first picture of school education from the perspective of parents. Among the 10 OECD countries with available data, on average, 77% of parents strongly agreed or agreed that standards of achievement were high in their child s school. On average, their children scored 20 score points higher on the PISA 2006 assessment than students whose parents disagreed or strongly disagreed with that statement. Much of the advantage remains when taking into account socio-economic factors (Table A6.2). An average of 79% of parents reported being satisfied with the disciplinary atmosphere in their child s school and 85% felt that the school did a good job of educating students. In both cases, their children had a performance advantage of 12 score points on average (Table A6.2b). 0.3% of foreign students worldwide are enrolled in Finland (Table C3.3). The extent of internationalisation is most pronounced in advanced research programmes, where foreign students represent 7.5% of enrolments, (and 10% of PhD. graduates) compared with tertiary type A, where international students represent less than 3% (and 3% of tertiary type A graduates). This is much below the level observed in the OECD enrollements averages: 18.5 and 8.5%, respectively (Table C3.1). Between 2000 and 2006, the number of foreign students enrolled in Finland increased by 61%, as a consequence the international education market share of Finland increased very slightly from 0.29% to 0.31% (Table C3.1 and Table C3.7 on the web). international students enroll in science and engineering programmes (9.8% and 29.9% of the total respectively). Large proportionof international students also enroll in social sciences, business and law, as well as in humanities and arts (23.7% and 16.4%, respectively) (Chart C3.4 and Table C3.5). International students have no tuition fees to pay, hence they provide no source of income for national universities (Box C3.3). [No data available for Finland]
65 On average, 88% of parents strongly agreed or agreed that their child s teachers seemed competent and dedicated, but the relationship to student performance was inconsistent across countries, with an average advantage of 7 score points (Table A6.3a). For the first time, the indicators compare approaches to monitoring school standards. A total of 22 OECD and partner countries undertake student examinations and/or assessments and 17 require schools to be evaluated (either selfevaluations and/or inspections by an external body) at regular intervals. Student assessments (evaluations without civil effect for the student) are practised in 17 OECD and partner countries, whereas national examinations (with a civil effect for the student) are practised in 10 OECD and partner countries (Tables D5.1 and D5.2). School self-evaluations are required in 14 countries, generally on an annual basis (Table D5.6). School inspections are required in 14 countries, generally once every three years (Table D5.5). Although school self-evaluations are held more often than school inspections, evaluations by school inspectoratesappear in general to have more influence on schools and teachers in terms of the implications of the evaluation and the accountability structure (Tables D5.5 and D5.6). Both school evaluation and student performance measures are mainly used to provide performance feedback to schools (Tables D5.3 to D5.6). In general, they have relatively little influence on school financing and other financial implications such as changes to the school budget, provision of rewards or sanctions for schools, or remunerations and bonuses received by teachers (Tables D5.3 to D5.6). In a larger number of countries, the influence of school evaluations is greater than student examinations for the performance appraisals of schools (13 countries, compared to 7 for student examinations), for the appraisal of the performance of school management (9 countries, compared to 1 for student examinations) and the appraisal of the performance of individual teachers (4 countries, compared to 1 for student examinations) (Tables D5.3 to D5.6). Finland places relatively low emphasis on assessment and evaluation. At the lower secondary level, Finland does not have national examinations but national periodical assessments in place for mathematics and national language, which are compulsory (Tables D5.1 and D5.2). The potential influence of assessments on performance feedback to schools is moderate. Finland does not make the results of the assessments publicly available (Table D5.4). 7
66 RESOURCE AND EFFICIENCY CHALLENGES Meeting the demand for more education while improving quality is bound to create pressures for current levels of spending to be maintained or increased and to improve the efficiency of spending on education. Recent years have already seen considerable rises in spending levels, both in absolute terms and as a share of public budgets. The total amount of funds allocated to educational institutions across all levels of education rose in all countries with available data over the last decade, and by 19% on average in real terms between 2000 and 2005 alone. By 2005, OECD countries were spending 6.1% of their collective GDP on education at all levels, of which 86% came from public sources and all but 7 of the 28 OECD countries spent at least 5%. Another visible indication of the efforts made by governments can be found in the fact that from 1995 to 2005, public expenditure on education grew by more than one percentage point as a proportion of all public spending from 11.9% to 13.2% in Education spending rose at least as fast as public spending in other sectors in all countries except Canada, France, Hungary, Portugal and Switzerland. Alongside the increase in public spending on education, there has also been a search for new sources of funding to accommodate the rapid growth in student numbers (particularly at the tertiary level) and to increase the resources available to educational institutions. Although 86% of spending on education still originates from public sources for all levels of education combined, private spending increased more rapidly than public spending between 1995 and 2005 in nearly three-quarters of the countries examined. In some, the proportion of private funding of tertiary educational institutions is high enough to challenge the view that tertiary education is solely a state responsibility. In fact, this view is gradually being replaced by the perception that, given the shared public and private returns that education brings, costs and responsibilities for its provision should also be shared between those who directly benefit and society at large (i.e. private households and businesses as well as governments), at least at the tertiary level of education. While significant additional investments in education will be important, it is equally clear that more money alone will not be enough. Investments in education will also need to become more efficient. The education sector has not yet re-invented itself in ways that other professions have done to improve outcomes and raise productivity. Indeed, the evidence suggests the reverse, namely that productivity in education has generally declined because the quality of schooling has broadly remained constant, while the price of the inputs has markedly increased. As the place and mode of educational provision have largely remained unchanged, the labour-intensiveness of education and the predominance of teachers salaries in overall costs (with payscales based on qualifications and automatic increases) have made personnel costs rise over time. This edition of Education at a Glance provides a first picture of the spending choices that different countries are making. Global trends Key results for Finland OECD countries as a whole spend USD per student annually between primary and tertiary education: USD per primary student, USD per secondary student and USD per tertiary student. These expenditures continue to rise in real terms. Expenditure on educational institutions per primary, secondary and post-secondary non-tertiary student increased in every country and on average by 35% between 1995 and 2005 during a period of relatively stable student numbers. The pattern is different at the tertiary level where spending per student has fallen in some cases, as expenditure has not kept up with the expansion in student numbers. However, from 2000 to 2005, expenditure on educational institutions per tertiary student increased by 11 percentage points on average in OECD countries after remaining stable from 1995 to Only Australia, Austria, Denmark, Greece, Spending per student in Finland is above the OECD average at the tertiary level but below average at the primary and secondary levels. To assess their potential impact on the quality of educational services, the resources invested in education need to be seen in relation to the number of students enrolled. On that measure, spending per student across all levels of education (excluding pre-primary education) in Finland is, at USD (equivalent), slightly above the OECD average of USD (Table B1.1a). Spending per student at the primary level (USD 5 557) in Finland is below the corresponding OECD average (USD 6 252), and spending per student at the secondary level (USD 7 324) is similarly below the OECD average (USD 7 804). At USD , spending at the tertiary level exceeds the OECD average of USD (Table B1.1a). Different supply and demand factors have influenced
67 Iceland, Mexico, Poland, Portugal, Spain, Switzerland and the United Kingdom saw a larger increase in expenditure on educational institutions per tertiary student than in GDP per capita (Tables B1.4 and B1.5). Seven out of the 11 countries in which student enrolments in tertiary education increased by more than 20 percentage points between 2000 and 2005 have increased their expenditure on tertiary educational institutions by at least the same proportion over the period, whereas Hungary, Sweden and the partner countries Brazil and Chile did not (Table B1.5). Teacher compensation cost per student at the upper secondary level varies from 3.9% of GDP per capita in the Slovak Republic (less than half the OECD average rate of 10.9%) to over five times that rate in Portugal (20.9%, nearly twice the OECD average). Four factors influence these trends salary levels, the amount of instruction time for students, the amount of teaching time required of teachers and average class size so that a given level of compensation cost per student can result from quite different combinations of the four factors. For example, in Korea and Luxembourg, the compensation cost per student (as a percentage of GDP per capita) is 15.5 and 15.2%, respectively, both notably higher than the OECD average. However,whereas in Korea higher than average teacher salary levels coupled with relatively large class sizes are the main influence on this, in Luxembourg, relatively low class size is the main factor which results in such a high teacher compensation cost per student (as a proportion of GDP per capita) compared to the OECD average (Table B7.2). In countries with the lowest compensation cost per student (as a percentage of GDP per capita) at the upper secondary level, low salary levels as a proportion of GDP is usually the main driver. This is the case in Iceland, Ireland, Norway, Poland, the Slovak Republic and Sweden. The main exception to this pattern is Mexico where teacher salary costs relative to GDP per capita are well above the OECD average but this is more than compensated for by large class sizes (Table B7.2). In contrast, among countries with the highest levels of compensation cost per student (Portugal, Spain, Switzerland), no single factor determines this position, but rather each of the four factors act to increase costs to varying degrees (Table B7.2). High spending per student cannot automatically be equated with strong performance by education systems. Spending per student up to the age of 15 in the Czech Republic is roughly one-third of, and in variation in spending per student across countries. In Finland, between 1995 and 2005, spending on primary and secondary education increased by 38% while enrolments rose by 13%, resulting in a spending increase per student of 22%. That is significantly less than the OECD average increase of 34% in per-student spending (Table B1.5). Finland shows low level of spending per child in preprimary education, consistent with low participation. Finland invests less per child than other countries (except Czech Republic, Japan, Korea, Mexico, Poland, Slovak Republic, Switzerland) at the pre-primary level (at USD 4 395, unit spending is lower than the OECD average spending per child of USD 4 888) (Table B1.1a). This is consistent with the relatively low rate of participation of 4-year-olds at 44% compared with 69.4% on average across OECD countries (Table C2.1) At the upper secondary level, average costs per student are driven by higher average class sizes. In an analysis new to this year s edition of Education at a Glance, comparisons of salary costs per student (as a percentage of GDP per capita) at the upper secondary level are decomposed into factors that influence these costs. Finland has a lower than average salary cost per student at the upper secondary level. While belowaverage teaching time increase compensation cost per student relative to the OECD average, relatively high class sizes decrease significantly compensation cost per student relative to the OECD average. (Table B7.2 and chart B7.1). This analysis shows the contrasts with the policy choices made in some other countries. For example, in France, where costs per student are similar to those of the UK, these costs are instead driven by long instruction hours for students, which outweigh the effect of below average teacher salary costs. These comparisons show that the same levels of expenditure can be deployed quite differently and serve to illustrate why the relationship between expenditure and performance is not straightforward. Indeed, cumulative expenditure per student aged between 6 and 15 explains merely 15% of the variation in mean PISA performance in science. Despite cumulative expenditure below the OECD average in Finland (USD against USD ), Finland s mean score in PISA performance in science is the highest (Chart B7.2, Table B7.1). In tertiary education, a below-average increase in spending in Finland exceeded the below-average increase in student enrolment. At the tertiary level, a below-average increase in spending in Finland (29% compared with 57% of 9
68 Korea roughly one-half of, spending levels in the United States. However, while both the Czech Republic and Korea are among the top ten performers in the PISA 2006 assessment of science achievement among 15-year-olds, the United States performs below the OECD average. Similarly, Spain and the United States perform almost equally well, but while the United States spends roughly USD per student up to the age of 15 years, Spain only spends USD (Table B7.1). average across OECD countries) exceeded the belowaverage increase in student enrolment (18% compared with 40% of average across OECD countries), so that spending per student increased by 9% in real terms between 1995 and This was a lower increase in per student spending than across the OECD on average (12%). Finland has the third lowest increase in per student spending but overall the development of expenditure per student at tertiary level was close to OECD average (Table B1.5 and chart B1.7). Expenditure per student at the tertiary level is still well above the OECD average (Table B1.1a). Notably, however, there are also 6 countries where spending per student has fallen. In Hungary and Ireland, spending per student has fallen by about 10% or more, as spending levels have not kept pace with expanding student numbers (Table B1.5). In the context of increase in tertiary student numbers, the student to teacher ratio at tertiary type A level in Finland has slightly increased from 15.7 in 1999 to 15.8 in 2006, against the trend across OECDcountries, where the average ratios decreased from 16.2 to 15.3 (Table D2.2 and Education at a Glance 2001 Table D5.1). High completion rates are an indicator of educational efficiency. In Finland, 72% of those who enter tertiary-type A programmes go on to successfully complete their programme. This is just above the OECD average of 69%. However, Finland was the 6 th highest rate out of 19 OECD countries with available data (table A4.1). OECD countries spend 6.1% of their collective GDP on educational institutions. However, the increase in spending on educational institutions between 1995 and 2005 fell behind growth in national income in nearly half of the 28 OECD countries for which data are available. The highest spenders on educational institutions are Denmark, Iceland, Korea, the United States and the partner country Israel, with at least 7% of GDP accounted for by public and private spending on educational institutions, followed by Mexico and New Zealand with more than 6.5%. By contrast, seven out of 28 OECD countries for which data are available as well as three out of six partner countries spend less than 5% of GDP on educational institutions; in Greece and in the partner country the Russian Federation, the figure is 4.2 and 3.8%, respectively (Table B2.1). Tertiary education accounts for nearly one-third of the combined OECD expenditure on educational institutions (2.0% of the combined GDP). In Canada Starting from a comparatively high base by OECD standards, Finland investment in education has decreased, not in absolute terms but relative to national income. Over the period , spending on educational institutions in Finland increased by 36%, which is low compared to the OECD average, 42%. Over the same period, GDP increased by 43%, which is higher than the 37% on average across OECD. As a result, total expenditure on educational institutions as a percentage of GDP decrease by 0.30 percentage point while OECD on average registered an increase of 0.15 percentage point. (Tables B2.1 and B2.3). Finland is the 8 th country among 12 OECD countries with the decreasing educational expenditures as a percentage of GDP over this 10-year period (Tables B2.1). Expenditure in school education increased between 1995 and 2005 by 36% and by 43% in tertiary education.
69 and the United States, expenditure at this level reaches up to 40% of expenditure on educational institutions (Table B2.1). Relative to GDP, the United States spends over three times more on tertiary education than Italy and the Slovak Republic and nearly four times more than the partner countries Brazil and the Russian Federation. On average across OECD countries, expenditure for all levels of education combined increased relatively more than GDP between 1995 and The increase in expenditure on educational institutions as a proportion of GDP exceeded 0.8 percentage points over this decade in Denmark, Greece, Mexico and the United Kingdom (Table B2.3). In all countries, public funding on educational institutions increased between 1995 and However, private spending increased faster in nearly three-quarters of these countries. On average over 90% of primary, secondary and post-secondary non-tertiary education in OECD countries, and other than in Korea, no less than 80%, is paid for publicly (Table B3.2a). In tertiary education the proportion funded privately varies widely, from less than 5% in Denmark, Finland and Greece, to more than 40% in Australia, Canada, Japan, New Zealand, the United States and in the partner country Israel, and to over 75% in Korea and the partner country Chile. As with tertiary graduation and entry rates, the proportion of private funding can be influenced by the incidence of international students who form a relatively high proportion of the student body in Australia and New Zealand (Table B3.2b). On average among the 18 OECD countries for which trend data are available, the share of public funding in tertiary institutions decreased slightly from 79% in 1995 to 77% in 2000 and to 73% in However, the increase in private investment has not displaced but complemented public financing, the amount of public funding has simply tended to increase at a lower rate (Table B3.2b). In eight out of the 11 OECD countries with the largest increase in public expenditure on tertiary education between 2000 and 2005, tertiary institutions charge low or no tuition fees. The exceptions are Korea, the United Kingdom and the United States (Indicator B5). In tertiary education, households account for most private expenditure in most countries for which data are available. Exceptions are Canada, Greece, Hungary, the Slovak Republic and Sweden where (Table B2.3). Finland s share of capital spending in tertiary institutions is only half of the OECD average. Below the tertiary level, the proportion of spending on capital costs in Finland is, at 8.6%, slightly above the OECD average level of 8.2% (Table B6.2b). In contrast, the share of capital spending at the tertiary level is, at 4.2%, considerably below the OECD average of 9.5% (Table B6.2b). Public funding on educational institutions remains above the OECD average in Finland but private funding is increaseasing somewhat. Taking all levels of education together, private spending in Finland rose faster than public spending between 2000 and 2005 as was the case in nearly threequarters of the countries with comparable data, but only Mexico, Portugal, the Slovak Republic and the United Kingdom recorded increase of more than 5 percentage points (Table B3.1). [Note that private spending originates both in households and other private entities and can go to private as well as public institutions.] The proportion of public expenditure on educational institutions for primary, secondary and post-secondary non tertiary education represented 99.5% in Finland in 1995 and remains at 99.2% in 2005 (Table B3.2a EAG 2007, Table B3.2a). In 2005, The proportion of public expenditure on educational institutions for all levels of education in Finland, 97.8% is the highest above the OECD average standing at 85.5% (Table B3.1). On the one hand, public spending on tertiary education in Finland rose by 14% between 2000 and 2005, while average relative proportion of public expenditure across OECD increased by 26%. At the same time, private spending increased by 62%, representing 1/3 of the OECD average increase (Table B3.2b). At the pre-primary level, where the relative proportions of public and private funding range from 100% public in Sweden to 41.1% in Korea, the public funding share in Finland remained at 91.1% in 2005, significantly above the OECD average of 80.2% (Table B3.2a). At the primary and lower secondary levels in Finland, the private share of funding increased from 0.7% to 0.8% (the smallest increase in percentage points with Belgium, France, Portugal and Sweden). Moreover, in 11
70 private expenditure from entities other than households is more significant (Table B3.2b). On average, OECD countries devote 13.2% of total public expenditure to education, but values for countries range from 10% or below in the Czech Republic, Germany, Italy and Japan to more than 23% in Mexico. Between 1995 and 2005, education took a growing share of total public expenditure in most countries, and on average grew at a similar pace than GDP. Denmark, the Netherlands, New Zealand, the Slovak Republic, Sweden and the partner country Brazil saw the largest shifts in favour of education (Table B4.1). On average across OECD countries, 85% of public expenditure on education is transferred to public institutions. In two-thirds of OECD countries, as well as in the partner countries Brazil, Estonia and Slovenia, the share of public expenditure on education going to public institutions exceeds 80%. The share of public expenditure transferred to the private sector is larger at the tertiary level than at primary to postsecondary non-tertiary levels and reaches 26% on average among OECD countries for which data are available (Table B4.2). There are large differences among OECD countries in the average tuition fees charged by tertiary-type A public institutions, as well in how students pay for them. In eight OECD countries public institutions charge no tuition fees, but in one-third of countries public institutions charge annual tuition fees for national students in excess of USD Among the EU19 countries, only the Netherlands and the United Kingdom have annual tuition fees that represent more than USD per full-time student; these relate to government-dependent institutions (Table B5.1a). When tuition fees are charged, tertiary institutions are responsible for setting tuition fee levels in almost all countriesas well as. Only the Netherlands, Spain and Switzerland have levels of tuition fees set exclusively by educational authorities (at central, regional or local levels) at least for some of their tertiary institutions (Table B5.1d).B5.1d). An average of 18% of public spending on tertiary education is devoted to supporting students, households and other private entities. In Australia, Denmark, the Netherlands, New Zealand, Norway, Sweden and the partner country Chile, public subsidies to households account for some 27% or more of public both years this represented the lowest private funding proportions with Portugal and Sweden among the 26 OECD countries reporting data for both years (Table B3.2a). Education has received a growing share of the public budget. Over period, the share of all public spending devoted to educational institutions at all levels in the system, or paid in the form of subsidies to households, increased from 11.0 to 12.5% in Finland, while the OECD average increased by 1.3 percentage points (from 11.9 to 13.2%). The share of public expenditure devoted to education has increased in Finland mainly over the period and has remained stable between 2000 and 2005 (Table B4.1). Finland and its neighbours continue to not charge tuition fees for higher education. In Finland as well as the other Nordic countries (Denmark, Iceland, Norway and Sweden) tertiary education is typically free of any tuition fees (Chart B5.1). At the same time students in Finland, as well as the other Nordic countries, also generally enjoy generous government back scholarships and loans for covering living expenses during their tertiary studies (Chart B5.3) which makes higher education an attractive alternative for young adults. This is also evident in the entry rates at tertiary-type A level of education which is at 76% in Finland, substantially above the OECD average of 56% (table A2.5). These generous terms are however paid back later in the working life as individuals are progressively taxed in accordance with their earnings.
71 tertiary education budgets (Table B5.2). Low annual tuition fees charged by tertiary-type A institutions are not systematically associated with a low proportion of students who benefit from public subsidies. In tertiary-type A education, the tuition fees charged by public institutions for national students are negligible in the Nordic countries and in the Czech Republic and are low in Turkey. And yet more than 55% of the students enrolled in tertiary-type A education in these countries can benefit from scholarships/grants and/or public loans. Moreover, Finland, Norway and Sweden are among the seven countries with the highest entry rate to tertiary-type A education. OECD countries in which students are required to pay tuition fees and whocan benefit from particularly large public subsidies do not show lower levels of access to tertiary-type A education than the OECD average. For example, Australia (82%) and New Zealand (79%) have among the highest entry rates to tertiary-type A education, and the Netherlands (59%) and the United States (64%) are above the OECD average. The United Kingdom (51%) and partner country Chile (48%) are just below the OECD average (54%), although entry to tertiary-type A education increased by 4 and 6 percentage points, respectively, between 2000 and 2005 in these countries. Instruction time, teachers salaries, and studentteacher ratios vary widely among countries, which affects the level of expenditure per student. The choices countries make about how many hours and years students spend in the classroom and the subjects they study reflect national priorities and preferences. Budgetary considerations also help shape education: Teachers salaries represent the largest single cost in providing school education and, as such, are a critical consideration for policy-makers striving to both maintain the quality of education and to contain spending. While class size has become a hot topic in many OECD countries, evidence on its impact on student performance is mixed. Differences in teachers salaries, along with other factors such as student-to-staff ratios (see Indicator D2), provide some explanation of the differences in expenditure per student (see Indicators B1 and B7). Salaries of teachers with at least 15 years experience at the lower secondary level range from less than USD in Hungary and in partner countries Chile and Estonia to USD or more in Germany, Korea and Switzerland, and exceed USD in Luxembourg (Table D3.1). Finland continues to support teachers with high salary increases but salaries are generally still below the OECD average. Newly qualified teachers in Finland at primary level can expect to earn a yearly salary of USD , just below the OECD average of USD Salaries rise with experience: teachers in primary level earn USD after 15 years of experience. The OECD average after 15 years is slightly higher at USD (Table D3.1). As it is the case in most OECD countries, teachers s salaries also increase with the level of education being taught. For example, the salary of an upper secondary teacher with 15 years experience varies from 1% higher than that of a primary school teacher with the same experience in the United States to 47% in the Netherlands; Finland standing at 19% just above the OECD average at 15% (Table D3.1). Between the period 1996 and 2006, salaries in Finland for newly trained teachers rose by 32%, 30% and 27% for teachers in primary, lower secondary and upper secondary level respectively. This marks one of the highest salary increases in OECD area, with only Hungary providing a higher increase at all levels (Table D3.2). 13
72 Salaries for teachers with at least 15 years experience in lower secondary education are over twice the GDP per capita in Korea, whereas in Norway, and in partner countries Estonia and Israel, salaries are 75% or less than the GDP per capita. Teachers salaries have risen in real terms between 1996 and 2006 in virtually all countries, with the largest increases in Finland, Hungary and Mexico (and in starting salaries in Australia) and in partner country Estonia. Salaries at the primary and upper secondary levels in Spain fell in real terms over the period, although they remain above the OECD average (Tables D3.1 and D3.2). On average in OECD countries, upper secondary teachers salaries per teaching hour exceed those of primary teachers by 44%; the difference is 5% or less in New Zealand, Scotland and the partner country Chile and is equal to or greater than 75% in Denmark and the Netherlands (Table D3.2). The average class size in primary education is slightly more than 21 students per class, but varies from 32 in Korea, to fewer than half that number in Luxembourg and the partner country the Russian Federation. The average class size in lower secondary education is 24 students per class, but varies from about 30 or more in Japan, Korea and Mexico and the partner countries Brazil, Chile and Israel, to 20 or fewer in Denmark, Iceland, Ireland (public institutions), Luxembourg and Switzerland and the partner country the Russian Federation (Table D2.1). Between 2000 and 2006, differences in average class sizes among OECD countries have somewhat diminished. Class size tended to decrease in countries that had relatively large class sizes in 2000 (such as Japan, Korea and Turkey) whereas it increased in some of the countries with relatively small class sizes (such as Iceland) (Tables D2.1 and D2.4 available online). Students in OECD countries are expected to receive, on average, hours of instruction between the ages of 7 and 14, of which hours take place between ages 7 and 8, between ages 9 and 11, and between ages 12 and 14. The large majority of intended hours of instruction are compulsory. In OECD countries, 7-to-8-year-olds receive an average of 770 hours per year of compulsory instruction time and 796 hours per year of intended instruction time in the classroom. Those aged 9 to 11 receive about 40 compulsory hours more per year than Although data is unavailable on average class sizes in Finland, information is available on student/teacher ratios which are low in Finland Figures on ratio of students to teaching staff demonstrates the high availability of resources in Finland: the ratio of students to teaching staff is 15.0 for primary schools (OECD average 16.2), 12.9 for secondary education (OECD average 13.2), and 15.8 for tertiary-type A education including advanced research programmes (OECD average 16.0). Finland has the lowest instructions time of all OECD countries The average number of intended instruction hours, of which the large majority are compulsory, in public institutions per year is hours in Finland (between 7 and 14 years) compared with the OECD average of However, instruction time increase with student s age. In Finland, students between the ages of 7 and 8 receive 608 hours per year of compulsory instruction, whereas, students between 9 and 11 years receive 640 hours, students in the 12 to 14 year age bracket receive 777 hours and those aged 15 receive 856 hours (Table
73 7-to-8-year-olds and those aged 12 to 14 receive just over 86 hours more per year than 9-to-11-year-olds (Table D1.1). On average across OECD countries, the teaching of reading, writing and literature, mathematics and science represents nearly 50% of the compulsory instruction time for 9-to-11-year-olds and 40% for 12- to-14-year-olds. For 9-to-11-year-olds, the proportion of compulsory curriculum devoted to reading, writing and literature varies widely from 13% in Australia to 30% or more in France, Mexico and the Netherlands (Table D1.2). The number of teaching hours in public lower secondary schools averages 717 hours a year but ranges from 548 hours in Korea to over in Mexico (1 047) and the United States (1 080). The number of teaching hours in public primary schools averages 812 per year (9 more than in 2005), but ranges from less than 650 in Denmark, Turkey and the partner country Estonia to in the United States (Table D4.1). The average number of teaching hours in upper secondary general education is 667, but ranges from 364 in Denmark to in the United States (Table D4.1). The composition of teachers annual teaching time, in terms of days, weeks and hours per day, varies considerably. For instance, while teachers in Denmark teach for 42 weeks per year (in primary and secondary education) and teachers in Iceland for weeks per year, teachers in Iceland have more total annual teaching time (in hours) than teachers in Denmark (Table D4.1). Regulations concerning teachers working time also vary. In most countries, teachers are formally required to work a specific number of hours; in some, teaching time is only specified as the number of lessons per week and assumptions may be made on the amount of non-teaching time required per lesson (at school or elsewhere). For example, in Belgium (French Community), additional non-teaching hours at school are set at the school level; the government only defines the minimum and maximum number of teaching periods per week at each level of education. D1.1). Not surprisingly, and following trends in other OECD countries, reading, writing and literature takes up the most of instruction time followed by mathematics and science. However this difference between hours of instruction time by subject decreases with student s age. For example reading, writing and literature takes up 21% of compulsory instruction time for 9-to-11 year olds, compared with only 13% of time in 12-to-14 year olds group. For the younger age groups, 18% of time is spent on mathematic whereas it drops to 13% for older children (Table D1.2a and Table D1.2b). In Finland, the teaching load remains comparatively low. The net teaching time for Finnish primary school teachers is, at 673 hours per year, the fourth lowest of the 25 OECD countries with comparable data (the OECD average is 812 hours) (Table D4.1). These relations are similar at the secondary level of education, although differences between the Finland and the OECD average tend to be smaller. For example, net teaching time for upper secondary is 589 hours in Finland and the OECD average is 717 hours. 15
74 EQUITY CHALLENGES While individuals with high level qualifications continue to see strong labour-market returns, those without strong baseline qualifications, defined by the OECD as those who have not attained a qualification at the upper secondary level, have seen rapidly-deteriorating labour market prospects in most countries. It is therefore increasingly important for education and training systems to ensure that young adults leave schools with strong baseline qualifications or attain these subsequently. Education at a Glance 2008 provides a range of indicators on disparities in educational attainment and their labour-market consequences. Global trends Key results for Finland In most OECD countries, virtually everyone now has access to at least 12 years of formal education and full enrolment (defined here as enrolment rates exceeding 90%) tends to begin between the ages of 5 and 6, but there is significant variability both at the beginning and ending of initial education. At least 90% of students are enrolled in education in an age range spanning 14 or more years in Belgium, France, Germany, Hungary, Iceland, Japan, Norway and Spain. In contrast, Mexico and Turkey have enrolment rates exceeding 90% for only nine and six years, respectively; the corresponding figure for the partner country the Russian Federation is nine years (Table C2.1). Enrolment rates for children 4 years or younger range from less than 25% in Korea and Turkey to over 90% in Belgium, Denmark, France, Germany, Iceland, Italy, New Zealand, Spain and the United Kingdom (Table C2.1). Young children are more likely to be enrolled in the countries of the European Union than in other OECD countries (the enrolment rate for 3-to- 4-year-olds averages 76.7% for the EU19, while the OECD average is 69.4%) (Table C2.1). Enrolment rates for 15-to-19-year-olds increased on average from 74 to 81% from 1995 to In Belgium, Greece and Poland, and the partner country Slovenia, they reached more than 90% in 2006 (in Belgium they had already reached this level in 1995). The pattern is similar for 20-to-29-year-olds, an age group in which most students are enrolled in tertiary education; between 1995 and 2006, their enrolment rates increased in all OECD countries except Portugal (Table C2.2). The proportion of individuals who have completed upper secondary education has been growing in almost all OECD countries and is now the norm among the younger cohorts, but a significant minority remains left out. In the last 11 years, the proportion of students graduating from upper secondary programmes has increased by seven percentage points on average in If Finland is among the countries with lowest participation rate of children below 4 years old, they keep improving. 44% of children 4 and under (as a percentage of the population aged 3 to 4) are participating in pre-primary programmes (OECD average 69%). The rate has almost doubled since 1998, when it was at 23.5% (Table C2.1 and Table C1.2 in Education at a Glance 2000). At 87.9%, the enrolment rate for year olds in Finland is above the OECD average of 81.5% and just below rates of the top countries Belgium, Czech Republic, Germany, Greece, Netherlands and Poland (Table C2.1). In Finland, the population has long had high standards of education at the older stage. It is the fith highest enrolment rate of students aged 40 years old and over (3.2%), representing more than twice the OECD average (1.4%)(Table C2.1). Finland s effort to improve overall levels of education and make upper secondary education a norm started in the 1970s, it is thus not surprising for Finland to see its ranking improving along with younger age cohorts. Ranked by upper secondary educational attainment in the population, Finland occupies the 12th position among 55-to-64-year-olds (i.e. those who completed school some 40 years ago) in the 29 OECD countries
75 OECD countries with available data. In 17 of 24 OECD countries, the ratio of upper secondary graduates to the population at the typical age of graduation is 80% or higher and in the Czech Republic, Finland, Germany, Greece, Iceland, Japan, Korea and Norway it exceeds 90%. However, in Luxembourg, Mexico, New Zealand, Spain, Sweden, Turkey and the United States, more than 20% leave school without attaining an upper secondary degree (Tables A1.2 and A2.2). Those who have attained at least upper secondary education enjoy substantial earnings advantages (Chart A9.4). For many countries, the earnings disadvantage of those without upper secondary qualifications has significantly worsened (Table A9.2a). Gender differences in employment and unemployment rates are largest among those without upper secondary education (Chart A8.1) with data, the 8th position among 45-to-54-year-olds, the 7th position among 35-to-44-year-olds and the 6th position among 25-to-34-year-olds. By contrast, Korea s effort started later than in Finland but the increase has been greater. In 2006, Korea ranks 23rd among 45-to-54-year-olds but 1st among 25- to-34-year-olds. Note that the individuals (25-to-34-year-olds in 2006) in this analysis passed the age of sixteen in between 1986 and 1996 (Table A1.2a). High upper secondary graduation rates suggest that this trend will continue. The upper secondary graduation rate in Finland is 95%, compared with an OECD average of 83% (Table A2.1). In Finland, employment rates are are relatively favourable. Since 2001, employment rates among university, upper secondary as well as below upper secondary graduates in Finland have been at or above the corresponding OECD averages. However, the detailed rates for males and females tell a different story. Male employment rates are below OECD averages, while female employment rates are above OECD averages (Table A8.3a, b and c). For those who have not completed upper secondary level of education, employment rates are, at 58.4%, 17.2 percentage points below the corresponding rate for upper secondary education (75.6%), and 26.6 percentage points from the employment rate of those who have completed tertiary education (85.0%) (Table A8.3a). Differences in the employment probabilities accruing to different levels of educational attainment tend to have slightly decreased over the last decade, the differences in 1997 between the precited categories were 17.5 and 27.9 percentage points respectively (Table A8.3a). The penalties from not completing higher education measured as the proportion of the difference in employment rates between levels of education is higher for females than for males. For instance, employment rate of males without upper secondary education is 25 percentage points lower than for males with tertiary education, while the difference reaches 30 percentage points for females. Finland benefits from a balanced distribution of earnings around the median, indicating relatively low disparities. The penalties from not completing upper secondary education are also visible in the distribution of earnings. The share of 25-to-64-year-olds with high incomes 17
76 (defined here as twice the country median or more) is in most countries significantly higher among those with tertiary type A qualifications than among upper secondary graduates. Nonetheless, for Finland, the share of those with tertiary type A qualifications with high income is among the lowest of all OECD countries, at 23% (Table A9.4a). Among 25-to-64-year-olds in Finland without upper secondary qualifications, about 26% earn half or less than the national median (the OECD average is 24%) (Table A9.4a). Some countries have been successful in improving educational opportunities among youths in difficult labour-market situations. Most OECD countries have expanded their education system to accommodate more of the younger cohorts. For 15-to-19-year-olds, recruitment to education has largely taken place among individuals outside the labour market (not in education or employment) and to a lesser extent among employed individuals. With few exceptions, policies to expand education systems have thus helped to lower unemployment and inactivity among young adults (Tables C4.1b). The 15-to-19-year-old population that is not in education is generally associated with being unemployed or out of the labour force. Some countries are better able than others to provide employment for young adults with relatively low educational attainment. In Iceland, Japan and Norway, more than 70% of this age group not in education have employment (Table C4.2a). On average, completing upper secondary education reduces unemployment among 20-to-24-year-olds by 7.4 percentage points and that of 25-to-29-year-olds by 6.2 percentage points. The lack of an upper secondary qualification is a serious impediment to finding employment, and a tertiary qualification further increases the likelihood of job seekers finding employment (Table C4.3). Continuing education and training often does not reach those who need it most. In many countries, non-formal continuing education and training now also plays a significant role in raising the stock of knowledge and skills. There are major differences among countries in the number of hours that individuals can expect to spend in non-formal jobrelated education and training over a typical working life. At the tertiary level, it ranges from less than 350 hours in Greece, Italy and the Netherlands to more than in Denmark, Finland, France and Switzerland (Table C5.1a). Finland has been successful in improving educational opportunities among youths in difficult labour-market situations. In Finland, the 11.9% of the population aged years not in education in 2003, dropped to 8.2% in 2006 (Table C4.4a). This is now the 4 th lowest rate among OECD countries. In 2006, the percentage of this group who are not only out of education but also unemployed is, at 1.7%, the second lowest among the countries compared (Table C4.3). In Finland, the average number of expected years in education among 15-to-29-year-olds is higher for females: 8.8 years compared with 7.9 years for males. Both are much higher than the OECD average of 6.9 years for females and 6.5 for males (table C4.1a). School enrolment rates are high. Despite gains made by OECD country Greece and partner countries in Eastern Europe over the past decade, Finland has continued to rank 7th among OECD countries for enrolment rates among 15-to-19-year-olds (Table C2.2). Finland has ranked 1st for enrolment rates of 20-to-29- year-olds over the past decade, with 30% of 20-to-29- year-olds enrolled in education in 1996, 36% in 1999 and 43% in The intensity of participation in non-formal job-related education and training is comparatively high in Finland. In Finland, between the ages of 25 and 64, the total expected number of hours in non-formal job-related training per worker is 669, above the OECD average of 389 hours (Table C5.1a). Employed women can expect to spend more hours in non-formal job-related education and training than employed men, 701 versus 637, respectively. At below upper secondary level of education, the total expected number of hours in non-formal job-related
77 The relative intensity (number of hours) of nonformal job-related education and training typically increases sharply with educational attainment (except in the United Kingdom, Italy and the Netherlands). The expected hours in non-formal job-related education and training among year-olds with tertiary qualifications is, on average across countries, nearly twice as high as among those with upper secondary qualifications and more than three times as high as among those without upper secondary qualifications (Table C5.1a). An older worker with tertiary education can expect to receive at least 70% of the education and training of a younger worker in Denmark, Sweden and the United States, but the proportion falls below 20% in France, Hungary and the Netherlands. Adults with higher levels of educational attainment are more likely to participate in non-formal job-related continuing education and training than adults with lower educational attainment (Table C5.1a). Countries vary greatly in how well they succeed in enabling students from blue-collar backgrounds to participate in higher education. Ireland and Spain stand out as providing the most equitable access to higher education, whereas in Austria, France, Germany and Portugal students from a blue-collar background are about one-half as likely to be in higher education compared with what their proportion in the population would suggest (Indicator A7). When measuring the socio-economic status of students in higher education by their fathers educational background large differences between countries emerge. In many countries, students are substantially more likely to be in higher education if their fathers completed higher education. Students from such a background are more than twice as likely to be in higher education in Austria, France, Germany, Portugal and the United Kingdom than are students whose fathers did not complete higher education. In Ireland and Spain this ratio drops to 1.1 and 1.5, respectively. Among the countries providing information on the socio-economic status of students in higher education it appears that inequalities in previous schooling are reflected in the intake of students from less advantaged backgrounds. The countries providing more equitable access to higher education such as Finland, Ireland and Spain were also the countries with the most equal between-school performances, as show by data collected in 2000 by OECD PISA. training per worker is almost 500 hours. At the tertiary level of attainment, the expected number of hours in non-formal job-related training per worker is more than hours. In some instances individuals in Finland with attainment below the upper secondary level can expect to spend more hours in non-formal job-related continuing education and training than persons in other countries who have attained a tertiary level of education. Finland is thus one of the more equitable countries in providing education and training for all individuals regardless of their previous education. In line with this is also the high level of participation rate in non-formal job-related education and training (36%) in Finland compared with the OECD average (18%). Against the general trend, there is an increase in expected non-formal job-related learning between the ages of 25 to 34 and 35 to 44 in the Czech Republic, Denmark, Finland and Sweden (Chart C5.3). Finland provides relatively equitable access to higher education In Finland, 48% of students in higher education had fathers who themselves also had a higher education qualification, while this was only the case for 28% of fathers of men in the same age group (Chart A7.2). Among the countries providing information on the socio-economic status of students in higher education it appears that inequalities in previous schooling are reflected in the intake of students from less advantaged backgrounds. Countries providing more equitable access to higher education such as Finland, Ireland and Spain were also the countries with the most equal betweenschool performances in PISA
78 In almost half of the countries, the majority of upper secondary students are enrolled in vocational programmes. However, in key subject areas, the performance of students in vocational programmes tends to lag considerably behind student performance in general programmes. In 13 out of 28 OECD countries and the partner country Slovenia, the majority of upper secondary students are enrolled in pre-vocational and vocational programmes. In most OECD countries, a significant proportion of upper secondary vocational education is school-based (Table C1.1). In OECD countries with available data, vocational qualification is concentrated in engineering, manufacturing and construction at both the upper secondary (34%) and post-secondary non-tertiary (22%) levels (Table C1.2). The 14 OECD countries for which data are available spend, on average, USD 925 more per student on upper secondary vocational programmes than on general programmes (Table C1.3). PISA 2006 shows that 15-year-olds in prevocational and vocational programmes have statistically significant lower performance in science compared to students enrolled in general programmes in 12 out of the 14 OECD countries for which data are available. On average, 15-year-olds enrolled in general programmes score 35 points higher and after adjusting for socio-economic factors a difference of 24 points still remains (Table C1.4). The majority of upper secondary students in Finland are enrolled in vocational programmes. 35% of upper secondary enrolment is in general programmes (OECD average 54%), while 65% is in vocational programmes (OECD average 44%) (Table C1.1). PISA score for pre-vocational and vocational programmes are not available (Table C1.4).
79 21
80 THE WALL STREET JOURNAL FEBRUARY 29, 2008 What Makes Finnish Kids So Smart? Finland's teens score extraordinarily high on an international test. American educators are trying to figure out why. By ELLEN GAMERMAN Helsinki, Finland High-school students here rarely get more than a half-hour of homework a night. They have no school uniforms, no honor societies, no valedictorians, no tardy bells and no classes for the gifted. There is little standardized testing, few parents agonize over college and kids don't start school until age 7. Yet by one international measure, Finnish teenagers are among the smartest in the world. They earned some of the top scores by 15-year-old students who were tested in 57 countries. American teens finished among the world's C students even as U.S. educators piled on more homework, standards and rules. Finnish youth, like their U.S. counterparts, also waste hours online. They dye their hair, love sarcasm and listen to rap and heavy metal. But by ninth grade they're way ahead in math, science and reading -- on track to keeping Finns among the world's most productive workers. Finland's students are the brightest in the world, according to an international test. Teachers say extra playtime is one reason for the students' success. WSJ's Ellen Gamerman reports. The Finns won attention with their performances in triennial tests sponsored by the Organization for Economic Cooperation and Development, a group funded by 30 countries that monitors social and economic trends. In the most recent test, which focused on science, Finland's students placed first in science and near the top in math and reading, according to results released late last year. An unofficial tally of Finland's combined scores puts it in first place overall, says Andreas Schleicher, who directs the OECD's test, known as the Programme for International Student Assessment, or PISA. The U.S. placed in the middle of the pack in math and science; its reading scores were tossed because of a glitch. About 400,000 students around the world answered multiple-choice questions and essays on the test that measured critical thinking and the application of knowledge. A typical subject: Discuss the artistic value of graffiti. The academic prowess of Finland's students has lured educators from more than 50 countries in recent years to learn the country's secret, including an official from the U.S. Department of Education. What they find is simple but not easy: well-trained teachers and responsible children. Early on, kids do a lot without adults hovering. And teachers create lessons to fit their students. "We don't have oil or other riches. Knowledge is the thing Finnish people have," says Hannele Frantsi, a school principal.

81 Visitors and teacher trainees can peek at how it's done from a viewing balcony perched over a classroom at the Norssi School in Jyväskylä, a city in central Finland. What they see is a relaxed, back-to-basics approach. The school, which is a model campus, has no sports teams, marching bands or prom. Fanny Salo in class Trailing 15-year-old Fanny Salo at Norssi gives a glimpse of the no-frills curriculum. Fanny is a bubbly ninth-grader who loves "Gossip Girl" books, the TV show "Desperate Housewives" and digging through the clothing racks at H&M stores with her friends. Fanny earns straight A's, and with no gifted classes she sometimes doodles in her journal while waiting for others to catch up. She often helps lagging classmates. "It's fun to have time to relax a little in the middle of class," Fanny says. Finnish educators believe they get better overall results by concentrating on weaker students rather than by pushing gifted students ahead of everyone else. The idea is that bright students can help average ones without harming their own progress. At lunch, Fanny and her friends leave campus to buy salmiakki, a salty licorice. They return for physics, where class starts when everyone quiets down. Teachers and students address each other by first names. About the only classroom rules are no cellphones, no ipods and no hats. Testing Around the Globe Every three years, 15-year-olds in 57 countries around the world take a test called the Pisa exam, which measures proficiency in math, science and reading.

82 The test: Two sections from the Pisa science test Chart: Recent scores for participating countries Discuss Do you think any of these Finnish methods would work in U.S. schools? What would you change -- if anything -- about the U.S. school system, and the responsibilities that teachers, parents and students are given? Share your thoughts. Fanny's more rebellious classmates dye their blond hair black or sport pink dreadlocks. Others wear tank tops and stilettos to look tough in the chilly climate. Tanning lotions are popular in one clique. Teens sift by style, including "fruittari," or preppies; "hoppari," or hip-hop, or the confounding "fruittari-hoppari," which fuses both. Ask an obvious question and you may hear "KVG," short for "Check it on Google, you idiot." Heavymetal fans listen to Nightwish, a Finnish band, and teens socialize online at ircgalleria.net. The Norssi School is run like a teaching hospital, with about 800 teacher trainees each year. Graduate students work with kids while instructors evaluate from the sidelines. Teachers must hold master's degrees, and the profession is highly competitive: More than 40 people may apply for a single job. Their salaries are similar to those of U.S. teachers, but they generally have more freedom. Finnish teachers pick books and customize lessons as they shape students to national standards. "In most countries, education feels like a car factory. In Finland, the teachers are the entrepreneurs," says Mr. Schleicher, of the Paris-based OECD, which began the international student test in One explanation for the Finns' success is their love of reading. Parents of newborns receive a government-paid gift pack that includes a picture book. Some libraries are attached to shopping malls, and a book bus travels to more remote neighborhoods like a Good Humor truck.

83 Ymmersta school principal Hannele Frantsi Finland shares its language with no other country, and even the most popular Englishlanguage books are translated here long after they are first published. Many children struggled to read the last Harry Potter book in English because they feared they would hear about the ending before it arrived in Finnish. Movies and TV shows have Finnish subtitles instead of dubbing. One college student says she became a fast reader as a child because she was hooked on the 1990s show "Beverly Hills, " In November, a U.S. delegation visited, hoping to learn how Scandinavian educators used technology. Officials from the Education Department, the National Education Association and the American Association of School Librarians saw Finnish teachers with chalkboards instead of whiteboards, and lessons shown on overhead projectors instead of PowerPoint. Keith Krueger was less impressed by the technology than by the good teaching he saw. "You kind of wonder how could our country get to that?" says Mr. Krueger, CEO of the Consortium for School Networking, an association of school technology officers that organized the trip. Finnish high-school senior Elina Lamponen saw the differences firsthand. She spent a year at Colon High School in Colon, Mich., where strict rules didn't translate into tougher lessons or dedicated students, Ms. Lamponen says. She would ask students whether they did their homework. They would reply: " 'Nah. So what'd you do last night?'" she recalls. History tests were often multiple choice. The rare essay question, she says, allowed very little space in which to write. In-class projects were largely "glue this to the poster for an hour," she says. Her Finnish high school forced Ms. Lamponen, a spiky-haired 19-yearold, to repeat the year when she returned. At the Norssi School in Jyväskylä, school principal Helena Muilu Lloyd Kirby, superintendent of Colon Community Schools in southern Michigan, says foreign students are told to ask for extra work if they find classes too easy. He says he is trying to make his schools more rigorous by asking parents to demand more from their children. Despite the apparent simplicity of Finnish education, it would be tough to replicate in the U.S. With a largely homogeneous population, teachers have few students who don't speak

84 Finnish. In the U.S., about 8% of students are learning English, according to the Education Department. There are fewer disparities in education and income levels among Finns. Finland separates students for the last three years of high school based on grades; 53% go to high school and the rest enter vocational school. (All 15-year-old students took the PISA test.) Finland has a high-school dropout rate of about 4% -- or 10% at vocational schools -- compared with roughly 25% in the U.S., according to their respective education departments. Another difference is financial. Each school year, the U.S. spends an average of $8,700 per student, while the Finns spend $7,500. Finland's high-tax government provides roughly equal per-pupil funding, unlike the disparities between Beverly Hills public schools, for example, and schools in poorer districts. The gap between Finland's best- and worst-performing schools was the smallest of any country in the PISA testing. The U.S. ranks about average. Finnish students have little angstata -- or teen angst -- about getting into the best university, and no worries about paying for it. College is free. There is competition for college based on academic specialties -- medical school, for instance. But even the best universities don't have the elite status of a Harvard. Students at the Ymmersta School near Helsinki Taking away the competition of getting into the "right schools" allows Finnish children to enjoy a less-pressured childhood. While many U.S. parents worry about enrolling their toddlers in academically oriented preschools, the Finns don't begin school until age 7, a year later than most U.S. first-graders. Once school starts, the Finns are more self-reliant. While some U.S. parents fuss over accompanying their children to and from school, and arrange every play date and outing, young Finns do much more on their own. At the Ymmersta School in a nearby Helsinki suburb, some first-grade students trudge to school through a stand of evergreens in near darkness. At lunch, they pick out their own meals, which all schools give free, and carry the trays to lunch tables. There is no Internet filter in the school library. They can walk in
85 their socks during class, but at home even the very young are expected to lace up their own skates or put on their own skis. The Finns enjoy one of the highest standards of living in the world, but they, too, worry about falling behind in the shifting global economy. They rely on electronics and telecommunications companies, such as Finnish cellphone giant Nokia, along with forestproducts and mining industries for jobs. Some educators say Finland needs to fast-track its brightest students the way the U.S. does, with gifted programs aimed at producing more go-getters. Parents also are getting pushier about special attention for their children, says Tapio Erma, principal of the suburban Olari School. "We are more and more aware of American-style parents," he says. Mr. Erma's school is a showcase campus. Last summer, at a conference in Peru, he spoke about adopting Finnish teaching methods. During a recent afternoon in one of his school's advanced math courses, a high-school boy fell asleep at his desk. The teacher didn't disturb him, instead calling on others. While napping in class isn't condoned, Mr. Erma says, "We just have to accept the fact that they're kids and they're learning how to live." Write to Ellen Gamerman at ellen.gamerman@wsj.com Printed in The Wall Street Journal, page W1
86 Texas school reformers try to learn lessons from Finland 01:19 PM CST on Sunday, February 8, 2009 The Dallas News By JIM LANDERS HELSINKI, Finland This is the land where no child is left behind. Finland's schools work toward excellence 02/02/09: By the time Finland's children complete the ninth grade, they speak three languages. They have studied algebra, geometry and statistics since the first grade. And they beat the pants off students from just about everywhere else in the world. In math, science, problem solving and reading comprehension, Finland's 15-year-olds came out at or near the top in international tests given in 2000, 2003 and Even the least among Finnish students the lowest 10 percent beat their peers everywhere else. This matters to Dallas because so many students are still left behind. Even though Dallas reformers played key roles in the federal legislation named for the goal of bringing everyone a quality education, there are still great disparities in academic achievement between city and suburbs, and in DISD itself between quality schools and poor ones. Dallas has improved a lot, but there are still lessons to learn from abroad that have whet the curiosity of reformers such as Dallas lawyer Tom Luce and former Dallas school board president Sandy Kress. Although Finland is a very different place in terms of the racial, ethnic and economic backgrounds of its students, the Finnish experience offers several salient reform ideas. First, it takes a long-term commitment to bring about a goal as sweeping as "no child left behind." The Finns have been trying to find the right formula for 30 years and continue to fine-tune their approach. Second, though Texas teachers chafe at the scripted classrooms seemingly dictated by the federal law, Finnish teachers felt the same until the national board of education decided to trust its teachers and let them do their jobs without so many strictures. Freedom came with a price, however. All of Finland's teachers must have master's degrees. "What is the role and mission of basic education? To give everybody a good start in life," says Reijo Laukkanen, counselor to Finland's National Board of Education. Texans look to Finland
87 Educators from across the world have looked to Finland for ideas on improving public education. Dallas reformers are especially intrigued with how Finland gets positive results from all of its schools and nearly all of its students an equality that has been a chronic problem in Texas since the days of racial segregation. Finland also intrigues with its success in math and science. Compared with Texas, Finland has a much smaller and much more homogenous school population. Finland is absorbing more immigrants, but nowhere near as many as Texas. Finland's battles to improve education offer ideas for success in Texas and ideas for avoiding a decline in living standards for a poorly educated population. These include: Establishing a single, straightforward curriculum for all schools Expecting good results from all students and providing extra teaching resources to get those results Giving well-trained teachers respect and freedom to teach State demographer Steve Murdock, now head of the U.S. Census Bureau, has shown that Texas will see a decline in household income of more than $5,000 a year by 2040 unless the public schools can do a better job of educating minority students. "We have to demand a hell of a lot more from our schools than we did 20 years ago," said Luce, a leader in the fight for No Child Left Behind and other equity causes in Texas and U.S. public schools for more than 20 years. "The schools say, 'You are being unrealistic, woe is me,' and I understand that... "But in Finland, they've really had a national buy-in to high standards of public education. I want to know what they're doing to create that environment," Luce said, citing a report by the Organization for Economic Cooperation and Development on Finland's test results. Education and innovation are considered crucial to Finland's identity as a knowledgebased economy. Science and math are integral to this consensus. Even in the worst economic times, Finland has maintained spending for education in order to enhance its economic future. Teaching honored Kress, another adviser on former President George W. Bush's No Child Left Behind effort, spoke admiringly of Finland's teachers.
88 "The sweet spot is the professionalism of teaching," he said. "Teaching in Finland is a true profession. It's honored. It's highly regarded. And it takes a lot to become a teacher." Teaching carries so much prestige that only one in 10 applicants seeking to major in education are accepted at Finland's universities. Finland's public school teachers are paid less than American teachers, but they have greater classroom autonomy about how to meet the goals of the national curriculum. The Kallahti Comprehensive School (grades 1 through 9) in northeastern Helsinki works through these principles daily. Of 550 students, 20 percent are immigrants from Somalia, Russia, Turkey and Bosnia. The students live in a drab neighborhood of beige and gray garden apartments. Teachers and parents complain that some kids get involved with drugs, fight in school or spend too much time with computer games. "This area is quite low in social and economic status," said Kallahti German teacher Saila Törmälä. "Our main task here is to integrate the students into Finnish society." Common curriculum The Kallahti students study under the same curriculum as every other school in Finland. Even with these challenges, however, just two to five kids a year are held back to repeat a grade. An average of two or less drop out of school, said deputy principal Kimmo Paavola. "In past years, we've been a little behind the national average in national evaluations," Paavola said. "But we are quite close to the average. And our goal is to be above the average the next time." Finland emphasizes creative problem-solving skills. Once students are familiar with the concepts of math, for example, they are expected to solve problems in front of the rest of the class. The goal of math education, in fact, is to equip students with both skills and logic so they can take responsibility for lifetime learning. Kids having problems with the studies get special attention from tutors and remedial educators from the first until the last day of their education. Educators spend the most time and money on students in the seventh through ninth grades, because that's where they see students having the most trouble with keeping academics a priority. The system has critics, many of whom complain that Finland doesn't do enough in the early years for its brightest students. And once they graduate from comprehensive school at the age of 15 or 16, some 14 percent of the boys drop out before completing upper secondary school the 10th through 12th grades. Universities conduct tough entrance examinations, and nearly 70 percent of university students are female.
89 Katariina Nyman, a chemical engineering student at the Helsinki University of Technology, said she felt constrained when she was a comprehensive school student. "In grades 7 through 9, I wasn't as able to be enthusiastic about chemistry and math as I wanted to be, because it wasn't cool," she said. "But this was the only time when we were all together, no matter what your background. It opens up your eyes.... We can't afford to lose some people on the way." Forced to reform Finland's education reformers came to their work by necessity. Education has a special role in Finland's national story. Six-hundred years of Swedish rule ended in 1809 when Finland became a Russian duchy. Nationalist philosopher Johan Snellman campaigned to restore the Finnish language to primacy in literature and higher education, and argued that the success of a small nation would be measured in the degree of its civilization. Finland gained its independence in 1917 under the leadership of teachers more than politicians or soldiers. Yet, by the 1960s, public education was so bad that parents were moving their children en masse to private schools. Laukkanen remembers a forecast that predicted by 1972, only one-fourth of Finland's children would be attending public schools. Funding inequities, vastly different course requirements and low job expectations with Finland's dominant forest industries left many villages with bad schools. "The system was not functioning," said University of Helsinki education professor Jarkko Hautamäki. "People were voting with their feet against the schools." Parties on the left began agitating for a more equitable system. Parties on the right saw their constituents abandoning the countryside for the cities reason enough for joining the reform movement. Finland's equivalent of "No Child Left Behind" passed the Parliament in 1968 at the initiative of the conservatives. The law called for a uniform, national curriculum for both public and private schools. The National Board of Education was tasked with "equalizing possibilities so that, wherever you lived, you got the same quality education," Hautamäki said. Re-evaluation constant The new system was so rigid that Laukkanen now describes it as "Stalinistic." The detailed national curriculum was more than 700 pages long. A national education inspectorate demanded annual implementation plans from all school districts. Some
90 parents complained the new system penalized the brightest students by moving everyone at the same pace. In 1979, education majors were required to get at least a master's degree if they wanted to teach in the public schools. In return, the curriculum was pared back to give teachers more control over how they ran their classrooms. The education inspectorate was abolished. The curriculum was trimmed again in 1994 to just 110 pages. The Board of Education later felt that gave too little direction for educating the brightest students. The latest national curriculum, adopted in 2004, is 319 pages long. Reformers were also convinced that Finland needed to stop putting students into different career tracks so early. By the end of the sixth grade, students and parents had to decide whether to take classes aimed at attending a university or a vocational school. The vocational track offered much easier math and science courses. The tracking system was changed in Students still choose whether to go into university or vocational prep schools, but not until they have completed ninth grade. The reformers are still busy. The latest major overhaul involves higher education, where Finland hopes to elevate its best universities by combining schools of art and design, economics and engineering. Evaluation and change goes on throughout the system. "We're trying to improve everything all the time," said Kallahti deputy principal Paavola. "We are a small country. We have to compete with knowledge and technology."
91 Inside the best school in the world: Shorter days in class, long holidays, respect for teachers: it's the formula for excellence. Alex Duval Smith in Helsinki The Observer, Sunday September Herka, 13, kicks her Adidas trainers into a pile of assorted Nikes and Pumas and walks to her English class in her socks - a morning ritual at Arabia School in Helsinki which gives a clue to why Finland has the best state schools in the world. This land of vodka and Nokia phones has more graduates than any other country and its 15-year-olds are the best at solving maths problems, according to the latest education survey by the Organisation for Economic Co-operation and Development (OECD). Juxu and her classmates have no league tables or Sats, they enjoy short school days, free hot lunches, lots of music, art and sport, and 10-week summer holidays. In a country where 60 per cent of the people are university-educated, the children have the world's best education. The US, Britain and all other European countries are far behind Finland in the survey, along with such educational hothouses as China and Japan. 'We believe school should be an egalitarian place and an extension of home, not a cold, forbidding environment,' said English teacher Riitta Severinkangas, an English teacher at Arabia. 'In every Nordic home, children and adults leave their shoes by the door. So we do the same in our school, to make it homely, though teachers are allowed to wear indoor shoes.' In Juxu's English class, as in many others at this combined primary and secondary school, textbooks are virtually redundant. 'I get them to do a lot of illustrated essays,' said Severinkangas. 'Their homework today is to write about "my favourite pet". It is always better to try to get the pupils to relate to something in their own lives.' A three-headed dog may turn up in the essays. Pupil Victor Sund is a Harry Potter fanatic and is reading the 600 pages of The Half Blood Prince - in English. 'It has not been translated into Finnish yet,' he says, matter of factly. Not to be outdone, classmate Ville Luostarinen shows off his weighty Ultimate Hitchhiker's Guide - also in the original language. These pupils are all 13 and have been studying English for just three years. Since the OECD's first major education study, in 2000, Finland, with a population of five million, has led the world in literacy. 'We were not astounded by that result,' said Jouni Valijarvi, professor of education research at Jyvaskyla University, 'because we have a tradition of reading and using
92 libraries. It dates back to Christianity's arrival in Finland 400 years ago. Priests used to test couples' literacy. Those who could not read from the Bible were denied marriage licences.' The 317 pupils at the school - a building without corridors, designed around a spiral staircase and an open-plan cafeteria - are from a cross-section of Finnish inner-city families, with few from ethnic minorities. Those with special needs belong to ordinary classes but also have three teachers of their own. Nico Kalja, 14, sits in a corner of teacher Jorma Kuittinen's special needs class and says - in English - that it's all 'bullshit' and he would rather be on his PlayStation or listening to Metallica. Yet Kuittinen has interested at least two of the eight children in a history lesson. Inez Kaukoranta, 14, enjoys films and acting; she is taking notes on Charlie Chaplin's Great Dictator. One of the boys prefers military technology and is making a collage of Second World War bombers. Headteacher Kaisu rarely uses her office, preferring to be in the staff room with colleagues. 'We are informal and talk a lot, sharing ideas,' she said. Lately, Karkkainen's time has been taken up showing foreign education experts around. 'They all want to know what our secret is. I say it's our teachers. In Finland, the teaching profession is highly regarded. Education is considered a science and there is such competition that only about 13 per cent of applicants a year are admitted to the teaching faculty. You do five years and qualify with a master's degree. We do not have teacher training colleges.' Arabia school is twinned with a British comprehensive in County Durham, which Karkkinen has visited. 'The methods are the same, the children are the same, but in Finland we are trusted by the authorities to find the best solutions and do our job.' But Valijarvi, the education professor, fears Finland's success will tempt politicians to 'tinker', perhaps introducing UK-style league tables. 'The competitive approach tends to lower the overall level,' he warned. 'Our poor students do extremely well, so the gap between them and the high performers is small compared to that in other countries. But we know you have to work extremely hard with those students. If you stress competition, they will be the losers and the gap will widen.' For now, however, Juxu and her friends can go on leaving their trainers at the school door, knowing that they are knocking the socks off the competition. This article appeared in the Observer on Sunday September on p23 of the News section.

93 CoSN Senior Delegation to Scandinavia Report November 9-17, 2007 Sponsored and organized in collaboration with With additional support from Delegation Members Sheryl Abshire Ann Lee Flynn, Ed.D. James Bosco Trina Davis Kathy Hurley Keith Krueger Katie Lovett Tim Magner Jo-Ann McDevitt Mark Nieker Michael D. Quesnell, Ph.D. Helen Soulé, Ph.D. Irene Spero Barbara Stein Julie A. Walker Goals: * To see how the major strategic investment in ICT by Finland, Sweden and Denmark is impacting the educational process. * To find out how ICT is being used to improve the learning process for students in Finish, Swedish and Danish elementary and secondary education, particularly at a systemic level. * To stimulate a conversation among US and Scandinavian education
Department of Education and Skills. Memorandum
 Department of Education and Skills Memorandum Irish Students Performance in PISA 2012 1. Background 1.1. What is PISA? The Programme for International Student Assessment (PISA) is a project of the Organisation
National Academies STEM Workforce Summit
 National Academies STEM Workforce Summit September 21-22, 2015 Irwin Kirsch Director, Center for Global Assessment PIAAC and Policy Research ETS Policy Research using PIAAC data America s Skills Challenge:
Twenty years of TIMSS in England. NFER Education Briefings. What is TIMSS?
 NFER Education Briefings Twenty years of TIMSS in England What is TIMSS? The Trends in International Mathematics and Science Study (TIMSS) is a worldwide research project run by the IEA 1. It takes place
Overall student visa trends June 2017
 Overall student visa trends June 2017 Acronyms Acronyms FSV First-time student visas The number of visas issued to students for the first time. Visas for dependants and Section 61 applicants are excluded
Introduction Research Teaching Cooperation Faculties. University of Oulu
 University of Oulu Founded in 1958 faculties 1 000 students 2900 employees Total funding EUR 22 million Among the largest universities in Finland with an exceptionally wide scientific base Three universities
PIRLS. International Achievement in the Processes of Reading Comprehension Results from PIRLS 2001 in 35 Countries
 Ina V.S. Mullis Michael O. Martin Eugenio J. Gonzalez PIRLS International Achievement in the Processes of Reading Comprehension Results from PIRLS 2001 in 35 Countries International Study Center International
TIMSS Highlights from the Primary Grades
 TIMSS International Study Center June 1997 BOSTON COLLEGE TIMSS Highlights from the Primary Grades THIRD INTERNATIONAL MATHEMATICS AND SCIENCE STUDY Most Recent Publications International comparative results
EXECUTIVE SUMMARY. TIMSS 1999 International Science Report
 EXECUTIVE SUMMARY TIMSS 1999 International Science Report S S Executive Summary In 1999, the Third International Mathematics and Science Study (timss) was replicated at the eighth grade. Involving 41 countries
Measuring up: Canadian Results of the OECD PISA Study
 Measuring up: Canadian Results of the OECD PISA Study The Performance of Canada s Youth in Science, Reading and Mathematics 2015 First Results for Canadians Aged 15 Measuring up: Canadian Results of the
Impact of Educational Reforms to International Cooperation CASE: Finland
 Impact of Educational Reforms to International Cooperation CASE: Finland February 11, 2016 10 th Seminar on Cooperation between Russian and Finnish Institutions of Higher Education Tiina Vihma-Purovaara
EXECUTIVE SUMMARY. TIMSS 1999 International Mathematics Report
 EXECUTIVE SUMMARY TIMSS 1999 International Mathematics Report S S Executive Summary In 1999, the Third International Mathematics and Science Study (timss) was replicated at the eighth grade. Involving
The Survey of Adult Skills (PIAAC) provides a picture of adults proficiency in three key information-processing skills:
 provides a picture of adults proficiency in three key information-processing skills:") SPAIN Key issues The gap between the skills proficiency of the youngest and oldest adults in Spain is the second largest in the survey. About one in four adults in Spain scores at the lowest levels in
SPAIN Key issues The gap between the skills proficiency of the youngest and oldest adults in Spain is the second largest in the survey. About one in four adults in Spain scores at the lowest levels in
HIGHLIGHTS OF FINDINGS FROM MAJOR INTERNATIONAL STUDY ON PEDAGOGY AND ICT USE IN SCHOOLS
 HIGHLIGHTS OF FINDINGS FROM MAJOR INTERNATIONAL STUDY ON PEDAGOGY AND ICT USE IN SCHOOLS Hans Wagemaker Executive Director, IEA Nancy Law Director, CITE, University of Hong Kong SITES 2006 International
Welcome to. ECML/PKDD 2004 Community meeting
 Welcome to ECML/PKDD 2004 Community meeting A brief report from the program chairs Jean-Francois Boulicaut, INSA-Lyon, France Floriana Esposito, University of Bari, Italy Fosca Giannotti, ISTI-CNR, Pisa,
May To print or download your own copies of this document visit Name Date Eurovision Numeracy Assignment
 1. An estimated one hundred and twenty five million people across the world watch the Eurovision Song Contest every year. Write this number in figures. 2. Complete the table below. 2004 2005 2006 2007
Summary and policy recommendations
 Skills Beyond School Synthesis Report OECD 2014 Summary and policy recommendations The hidden world of professional education and training Post-secondary vocational education and training plays an under-recognised
15-year-olds enrolled full-time in educational institutions;
 CHAPTER 4 SAMPLE DESIGN TARGET POPULATION AND OVERVIEW OF THE SAMPLING DESIGN The desired base PISA target population in each country consisted of 15-year-old students attending educational institutions
PROGRESS TOWARDS THE LISBON OBJECTIVES IN EDUCATION AND TRAINING
 COMMISSION OF THE EUROPEAN COMMUNITIES Commission staff working document PROGRESS TOWARDS THE LISBON OBJECTIVES IN EDUCATION AND TRAINING Indicators and benchmarks 2008 This publication is based on document
The European Higher Education Area in 2012:
 PRESS BRIEFING The European Higher Education Area in 2012: Bologna Process Implementation Report EURYDI CE CONTEXT The Bologna Process Implementation Report is the result of a joint effort by Eurostat,
The Rise of Populism. December 8-10, 2017
 The Rise of Populism December 8-10, 2017 The Rise of Populism LIST OF PARTICIPATING SCHOOL Byron College B Arsakeio Tositseio Lykeio Ekalis A Tositseio Arsakeio Lykeio Ekalis QSI Tbilisi Ionios School
Students with Disabilities, Learning Difficulties and Disadvantages STATISTICS AND INDICATORS
 Students with Disabilities, Learning Difficulties and Disadvantages STATISTICS AND INDICATORS CENTRE FOR EDUCATIONAL RESEARCH AND INNOVATION Students with Disabilities, Learning Difficulties and Disadvantages
DEVELOPMENT AID AT A GLANCE
 DEVELOPMENT AID AT A GLANCE STATISTICS BY REGION 2. AFRICA 217 edition 2.1. ODA TO AFRICA - SUMMARY 2.1.1. Top 1 ODA receipts by recipient USD million, net disbursements in 21 2.1.3. Trends in ODA 1 Ethiopia
SOCRATES PROGRAMME GUIDELINES FOR APPLICANTS
 SOCRATES PROGRAMME GUIDELINES FOR APPLICANTS The present document contains a description of the financial support available under all parts of the Community action programme in the field of education,
Teaching Practices and Social Capital
 D I S C U S S I O N P A P E R S E R I E S IZA DP No. 6052 Teaching Practices and Social Capital Yann Algan Pierre Cahuc Andrei Shleifer October 2011 Forschungsinstitut zur Zukunft der Arbeit Institute
Universities as Laboratories for Societal Multilingualism: Insights from Implementation
 Universities as Laboratories for Societal Multilingualism: Insights from Implementation Dr. Thomas Vogel Europa-Universität Viadrina vogel@europa-uni.de The Agenda 1. Language policy issues 2. The global
Improving education in the Gulf
 Improving education in the Gulf 39 Improving education in the Gulf Educational reform should focus on outcomes, not inputs. Michael Barber, Mona Mourshed, and Fenton Whelan Having largely achieved the
The recognition, evaluation and accreditation of European Postgraduate Programmes.
 1 The recognition, evaluation and accreditation of European Postgraduate Programmes. Sue Lawrence and Nol Reverda Introduction The validation of awards and courses within higher education has traditionally,
Science and Technology Indicators. R&D statistics
 2014 Science and Technology Indicators R&D statistics Science and Technology Indicators R&D statistics 2014 Published by NIFU Nordic Institute for Studies in Innovation, Research and Education Address
Challenges for Higher Education in Europe: Socio-economic and Political Transformations
 Challenges for Higher Education in Europe: Socio-economic and Political Transformations Steinhardt Institute NYU 15 June, 2017 Peter Maassen US governance of higher education EU governance of higher
REFLECTIONS ON THE PERFORMANCE OF THE MEXICAN EDUCATION SYSTEM
 DIRECTORATE FOR EDUCATION REFLECTIONS ON THE PERFORMANCE OF THE MEXICAN EDUCATION SYSTEM DAVID HOPKINS 1, ELPIDA AHTARIDOU, PETER MATTHEWS, CHARLES POSNER AND DIANA TOLEDO FIGUEROA 2 LONDON CENTRE FOR
International House VANCOUVER / WHISTLER WORK EXPERIENCE
 International House VANCOUVER / WHISTLER WORK EXPERIENCE 2 3 work experience At IH Vancouver, we understand that language acquisition is only the first step in achieving your career goals. With this in
CHAPTER 3 CURRENT PERFORMANCE
 CHAPTER 3 current 3-1 3. Current Performance The examination of the performance of the n education system begins with an analysis of how students have fared over time, and in comparison with other countries,
Advances in Aviation Management Education
 Advances in Aviation Management Education by Dr. Dale Doreen, Director International Aviation MBA Program John Molson School of Business Concordia University 15 th Annual Canadian Aviation Safety Seminar
international PROJECTS MOSCOW
 international PROJECTS MOSCOW Lomonosov Moscow State University, Faculty of Journalism INTERNATIONAL EXCHANGES Journalism & Communication Partners IHECS Lomonosov Moscow State University, Faculty of Journalism
EQE Candidate Support Project (CSP) Frequently Asked Questions - National Offices
 Frequently Asked Questions - National Offices") EQE Candidate Support Project (CSP) Frequently Asked Questions - National Offices What is the EQE Candidate Support Project (CSP)? What is the distribution of Professional Representatives within EPC member
EQE Candidate Support Project (CSP) Frequently Asked Questions - National Offices What is the EQE Candidate Support Project (CSP)? What is the distribution of Professional Representatives within EPC member
The International Coach Federation (ICF) Global Consumer Awareness Study
 Global Consumer Awareness Study") www.pwc.com The International Coach Federation (ICF) Global Consumer Awareness Study Summary of the Main Regional Results and Variations Fort Worth, Texas Presentation Structure 2 Research Overview 3 Research
www.pwc.com The International Coach Federation (ICF) Global Consumer Awareness Study Summary of the Main Regional Results and Variations Fort Worth, Texas Presentation Structure 2 Research Overview 3 Research
Information needed to facilitate the clarity, transparency and understanding of mitigation contributions
 Climate Change Expert Group Paper No.2017(1) Information needed to facilitate the clarity, transparency and understanding of mitigation contributions Sara Moarif (IEA) May 2017 Unclassified COM/ENV/EPOC/IEA/SLT(2017)1
IAB INTERNATIONAL AUTHORISATION BOARD Doc. IAB-WGA
 GROUP A EDUCATION, TRAINING AND QUALIFICATION MINUTES OF THE MEETING HELD ON 28 AUGUST 2006 IN QUÉBEC CANADA 1. Welcome and Apologies Christian AHRENS opened the meeting welcoming everyone. Apologies had
The development of national qualifications frameworks in Europe
 European Centre for the Development of Vocational Training WORKING PAPER No 8 The development of national qualifications frameworks in Europe Luxembourg: Publications Office of the European Union, 2010
OECD THEMATIC REVIEW OF TERTIARY EDUCATION GUIDELINES FOR COUNTRY PARTICIPATION IN THE REVIEW
 OECD THEMATIC REVIEW OF TERTIARY EDUCATION GUIDELINES FOR COUNTRY PARTICIPATION IN THE REVIEW JUNE 2004 CONTENTS I BACKGROUND... 1 1. The thematic review... 1 1.1 The objectives of the OECD thematic review
DISCUSSION PAPER. In 2006 the population of Iceland was 308 thousand people and 62% live in the capital area.
 Increasing Employment of Older Workers through Lifelong Learning Discussion Paper Jón Torfi Jónasson Institute of Social Science Research, University of Iceland Introduction This Peer Review is concerned
Introduction. Background. Social Work in Europe. Volume 5 Number 3
 12 The Development of the MACESS Post-graduate Programme for the Social Professions in Europe: The Hogeschool Maastricht/ University of North London Experience Sue Lawrence and Nol Reverda The authors
GHSA Global Activities Update. Presentation by Indonesia
 GHSA Global Activities Update Presentation by Indonesia as the GHSA chair in 2016 2016 Global Activities JEE Process Action Packages Coordination Jakarta Call for Action A Systemic Network Model : Coordination
key findings Highlights of Results from TIMSS THIRD INTERNATIONAL MATHEMATICS AND SCIENCE STUDY November 1996
 TIMSS International Study Center BOSTON COLLEGE Highlights of Results from TIMSS THIRD INTERNATIONAL MATHEMATICS AND SCIENCE STUDY Now Available International comparative results in mathematics and science
RELATIONS. I. Facts and Trends INTERNATIONAL. II. Profile of Graduates. Placement Report. IV. Recruiting Companies
 I. Facts and Trends II. Profile of Graduates III. International Placement Statistics IV. Recruiting Companies mir.ie.edu After the graduation of our 4th intake of the Master in International Relations
SECTION 2 APPENDICES 2A, 2B & 2C. Bachelor of Dental Surgery
 Cardiff University College of Biomedical and Life Sciences School of Dentistry Entry 2017 SECTION 2 APPENDICES 2A, 2B & 2C Bachelor of Dental Surgery Admissions Policy for Undergraduate Courses Entry 2017
Supplementary Report to the HEFCE Higher Education Workforce Framework
 Supplementary Report to the HEFCE Higher Education Workforce Framework based on the international Changing Academic Profession (CAP) Study William Locke and Alice Bennion Centre for Higher Education Research
Academic profession in Europe
 Current changes in Finnish academic profession Timo Aarrevaara Professor, HEGOM University of Helsinki Academic profession in Europe The academic profession is a critical part of the future of knowledge-based
Coimisiún na Scrúduithe Stáit State Examinations Commission LEAVING CERTIFICATE 2008 MARKING SCHEME GEOGRAPHY HIGHER LEVEL
 Coimisiún na Scrúduithe Stáit State Examinations Commission LEAVING CERTIFICATE 2008 MARKING SCHEME GEOGRAPHY HIGHER LEVEL LEAVING CERTIFICATE 2008 MARKING SCHEME GEOGRAPHY HIGHER LEVEL PART ONE: SHORT-ANSWER
How to Search for BSU Study Abroad Programs
 How to Search for BSU Study Abroad Programs Ways to Research Your BSU Options: Visit our website at http://studyabroad.bsu.edu Browse the print brochures outside of our office Speak to students who have
The development of ECVET in Europe
 European Centre for the Development of Vocational Training WORKING PAPER No 14 The development of ECVET in Europe (2011) Luxembourg: Publications Office of the European Union, 2012 The development of
Inspiring Science Education European Union Project
 Inspiring Science Education European Union Project Dr. Mihaela Garabet 1,2, Ana Maria Bâldea 1, Prof. Radu Jugureanu 1 (1) SIVECO ROMANIA (2) National College Grigore Moisil, Bucharest, Romania Victoria
CONSULTATION ON THE ENGLISH LANGUAGE COMPETENCY STANDARD FOR LICENSED IMMIGRATION ADVISERS
 CONSULTATION ON THE ENGLISH LANGUAGE COMPETENCY STANDARD FOR LICENSED IMMIGRATION ADVISERS Introduction Background 1. The Immigration Advisers Licensing Act 2007 (the Act) requires anyone giving advice
National Pre Analysis Report. Republic of MACEDONIA. Goce Delcev University Stip
 National Pre Analysis Report Republic of MACEDONIA Goce Delcev University Stip The European Commission support for the production of this publication does not constitute an endorsement of the contents
Eye Level Education. Program Orientation
 Eye Level Education Program Orientation Copyright 2010 Daekyo America, Inc. All Rights Reserved. Eye Level is the key to self-directed learning. We nurture: problem solvers critical thinkers life-long
JAMK UNIVERSITY OF APPLIED SCIENCES
 WELCOME ON EXCHANGE TO JAMK UNIVERSITY OF APPLIED SCIENCES SCHOOL OF TECHNOLOGY WWW.JAMK.FI 1 JYVÄSKYLÄ WHERE? Central Finland in the lake district of Finland 270 kilometres north of Helsinki (capital
The Achievement Gap in California: Context, Status, and Approaches for Improvement
 The Achievement Gap in California: Context, Status, and Approaches for Improvement Eva L. Baker, EdD - University of California, Los Angeles, Center for Research on Evaluation, Standards, and Student Testing
CALL FOR PARTICIPANTS
 CALL FOR PARTICIPANTS TRAINING OF TRAINERS FOR EUROPEAN ERASMUS+: YOUTH IN ACTION PROJECTS 2017/18 CALL FOR PARTICIPANTS YOU HAVE...already gained experience as a trainer within the field of Non-Formal
Financiación de las instituciones europeas de educación superior. Funding of European higher education institutions. Resumen
 Financiación de las instituciones europeas de educación superior Funding of European higher education institutions 1 Thomas Estermann Head of Unit Governance, Autonomy and Funding European University Association
DG 17: The changing nature and roles of mathematics textbooks: Form, use, access
 DG 17: The changing nature and roles of mathematics textbooks: Form, use, access Team Chairs: Berinderjeet Kaur, Nanyang Technological University, Singapore berinderjeet.kaur@nie.edu.sg Kristina-Reiss,
Business Students. AACSB Accredited Business Programs
 AACSB Accredited Business Programs Business Students Study Abroad Office: 32 Sayre Drive, Coxe Hall, 1 st Floor Phone: 610-758-4877 Fax: 610-758-5156 Website: www.lehigh.edu/studyabroad Email: incis@lehigh.edu
A European inventory on validation of non-formal and informal learning
 A European inventory on validation of non-formal and informal learning Finland By Anne-Mari Nevala (ECOTEC Research and Consulting) ECOTEC Research & Consulting Limited Priestley House 12-26 Albert Street
HAAGA-HELIA University of Applied Sciences. Education, Research, Business Development
 HAAGA-HELIA University of Applied Sciences Education, Research, Business Development Finnish Education System 24 Universities of Applied Sciences 15 Universities Professional Master Degrees 1 1,5 5 4 3
Berkeley International Office Survey
 Berkeley International Office Survey 1. What is your gender? Male 64.8% 308 Female 35.2% 167 2. What is your age? 17-20 0.0% 0 21-24 17.9% 85 25-30 56.6% 269 31-35 19.2% 91 36+ 6.3% 30 1 of 40 3. What
Educational system gaps in Romania. Roberta Mihaela Stanef *, Alina Magdalena Manole
 Available online at www.sciencedirect.com ScienceDirect Procedia - Social and Behavioral Scien ce s 93 ( 2013 ) 794 798 3rd World Conference on Learning, Teaching and Educational Leadership (WCLTA-2012)
Rethinking Library and Information Studies in Spain: Crossing the boundaries
 Rethinking Library and Information Studies in Spain: Crossing the boundaries V IRGINIA O RTIZ- R EPISO U NIVERSIDAD C ARLOS III DE M ADRID D EPARTAMENTO DE B IBLIOTECONOMIA Y D OCUMENTACIÓN Barcelona,
Higher education is becoming a major driver of economic competitiveness
 Executive Summary Higher education is becoming a major driver of economic competitiveness in an increasingly knowledge-driven global economy. The imperative for countries to improve employment skills calls
Lesson 1 Taking chances with the Sun
 P2 Radiation and life Lesson 1 Taking chances with the Sun consider health benefits as well as risks that sunlight presents introduce two ideas: balancing risks and benefits, reducing risks revisit the
UNIVERSITY AUTONOMY IN EUROPE II
 UNIVERSITY AUTONOMY IN EUROPE II THE SCORECARD By Thomas Estermann, Terhi Nokkala & Monika Steinel Copyright 2011 European University Association All rights reserved. This information may be freely used
GREAT Britain: Film Brief
 GREAT Britain: Film Brief Prepared by Rachel Newton, British Council, 26th April 2012. Overview and aims As part of the UK government s GREAT campaign, Education UK has received funding to promote the
A TRAINING COURSE FUNDED UNDER THE TCP BUDGET OF THE YOUTH IN ACTION PROGRAMME FROM 2009 TO 2013 THE POWER OF 6 TESTIMONIES OF STRONG OUTCOMES
 A TRAINING COURSE FUNDED UNDER THE TCP BUDGET OF THE YOUTH IN ACTION PROGRAMME FROM 2009 TO 2013 THE POWER OF 6 TESTIMONIES OF STRONG OUTCOMES 1 TRAINING COURSE: THE POWER OF NON FORMAL EDUCATION In 2009,
ehealth Governance Initiative: Joint Action JA-EHGov & Thematic Network SEHGovIA DELIVERABLE Version: 2.4 Date:
 ehealth Governance Initiative: Joint Action JA-EHGov & Thematic Network SEHGovIA DELIVERABLE JA D4.1.1 Strategy & Policy Alignment Documents I WP4 (JA) - Policy Development and Strategy Alignment Version:
SOCIO-ECONOMIC FACTORS FOR READING PERFORMANCE IN PIRLS: INCOME INEQUALITY AND SEGREGATION BY ACHIEVEMENTS
 Tamara I. Petrova, Daniel A. Alexandrov SOCIO-ECONOMIC FACTORS FOR READING PERFORMANCE IN PIRLS: INCOME INEQUALITY AND SEGREGATION BY ACHIEVEMENTS BASIC RESEARCH PROGRAM WORKING PAPERS SERIES: EDUCATION
AUTHORITATIVE SOURCES ADULT AND COMMUNITY LEARNING LEARNING PROGRAMMES
 AUTHORITATIVE SOURCES ADULT AND COMMUNITY LEARNING LEARNING PROGRAMMES AUGUST 2001 Contents Sources 2 The White Paper Learning to Succeed 3 The Learning and Skills Council Prospectus 5 Post-16 Funding
Alignment of Australian Curriculum Year Levels to the Scope and Sequence of Math-U-See Program
 Alignment of s to the Scope and Sequence of Math-U-See Program This table provides guidance to educators when aligning levels/resources to the Australian Curriculum (AC). The Math-U-See levels do not address
Australia s tertiary education sector
 Australia s tertiary education sector TOM KARMEL NHI NGUYEN NATIONAL CENTRE FOR VOCATIONAL EDUCATION RESEARCH Paper presented to the Centre for the Economics of Education and Training 7 th National Conference
Target 2: Connect universities, colleges, secondary schools and primary schools
 Target 2: Connect universities, colleges, secondary schools and primary schools with ICTs Target 2: Connect universities, colleges, secondary schools and primary schools with ICTs 1 Introduction Governments
Developing Effective Teachers of Mathematics: Factors Contributing to Development in Mathematics Education for Primary School Teachers
 Developing Effective Teachers of Mathematics: Factors Contributing to Development in Mathematics Education for Primary School Teachers Jean Carroll Victoria University jean.carroll@vu.edu.au In response
DOES OUR EDUCATIONAL SYSTEM ENHANCE CREATIVITY AND INNOVATION AMONG GIFTED STUDENTS?
 DOES OUR EDUCATIONAL SYSTEM ENHANCE CREATIVITY AND INNOVATION AMONG GIFTED STUDENTS? M. Aichouni 1*, R. Al-Hamali, A. Al-Ghamdi, A. Al-Ghonamy, E. Al-Badawi, M. Touahmia, and N. Ait-Messaoudene 1 University
PUBLIC CASE REPORT Use of the GeoGebra software at upper secondary school
 PUBLIC CASE REPORT Use of the GeoGebra software at upper secondary school Linked to the pedagogical activity: Use of the GeoGebra software at upper secondary school Written by: Philippe Leclère, Cyrille
UPPER SECONDARY CURRICULUM OPTIONS AND LABOR MARKET PERFORMANCE: EVIDENCE FROM A GRADUATES SURVEY IN GREECE
 UPPER SECONDARY CURRICULUM OPTIONS AND LABOR MARKET PERFORMANCE: EVIDENCE FROM A GRADUATES SURVEY IN GREECE Stamatis Paleocrassas, Panagiotis Rousseas, Vassilia Vretakou Pedagogical Institute, Athens Abstract
Inquiry Learning Methodologies and the Disposition to Energy Systems Problem Solving
 Inquiry Learning Methodologies and the Disposition to Energy Systems Problem Solving Minha R. Ha York University minhareo@yorku.ca Shinya Nagasaki McMaster University nagasas@mcmaster.ca Justin Riddoch
OCW Global Conference 2009 MONTERREY, MEXICO BY GARY W. MATKIN DEAN, CONTINUING EDUCATION LARRY COOPERMAN DIRECTOR, UC IRVINE OCW
 OCW Global Conference 2009 MONTERREY, MEXICO BY GARY W. MATKIN DEAN, CONTINUING EDUCATION LARRY COOPERMAN DIRECTOR, UC IRVINE OCW 200 institutional members in the OCWC Over 8,200 courses posted Over 130
Level: 5 TH PRIMARY SCHOOL
 Level: 5 TH PRIMARY SCHOOL GENERAL AIMS: To understand oral and written texts which include numbers. How to use ordinal and cardinal numbers in everyday/ordinary situations. To write texts for various
STAGE-STE PROJECT Presentation of University of Seville (Partner 44)
") STAGE-STE PROJECT Presentation of University of Seville (Partner 44) Scientific and Technological Alliance for Guaranteeing the European Excellence in Concentrating Solar Thermal Energy FP7 Grant Agreement
STAGE-STE PROJECT Presentation of University of Seville (Partner 44) Scientific and Technological Alliance for Guaranteeing the European Excellence in Concentrating Solar Thermal Energy FP7 Grant Agreement
INTRODUCTION TO TEACHING GUIDE
 GCSE REFORM INTRODUCTION TO TEACHING GUIDE February 2015 GCSE (9 1) History B: The Schools History Project Oxford Cambridge and RSA GCSE (9 1) HISTORY B Background GCSE History is being redeveloped for
SEDRIN School Education for Roma Integration LLP GR-COMENIUS-CMP
 SEDRIN School Education for Roma Integration 527611-LLP-1-2012-1-GR-COMENIUS-CMP www.sedrin.eu Empowering marginalised groups through education and training in the Danube Region Workshop 4 Awareness Raising
The development of ECVET in Europe
 European Centre for the Development of Vocational Training WORKING PAPER No 10 The development of ECVET in Europe Luxembourg: Publications Office of the European Union, 2010 The development of ECVET in
Programme Specification. MSc in International Real Estate
 Programme Specification MSc in International Real Estate IRE GUIDE OCTOBER 2014 ROYAL AGRICULTURAL UNIVERSITY, CIRENCESTER PROGRAMME SPECIFICATION MSc International Real Estate NB The information contained
03/07/15. Research-based welfare education. A policy brief
 03/07/15 Research-based welfare education in the Nordics A policy brief For information on obtaining additional copies, permission to reprint or translate this work, and all other correspondence, please
HARVARD GLOBAL UPDATE. October 1-2, 2014
 HARVARD GLOBAL UPDATE October 1-2, 2014 All photos are part of the Office of International Education s annual photography contest and were taken by Harvard undergraduates engaged in study, work, internship,
What effect does science club have on pupil attitudes, engagement and attainment? Dr S.J. Nolan, The Perse School, June 2014
 What effect does science club have on pupil attitudes, engagement and attainment? Introduction Dr S.J. Nolan, The Perse School, June 2014 One of the responsibilities of working in an academically selective
MODERNISATION OF HIGHER EDUCATION PROGRAMMES IN THE FRAMEWORK OF BOLOGNA: ECTS AND THE TUNING APPROACH
 EUROPEAN CREDIT TRANSFER AND ACCUMULATION SYSTEM (ECTS): Priorities and challenges for Lithuanian Higher Education Vilnius 27 April 2011 MODERNISATION OF HIGHER EDUCATION PROGRAMMES IN THE FRAMEWORK OF
The Economic Impact of International Students in Wales
 November 2017 The Economic Impact of International Students in Wales Ursula Kelly & Iain McNicoll Viewforth Consulting Ltd Universities Wales Prifysgolion Cymru EXECUTIVE SUMMARY THE ECONOMIC IMPACT OF
Building Bridges Globally
 Building Bridges Globally New Faculty Brown Bag April 2015 Global Affairs Organization Mission: The office of Global Affairs advances UC Davis internationalization strategy to enhance its global impact
Modern Trends in Higher Education Funding. Tilea Doina Maria a, Vasile Bleotu b
 Available online at www.sciencedirect.com ScienceDirect Procedia - Social and Behavioral Scien ce s 116 ( 2014 ) 2226 2230 Abstract 5 th World Conference on Educational Sciences - WCES 2013 Modern Trends
Tailoring i EW-MFA (Economy-Wide Material Flow Accounting/Analysis) information and indicators
 information and indicators") Tailoring i EW-MFA (Economy-Wide Material Flow Accounting/Analysis) information and indicators to developing Asia: increasing research capacity and stimulating policy demand for resource productivity Chika
Tailoring i EW-MFA (Economy-Wide Material Flow Accounting/Analysis) information and indicators to developing Asia: increasing research capacity and stimulating policy demand for resource productivity Chika
Financing of Higher Education in Latin America Lessons from Chile, Brazil, and Mexico
 Inter-American Development Bank Financing of Higher Education in Latin America Lessons from Chile, Brazil, and Mexico Paulina Gonzalez-Pose Sabine Rieble Aubourg Tertiary Education Financing Regional Workshop
Paper Reference. Edexcel GCSE Mathematics (Linear) 1380 Paper 1 (Non-Calculator) Foundation Tier. Monday 6 June 2011 Afternoon Time: 1 hour 30 minutes
 1380 Paper 1 (Non-Calculator) Foundation Tier. Monday 6 June 2011 Afternoon Time: 1 hour 30 minutes") Centre No. Candidate No. Paper Reference 1 3 8 0 1 F Paper Reference(s) 1380/1F Edexcel GCSE Mathematics (Linear) 1380 Paper 1 (Non-Calculator) Foundation Tier Monday 6 June 2011 Afternoon Time: 1 hour
Centre No. Candidate No. Paper Reference 1 3 8 0 1 F Paper Reference(s) 1380/1F Edexcel GCSE Mathematics (Linear) 1380 Paper 1 (Non-Calculator) Foundation Tier Monday 6 June 2011 Afternoon Time: 1 hour
Understanding Co operatives Through Research
 Understanding Co operatives Through Research Dr. Lou Hammond Ketilson Chair, Committee on Co operative Research International Co operative Alliance Presented to the United Nations Expert Group Meeting