2016 Connecticut Higher Education System Data and Trends Report
|
|
|
- Alfred Carson
- 6 years ago
- Views:
Transcription
1 Office of Higher Education 2016 Connecticut Higher Education System Data and Trends Report Enrollment Admissions Graduation Rates Tuition & Fees Endowment State Funding Instructional Expenses Faculty and Staffing Student Financial Aid 450 Columbus Blvd., Hartford, CT
2
3 Table of Contents 2016 Connecticut Higher Education Trends Enrollment 1-7 Admissions 8-9 Graduation Rates Tuition and Fees Endowment State Funding Instructional Expenses Faculty and Staffing Student Financial Aid Appendix I - X This report, produced by the Division of Finance and Administration of the Office of Higher Education, is an annual publication required by Public Act For questions, please contact Keith Norton or Scott Ciecko, Division of Finance and Administration, (860)
4
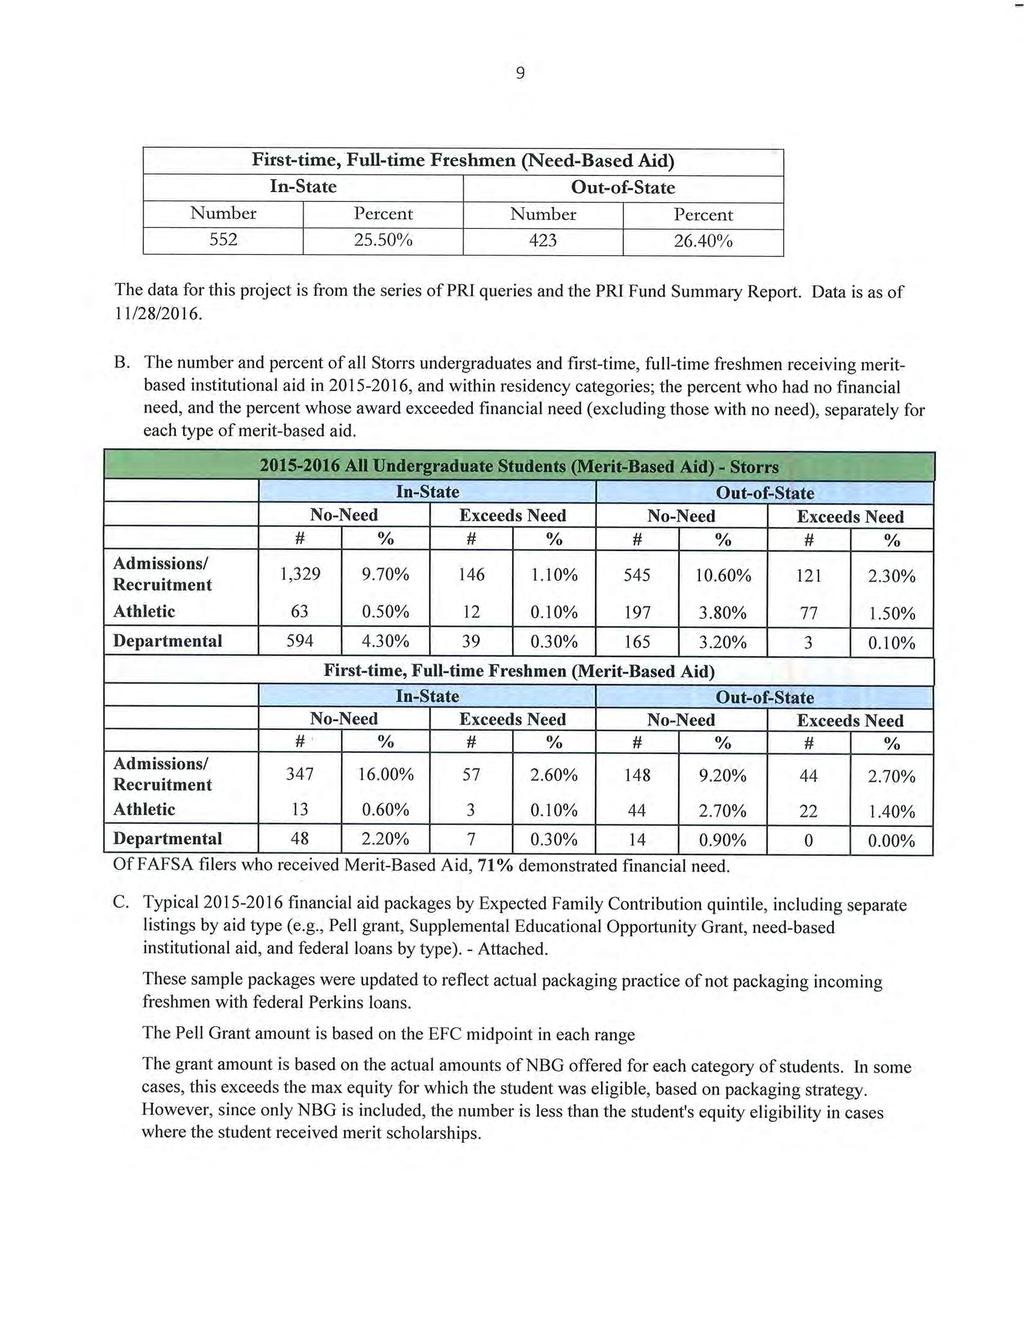
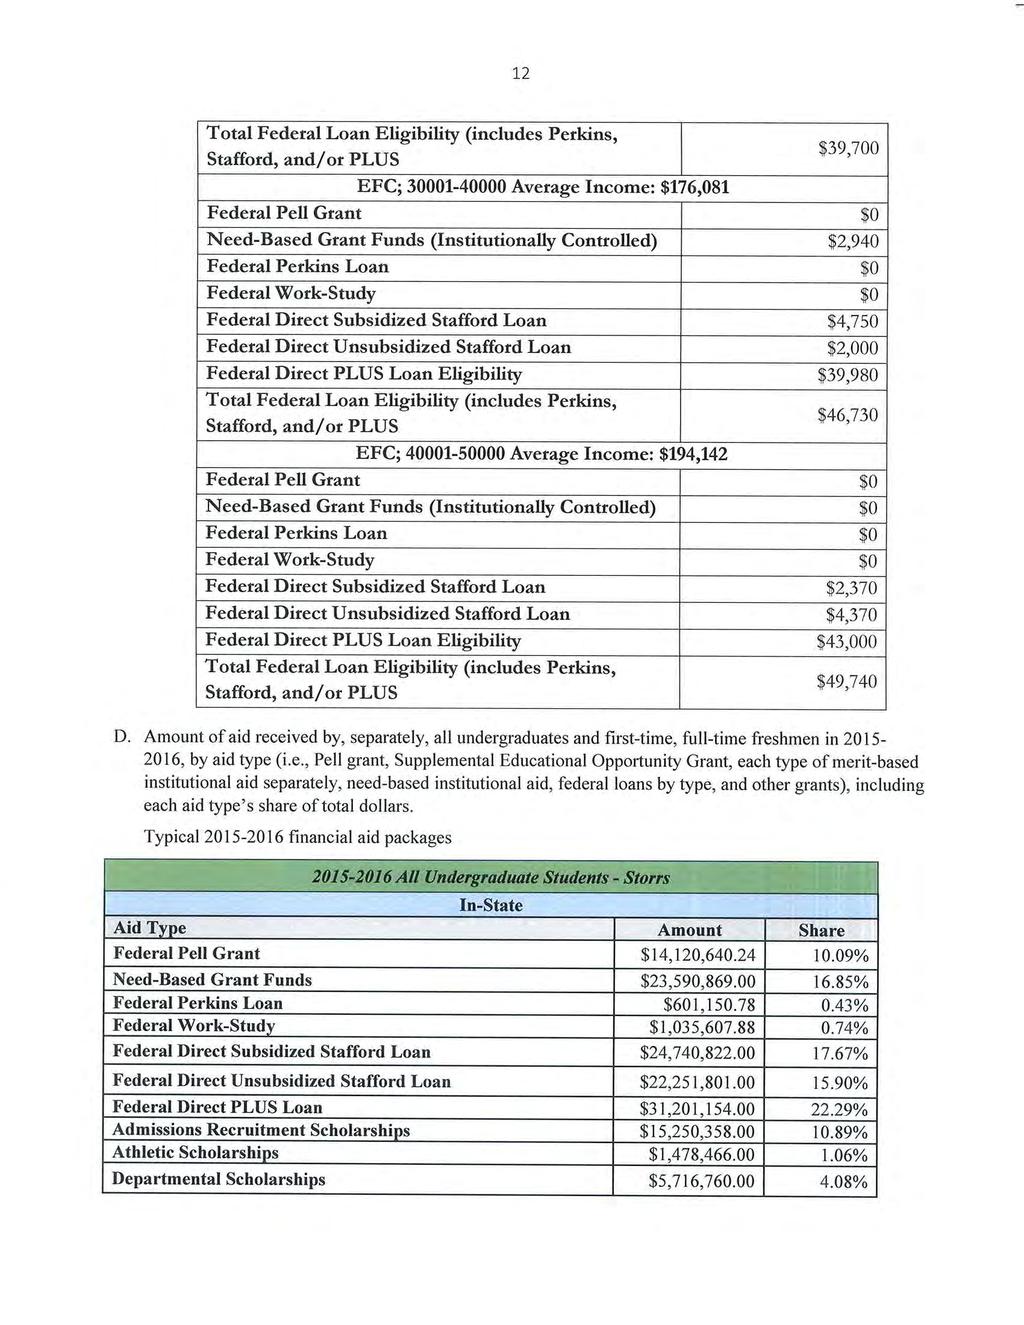
5 Higher Education Statistics Enrollment Connecticut Higher Education Fall FTE Enrollment , , , , ,000 80,000 60,000 40,000 20, % 42% 58% 54% Total Public Total Independent 90,000 85,000 80,000 75,000 Public FTE Enrollment 80,000 60,000 40,000 20,000 Independent FTE Enrollment 70, Public FTE Enrollment Independent FTE Enrollment Although still under 50% of total FTE Enrollment as a percent of total students enrolled, enrollment at independent institutions continues to increase as a percent of total students enrolled at Connecticut institutions. Since 2007, the percent share of Independent FTE Enrollment has grown by 3.7%. Public Institution - An educational institution whose programs and activities are operated by publicly elected or appointed school officials and which is supported primarily by public funds. Independent Institution - An educational institution controlled by a private individual(s) or by a nongovernmental agency, usually supported primarily by other than public funds, and operated by other than publicly elected or appointed officials. These institutions may be either for-profit or not-for-profit. Source: IPEDS Fall Enrollment Surveys 1
6 Higher Education Statistics Enrollment 35,000 30,000 25,000 20,000 15,000 10,000 5,000 - Public Fall FTE Enrollment University of Connecticut 28,190 30,564 27,864 24, Headcount FTE 40,000 35,000 30,000 25,000 20,000 15,000 10,000 5,000 0 State Universities 35,384 33,187 27,820 27, Headcount 70,000 60,000 50,000 40,000 30,000 20,000 10,000 0 Community Colleges 48,434 50,548 27,507 31, Headcount FTE Source: IPEDS Fall Enrollment Surveys 2
7 Higher Education Statistics Enrollment Residence Status of Connecticut Public and Independent Undergraduate Students 140, , ,000 80,000 60,000 40,000 20, , ,110 31,240 38, In-State Out-of-State Residence Status In-State 109, , , , , , , , , ,110 Out-of-State 31,240 32,099 32,607 33,590 36,113 37,136 37,256 37,683 38,127 38,359 In-State/Out-of-State % 78/22 78/22 78/22 79/21 78/22 77/23 77/23 76/24 76/24 75/25 Slight increase in the percentage of out-of-state students attending all Connecticut institutions since The Connecticut State Universities and Community Colleges have maintained in-state enrollment by serving 94.7% and 98.6% in-state undergraduates respectively. Source: IPEDS Fall Enrollment Surveys 3
8 Higher Education Statistics Enrollment Minority Enrollment Connecticut Public and Independent Institutions Fall ,000 60,000 50,000 40,000 30,000 20,000 10, Black Hispanic Asian Native American Minority Headcount Enrollment % % 2005 Census 2015 Census Black 17, % 23, % 8.8% 9.6% Hispanic 14, % 27, % 10.9% 14.7% Asian 7, % 9, % 3.2% 4.2% Native American % % 0.2% 0.1% Total Minority 40, % 67, % 24.3% 30.5% Total Enrollment 180, ,061 Unknown Race 15, % 10, % Data as reported shows that the minority population in Connecticut institutions of higher education has increased from 22.5% to 33.8% in the last ten years. This increase is greater than that of the general population when comparing 2005 and 2015 census estimates. Census data shows that the minority population in Connecticut has increased from 24.3% to 30.5% from 2005 to Source: IPEDS Fall Enrollment Surveys. U.S. Census Bureau (American FactFinder) estimates based on 2005 and 2015 Census estimates and interim updates. 4
9 Higher Education Statistics Enrollment Student Age Summary Connecticut Public and Independent Institutions Fall ,000 90,000 80,000 70,000 60,000 50,000 40,000 30,000 20,000 10,000-92,277 96,703 26,714 29,127 18,264 25,061 7,202 9, FT <25 FT 25< PT <25 PT 25< Student Age Summary - Undergraduate Under 25 Full-Time 92,277 95,933 97,798 99,622 98,588 97,578 97,776 98,224 97,247 96,703 Over 25 Full-Time 7,202 7,511 8,620 9,897 10,724 10,987 10,911 10,685 10,247 9,835 Under 25 Part-Time 18,264 19,142 20,686 22,798 24,776 26,183 26,258 26,094 25,650 25,061 Over 25 Part-Time 26,714 26,857 28,086 32,043 32,768 33,066 32,175 31,776 29,976 29,127 As a percentage of total student population, the over 25 full-time segment has seen the greatest growth, while the under 25 full-time segment has seen the least growth. In the last ten years, the number of students under 25 has increased by 7.9%, while the number of over 25 has increased by 22.2%. The number of full-time students across all ages has increased 9.6%, while the number of part-time students across all ages has increased 15%. Part-time - Undergraduate: A student enrolled for less than 12 semester credits each term. Graduate: A student enrolled for less than 9 semester credits each term. Full-time - Undergraduate: A student enrolled for more than 12 semester credits each term. Graduate: A student enrolled for more than 9 semester credits each term. Source: IPEDS Fall Enrollment Surveys 5
10 Higher Education Statistics Enrollment Enrollment by Gender Connecticut Public and Independent Institutions Fall , ,000 80, ,031 75, ,441 85,620 60,000 40,000 20, Total Male Total Female Enrollment by Gender Men Women Percent Men Percent Women , , % 57.6% , , % 57.4% , , % 57.3% , , % 57.4% , , % 57.5% , , % 57.6% , , % 57.2% , , % 57.1% , , % 56.8% , , % 57.0% The percentage breakdown by gender of students enrolled at Connecticut higher education institutions shows a slight increase in male enrollment over the last 10 years. Source: IPEDS Fall Enrollment Surveys 6
11 Higher Education Statistics Enrollment Undergraduate Transfers In Connecticut Public and Independent Institutions Fall ,000 16,000 14,785 14,000 12,000 10,000 8,000 6,000 4,000 2,000 12,340 10,331 2,009 9,223 5, Total Publics Independents Total 12,340 13,426 14,527 13,672 15,591 16,032 16,721 15,429 15,337 14,785 Public 10,331 11,131 11,887 10,891 13,187 12,178 12,775 11,326 10,971 9,223 Independent 2,009 2,295 2,640 2,781 2,404 3,854 3,946 4,103 4,366 5,562 Public/ Independent % Undergraduate Transfers In 84/16 83/17 82/18 80/20 85/15 76/24 76/24 73/27 72/28 62/38 Over the 10 year period, students transferring in as undergraduates do so mainly at the public institutions. However, the gap between public and independent has narrowed in recent years. Time will well if the big change in is a one year anomaly or a trend. Transfers-in overall, have grown 19.8% in the last 10 years. The independent undergrad transfer population has grown by 176.9% while the public undergrad transfer population has declined by 10.7%. Source: IPEDS Fall Enrollment Surveys 7
12 Higher Education Statistics Admissions 80% 60% 57% Public College Admission Rate 61% 40% 52% 53% 20% 0% UCONN CSU 100% 80% 60% 40% Independent College Admission Rate 64% 61% 81% 68% 20% 21% 17% 0% Nat. Ind. Non-Profits Reg. Ind. Non-Profits Reg. Ind. For-Profits UConn 51.5% 49.7% 54.7% 49.7% 54.3% 47.7% 45.0% 53.2% 50.3% 53.4% CSU 57.3% 49.8% 60.7% 62.1% 64.7% 66.6% 66.7% 67.4% 58.3% 61.1% Natn l Ind. Non-Profit 21.1% 19.6% 21.1% 19.3% 17.4% 16.4% 17.8% 16.1% 16.4% 16.7% Regn l Ind. Non-Profit 60.7% 55.3% 57.5% 62.5% 67.1% 64.6% 61.2% 68.4% 68.4% 68.2% Regn l Ind. For-Profit 64.1% 42.8% 50.5% 57.2% 55.9% 77.4% 58.3% 83.0% 87.1% 81.1% Information on admission rates at Community Colleges are not quantifiable due to open enrollment policies. Data for regional for-profit independent institutions consists of one school. Slight Decrease in admission rates in public institutions over last year. National independent institutions remained flat while regional independent institutions grew by 7.5% since CSU - Connecticut State Universities. Source: IPEDS Data Center 8
13 Higher Education Statistics Admissions Applicants Admited Admittance Rate Applicants Admitted Admittance Rate UConn 20,996 10, % 36,000 19, % Central 5,346 3, % 8,686 5, % Eastern 3,476 2, % 5,370 3, % Southern 5,525 2, % 8,113 5, % Western 3,831 2, % 5,235 2, % CSU Sub-total 18,178 10, % 27,404 16, % National Non-Profit Independents Connecticut College 4,183 1, % 5,182 2, % Trinity College 5,343 2, % 7,569 2, % Wesleyan University 6,879 1, % 9,822 2, % Yale University 19,451 1, % 30,236 2, % National Sub-total 35,856 7, % 52,809 8, % Regional Non-Profit Independents Albertus Magnus College % N/R N/R - Fairfield University 8,035 4, % 10,767 6, % Mitchell College N/R N/R % Quinnipiac University 10,313 5, % 22,745 16, % Sacred Heart University 5,856 3, % 9,259 5, % St. Vincent s College % % University of Bridgeport 4,014 2, % 6,703 3, % University of Hartford 12,646 7, % 15,093 9, % University of New Haven 3,115 2, % 10,748 8, % University of Saint Joseph 1, % % Regional Sub-total 46,695 28, % 76,944 52, % Regional For-Profit Independents Lincoln College of New England N/R N/R - N/R N/R - Post University 1, % 2,401 1, % Source: IPEDS Data Center Not included are the Community Colleges who have open enrollment. N/R - Not Reported 9
14 Higher Education Statistics Graduation Rates within 150% of Normal Time - Public Institutions 80.0% 60.0% 68.2% Public Graduation Rates 76.1% 53.9% 40.0% 39.2% 20.0% 11.3% 14.6% 0.0% UCONN CSU CCC UConn 68.2% 69.2% 70.6% 72.3% 73.4% 75.3% 74.1% 75.1% 73.6% 76.1% CSU 39.2% 41.6% 42.6% 45.8% 46.2% 45.2% 47.6% 49.5% 51.4% 53.9% CCC 11.3% 10.3% 10.3% 10.4% 10.5% 11.3% 12.6% 12.1% 12.5% 14.6% Per federal financial aid guidelines, 150% of normal time is equivalent to 6 years for a 4 year degree and 3 years for a 2 year degree. Data from public institutions reflect a steady increase in the number of students who graduate within 150% of normal time. The Connecticut State University System has seen greater gains and has achieved a higher graduation rate (at 150% of normal time) than many independent non-profit institutions over the last ten years. CCC - Connecticut Community Colleges. Source: IPEDS Data Center Awards and Degrees are conferred between July 1 and June 30 of a given year. 10
15 Higher Education Statistics Graduation Rates within 150% of Normal Time - Independent Institutions 100.0% 80.0% 60.0% 40.0% Independent Graduation Rates 96.2% 96.8% 61.4% 62.1% 36.5% 29.8% 20.0% 0.0% Nat. Ind. Non-Profits Reg. Ind. Non-Profits Reg. Ind. For-Profits Natn l Ind. Non-Profit 96.2% 96.0% 97.4% 97.9% 96.3% 96.6% 96.2% 97.8% 96.2% 96.8% Regn l Ind. Non-Profit 61.4% 60.6% 61.1% 62.5% 66.4% 63.3% 61.8% 63.8% 59.9% 62.1% Regn l Ind. For-Profit 36.5% 40.9% 28.5% 33.3% 35.1% 34.6% 26.4% 30.7% 25.4% 29.8% Per federal financial aid guidelines, 150% of normal time is equivalent to 6 years for a 4 year degree and 3 years for a 2 year degree. National Independent non-profit and Regional Independent non-profit institutions have maintained steady graduation rates over the last 10 years. Regional Independent for-profit institutions have declined by nearly 7% over the last 10 years. Source: IPEDS Data Center Awards and Degrees are conferred between July 1 and June 30 of a given year. 11
16 Higher Education Statistics Graduation Rates within 150% of Normal Time Completers Cohort Grad. Rate Completers Cohort Grad. Rate UConn 2,390 3, % 3,285 4, % Central 527 1, % 732 1, % Eastern % % Southern 460 1, % 640 1, % Western % 502 1, % CSU Sub-total 1,681 4, % 2,402 4, % Asnuntuck % % Capital % % Gateway % % Housatonic % % Manchester % % Middlesex % % Naugatuck Valley % % Northwestern CT % % Norwalk % % Quinebaug Valley % % Three Rivers % % Tunxis % % CCC Sub-Total 496 4, % 950 6, % Source: IPEDS Data Center Awards and Degrees are conferred between July 1 and June 30 of a given year. 12
17 Higher Education Statistics Graduation Rates within 150% of Normal Time Independent Institutions Completers Cohort Grad. Rate Completers Cohort Grad. Rate National Non-Profit Independents Connecticut College % % Trinity College % % Wesleyan University % % Yale University 1,298 1, % 1,263 1, % National Sub-total 2,762 3, % 2,875 3, % Regional Non-Profit Independents Albertus Magnus College % % Fairfield University 822 1, % % Goodwin College % % Holy Apostles College and Seminary N/R N/R % Mitchell College % % Quinnipiac University 980 1, % 1,202 1, % Sacred Heart University % % St. Vincent s College % % University of Bridgeport % % University of Hartford 652 1, % 773 1, % University of New Haven % 678 1, % University of Saint Joseph % % Regional Non-Profit Sub-total 3,569 5, % 4,503 7, % Regional For-Profit Independents Lincoln College of New England % % Paier College of Art % % Post University % % Regional For-Profit Sub-total % % Source: IPEDS Data Center Awards and Degrees are conferred between July 1 and June 30 of a given year. 13
18 Higher Education Statistics Tuition and Fees - Public Institutions 15,000 12,000 9,000 6,000 3,000 8,362 6,391 2,645 Average Public College Tuition & Fees 13,366 9,608 4, UCONN CSU CCC UConn 8,362 8,852 9,338 9,886 10,416 10,670 11,242 12,022 12,700 13,366 CSU 6,391 6,736 7,179 7,562 8,043 8,241 8,561 8,999 9,160 9,608 CCC 2,645 2,828 2,984 3,198 3,403 3,490 3,597 3,823 3,870 4,041 As a percent, average tuition and fees as public institutions has risen at a higher rate than the independent non-profit institutions. UConn has risen the most since by 68.9%. Room and board charges are not included, however, that information is available in the appendix. In-state rates are reflected for public institutions. Source: IPEDS Data Center for in-state tuition rates and required fees. 14
19 Higher Education Statistics Tuition and Fees - Independent Institutions 60,000 50,000 40,000 30,000 20,000 Average Independent College Tuition & Fees 34,263 21,103 49,250 29,173 17,286 10,000-16, Nat. Ind. Non-Profits Reg. Ind. Non-Profits Reg. Ind. For-Profits Natn l Ind. Non-Profit 34,263 36,069 37,551 39,144 41,699 43,134 44,712 46,210 47,717 49,250 Regn l Ind. Non-Profit 20,831 22,212 23,693 24,848 26,041 27,242 28,644 29,506 28,805 29,173 Regn l Ind. For-Profit 16,303 16,508 16,660 18,517 18,708 17,683 19,113 20,083 20,583 17,286 Since , Regional Independent non-profit institutions have risen by 50.7% while the National Independent non-profits have risen by 48.4% Room and board charges are not included, however, that information is available in the appendix. Source: IPEDS Data Center for in-state tuition rates and required fees. 15
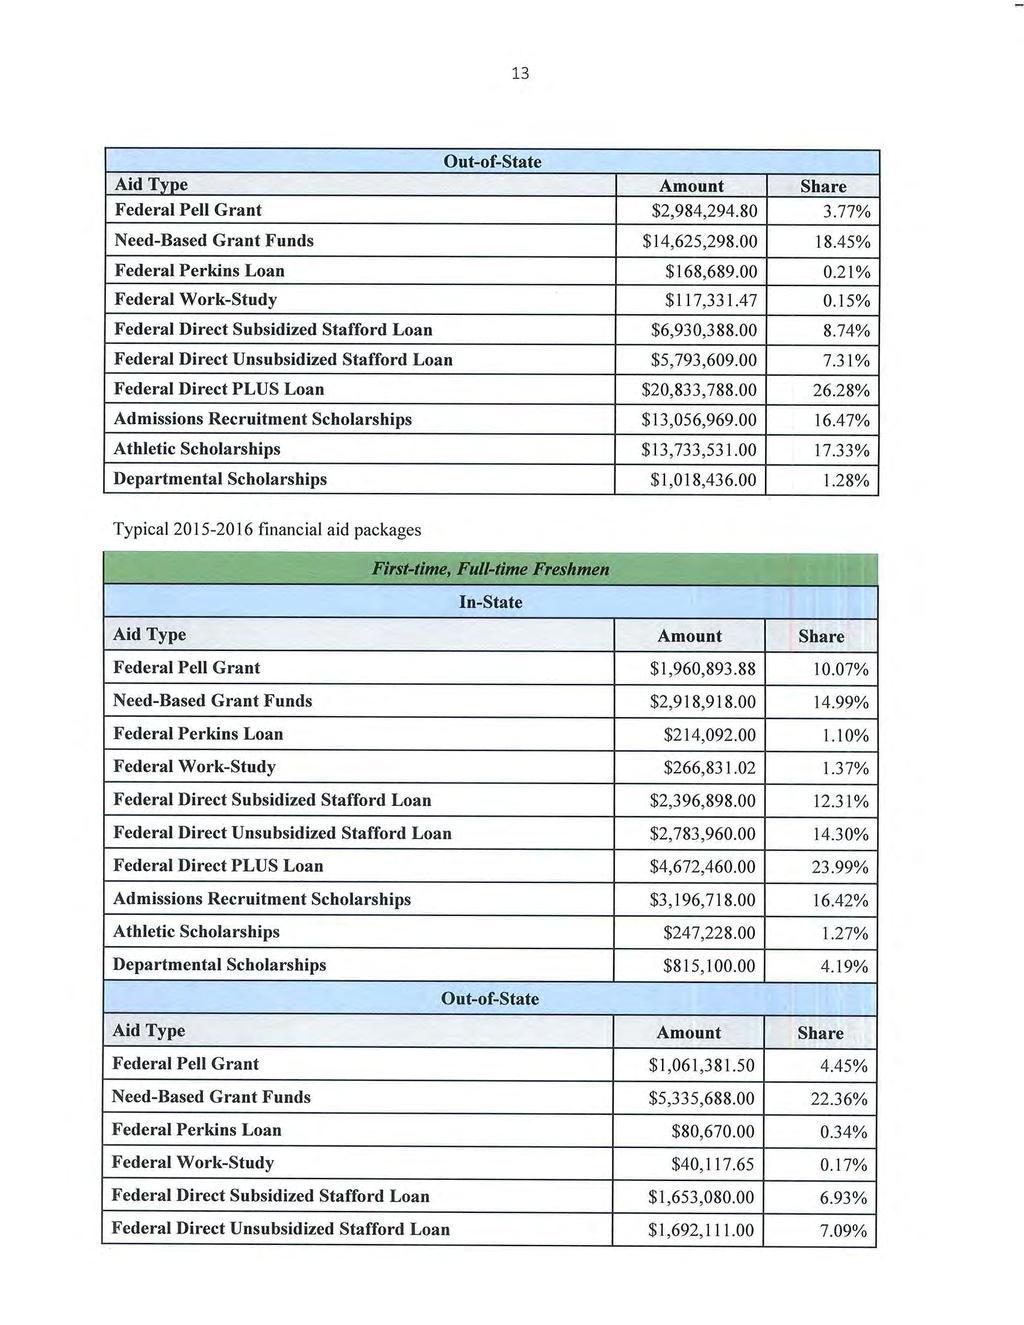
20 Higher Education Statistics Tuition and Fees Total Tuition & Required Fees Room & Board Total Total Tuition & Required Fees Room & Board UConn $8,362 $8,266 $16,628 $13,366 $12,436 $25,802 Total Central $6,442 $7,890 $14,332 $9,300 $11,134 $20,434 Eastern $6,572 $7,964 $14,536 $10,016 $12,108 $22,124 Southern $6,442 $8,031 $14,473 $9,600 $11,614 $21,214 Western $6,106 $7,766 $13,872 $9,516 $11,738 $21,254 CSU Average $6,391 $7,913 $14,303 $9,608 $11,649 $21,247 Asnuntuck $2,672 $2,672 $4,072 $4,072 Capital $2,672 $2,672 $4,102 $4,102 Gateway $2,672 $2,672 $4,032 $4,032 Housatonic $2,352 $2,352 $4,032 $4,032 Manchester $2,672 $2,672 $4,052 $4,052 Middlesex $2,672 $2,672 $4,032 $4,032 Naugatuck Valley $2,672 $2,672 $4,072 $4,072 Northwestern CT $2,672 $2,672 $4,047 $4,047 Norwalk $2,672 $2,672 $4,052 $4,052 Quinebaug Valley $2,672 $2,672 $4,062 $4,062 Three Rivers $2,672 $2,672 $4,072 $4,072 Tunxis $2,672 $2,672 $3,866 $3,866 CCC Average $2,645 $2,645 $4,041 $4,041 In-state rates are reflected for public institutions. Source: IPEDS Data Center Note: IPEDS Data includes the percentage of state appropriations to total all revenues and other additions. 16
21 Higher Education Statistics Tuition and Fees Independent Institutions National Non-Profit Independents Total Tuition & Required Fees Room & Board Total Total Tuition & Required Fees Room & Board Connecticut College N/R N/R N/R $49,350 $13,615 $62,965 Trinity College $35,130 $8,970 $44,100 $50,776 $13,144 $63,920 Wesleyan University $34,630 $9,540 $44,170 $49,274 $13,504 $62,778 Yale University $33,030 $10,020 $43,050 $47,600 $14,600 $62,200 National Non-Profit Average $34,263 $9,510 $43,773 $49,250 $13,716 $62,966 Total Regional Non-Profit Independents Albertus Magnus College $19,390 $8,403 $27,793 $29,650 $13,608 $43,258 Fairfield University $31,955 $9,980 $41,935 $44,875 $13,520 $58,395 Goodwin College $13,570 - $13,570 $20,400 - $20,400 Hartford Seminary N/R N/R N/R $12,344 $5,130 $17,474 Holy Apostles College and Seminary $9,950 - $9,950 $7,750 - $7,750 Mitchell College $21,737 $9,795 $31,532 $31,000 $12,500 $43,500 Quinnipiac University $26,280 $10,700 $36,980 $42,270 $14,820 $57,090 Sacred Heart University $25,300 $11,030 $36,330 $37,371 $14,140 $51,310 St. Vincent s College $10,680 - $10,680 $14,630 - $14,630 University of Bridgeport $21,710 $9,600 $31,310 $30,850 $12,990 $43,840 University of Hartford $25,776 $9,922 $35,698 $36,460 $13,666 $50,126 University of New Haven $24,000 $10,130 $34,130 $35,650 $14,720 $50,370 University of Saint Joseph $22,890 $12,360 $35,250 $36,200 $14,850 $51,050 Regional Non-Profit Average $21,103 $10,213 $28,763 $29,173 $12,994 $39,169 Regional For-Profit Independents Lincoln College of New England $15,800 $3,500 $19,300 $19,950 $4,400 $29,250 Paier College of Art $12,360 - $12,360 $15,450 - $15,450 Post University $20,750 $8,400 $29,150 $16,458 $10,000 $26,458 Regional For-Profit Average $16,303 $5,950 $20,270 $17,286 $7,700 $22,419 Source: IPEDS Data Center 17
22 Higher Education Statistics Endowment $400.0 $300.0 $200.0 Average Public College Endowment $217.3 $364.6 $100.0 $- $7.6 $ UCONN CSU CCC $10,000.0 $8,000.0 $6,000.0 $4,000.0 Average Independent Endowment $4,787.2 $8,984.6 $2,000.0 $34.5 $96.4 $ Nat. Ind. Non-Profits Reg. Ind. Non-Profits Reg. Ind. For-Profits UConn $217.3 $248.1 $232.9 $245.8 $263.6 $306.3 $301.6 $329.0 $367.0 $364.6 CSU $7.6 $8.4 $9.9 $8.7 $10.8 $17.0 $18.2 $20.6 $23.8 $25.3 CCC $1.6 $1.9 $2.5 $2.0 $2.1 $2.2 $2.2 $2.3 $2.4 $2.5 COSC $1.1 $1.4 $1.3 $1.1 $1.2 $1.4 $1.3 $1.5 $1.7 $1.7 Nat. Ind. Non-Profit $4,787.2 $5,940.2 $5,997.1 $4,271.2 $4,391.8 $5,106.3 $5,132.7 $5,530.2 $6,370.4 $8,984.6 Reg. Ind. Non-Profit $34.5 $56.0 $55.6 $45.0 $ 51.4 $68.0 $67.6 $76.2 $85.8 $96.4 Reg. Ind. For-Profit $5.3 $4.4 $4.4 $8.7 $77.2 $78.9 $9.3 $9.9 $10.0 $10.6 Data as reported indicates 44% growth in the size of institutional endowments among CT institutions in the last 10 years. Endowments a public institutions have nearly doubled in the last 10 year period. Wide variances at individual institutions can be seen in supporting data located in the appendix. COSC - Charter Oak State College Endowment in Millions Source: IPEDS Data Center 18
23 Higher Education Statistics Endowment - Public Institutions % Growth UConn $217,33,316 $364,567, % Central N/R $54,422,625 - Eastern $6,942,929 $13,350, % Southern $8,184,090 $15,176, % Western N/R $18,420,972 - CSU Average $7,563,510 $25,342, % Asnuntuck $123,305 $137, % Capital $732,613 $838, % Gateway $232,590 $888, % Housatonic $282,098 $597, % Manchester $1,471,584 $2,623, % Middlesex $207,783 $422, % Naugatuck Valley $500,828 $840, % Northwestern CT $327,088 $1,186, % Norwalk $13,045,655 $16,217, % Quinebaug Valley $1,247,465 $2,719, % Three Rivers $818,389 $2,411, % Tunxis $145,906 $537, % CCC Average $1,594,609 $2,451, % Charter Oak State College $1,106,080 $1,682, % Source: IPEDS Data Center 19
24 Higher Education Statistics Endowment - Independent Institutions Independent Institutions % Growth National Non-Profit Independents Connecticut College $192,481,000 N/R - Trinity College $387,410,852 $572,033, % Wesleyan University $619,761,000 $838,774, % Yale University $17,949,088,000 $25,542,983, % National Non-Profit Average $4,787,185,213 $8,984,596, % Regional Non-Profit Independents Albertus Magnus College $2,680,925 $6,799, % Fairfield University $218,544,000 $317,035, % Goodwin College $173,000 $8,707, % Hartford Seminary N/R $43,947,561 - Holy Apostles College and Seminary $657,367 N/R - * Lyme Academy College of Fine Arts $3,058,754 N/R - Mitchell College $4,562,483 $8,805, % Quinnipiac University N/R $367,874,617 - Sacred Heart University $53,921,426 $141,011, % St. Vincent s College $4,092,488 $4,234, % University of Bridgeport $4,911,000 $33,617, % University of Hartford $94,674,000 $148,917, % University of New Haven $10,591,122 $39,057, % University of Saint Joseph $16,147,000 $26,505, % Regional Non-Profit Average $37,359,528 $96,376, % Regional For-Profit Independents Lincoln College of New England $1,195,295 N/R - Paier College of Art $618,466 $458, % Post University $13,945,594 $20,799, % Regional For-Profit Average $5,253,118 $10,628, % Source: IPEDS Data Center Lyme Academy of Fine Arts was purchased by the University of New Haven. * 20
25 Higher Education Statistics Funding for Public institutions 50% State Appropriations as Percent of Higher Education Revenue 40% 30% 36% 37% 40% 34% 32% 34% 29% 30% 30% 30% 20% 10% 0% UConn 33.6% 34.1% 36.5% 29.1% 29.8% 30.6% 24.4% 26.9% 25.3% 25.1% CSU 31.1% 36.5% 36.4% 34.6% 36.8% 35.0% 30.9% 29.6% 32.6% 33.0% CCC 49.2% 43.6% 55.2% 55.7% 35.2% 48.8% 44.4% 44.5% 51.5% 47.1% COSC 23.4% 28.1% 26.6% 24.0% 20.5% 19.9% 24.9% 20.8% 19.9% 20.2% The percentage of state dollars to public institutions as opposed to other sources of revenue peaked in , but has retreated to its lowest levels in the 10 year reporting period. IPEDS defines state appropriations as amounts received from state government through direct appropriation. No reference is made to beginning or ending dollars. Source: IPEDS Data Center Note: IPEDS Data includes the percentage of state appropriations to total all revenues and other additions. 21
26 Higher Education Statistics Funding for Public institutions Annual State Appropriations $700.0 $631.3 $600.0 $500.0 $400.0 $300.0 $200.0 $100.0 $305.9 $217.7 $209.0 $277.7 $252.2 $ UConn CSU CCC COSC UConn $285.7 $305.9 $328.2 $536.3 $543.9 $554.2 $485.4 $501.8 $574.2 $631.3 CSU $206.4 $207.7 $232.0 $299.1 $226.0 $236.2 $201.5 $214.5 $257.0 $277.7 CCC $190.0 $209.0 $222.6 $221.9 $220.2 $225.4 $202.6 $207.4 $246.1 $252.2 COSC $1.6 $2.0 $2.2 $2.1 $2.2 $2.2 $2.6 $2.5 $2.7 $3.1 While appropriations as a percent of total revenue has declined in recent years, total annual state appropriation dollars for higher education have grown by 70.3% in the last 10 years. UConn appropriations have grown the most at 121.0%, followed by Charter Oak at 85.7% and Community Colleges and State Universities at 34.6% and 32.7% respectively. Note: Appropriations in Millions. Source: IPEDS Data Center 22
27 Higher Education Statistics Higher Education Funding - 10 Year Trend of State Appropriations as a Percent of Total Revenue Percent Percent UConn 285,675, % 631,344, % Central 67,579, % 87,019, % Eastern 36,464, % 52,513, % Southern 65,410, % 85,474, % Western 36,911, % 52,708, % CSU Sub-total 206,365, % 277,716, % Asnuntuck 7,775, % 12,254, % Capital 15,737, % 20,755, % Gateway 19,278, % 29,153, % Housatonic 16,012, % 24,569, % Manchester 24,645, % 30,008, % Middlesex 10,016, % 13,147, % Naugatuck Valley 26,196, % 32,940, % Northwestern CT 9,644, % 11,344, % Norwalk 21,086, % 25,448, % Quinebaug Valley 7,461, % 11,696, % Three Rivers 16,452, % 20,750, % Tunxis 15,727, % 20,091, % CCC Sub-Total 190,035, % 252,162, % Charter Oak State College 1,649, % 3,063, % Total 683,726, % 1,164,286, % Source: IPEDS Data Center Note: IPEDS Data includes the percentage of state appropriations to total all revenues and other additions. 23
28 Higher Education Statistics Instructional Expense as a Percentage of Total Expenses 80% 70% 60% 50% 40% 30% 20% 10% 0% Public College Expense by Percentage 69% 66% 31% 34% % Instructional Expense % All Other Expense Independent College Expense by Percentage 70% 60% 50% 40% 30% 20% 10% 0% 58% 54% 42% 46% % Instructional Expense % All Other Expense As a whole of the percentage of institutional expenses classified as instructional expense has increased from levels reported 10 years ago. Source: IPEDS Data Center All Other Expenses include the following: Research, Public Service, Academic Support, Student Services, Institutional Support, Net Grant Aid to Students, Independent Operations, and Other Expenses. Note: IPEDS Data includes total all revenues and other additions, and state appropriations. 24
29 Higher Education Statistics Higher Education Expenses - Instructional Expenses Percent of Total Percent of Total UConn $245,567, % $622,737, % Central $51,841, % $107,337, % Eastern $25,131, % $50,299, % Southern $59,649, % $108,139, % Western $32,509, % $59,663, % CSU Sub-total $169,132, % $325,439, % Asnuntuck $4,680, % $9,997, % Capital $11,313, % $20,212, % Gateway $15,354, % $37,970, % Housatonic $10,436, % $20,920, % Manchester $15,143, % $30,369, % Middlesex $6,049, % $12,192, % Naugatuck Valley $16,626, % $32,177, % Northwestern CT $4,736, % $8,158, % Norwalk $16,040, % $28,471, % Quinebaug Valley $4,270, % $8,054, % Three Rivers $9,992, % $19,895, % Tunxis $9,865, % $18,672, % CCC Sub-Total $124,507, % $247,095, % Charter Oak State College $920, % $5,952, % Total $540,127, % $1,201,225, % Source: IPEDS Data Center 25
30 Higher Education Statistics Higher Education Expenses - Instructional Expenses National Non-Profit Independents Percent of Total Percent of Total Connecticut College $28,267, % $38,951, % Trinity College $41,927, % $56,764, % Wesleyan University $73,070, % $87,361, % Yale University $855,355, % $1,620,648, % National Non-Profit Average $998,619, % $1,803,725, % Regional Non-Profit Independents Albertus Magnus College $8,689, % $9,117, % Fairfield University $42,333, % $55,189, % Goodwin College $3,851, % $40,930, % Hartford Seminary N/R - $1,196, % Holy Apostles College and Seminary $705, % $872, % Mitchell College $4,128, % $3,723, % Quinnipiac University $63,347, % $125,687, % Sacred Heart University $31,812, % $59,190, % St. Vincent s College $1,734, % $4,571, % University of Bridgeport $21,720, % $38,143, % University of Hartford $68,975, % $84,141, % University of New Haven $33,993, % $58,025, % University of Saint Joseph $10,287, % $23,982, % Regional Non-Profit Average $291,577, % $506,577, % Regional For-Profit Independents Lincoln College of New England $1,839, % $4,730, % Paier College of Art $965, % $752, % Post University $5,053, % $19,561, % Regional For-Profit Average $7,857, % $25,045, % Total $1,298,054, % $2,335,348, % Source: IPEDS Data Center 26
31 Higher Education Statistics Faculty/Staffing Positions Public Institutions 50.0% 40.0% 30.0% UConn Staffing 40.4% 41.9% 32.6% 31.0% 27.1% 27.0% 20.0% 10.0% 0.0% Instruction Admin Other 80.0% 60.0% 40.0% 20.0% 0.0% CSU Staffing 64.2% 63.8% 24.8% 25.0% 11.0% 11.1% Instruction Admin Other 100.0% 80.0% 60.0% 40.0% 20.0% 0.0% CCC Staffing 79.5% 80.7% 15.5% 15.1% 5.0% 4.2% Instruction Admin Other At UConn, instructional staffing, as a percentage of total staffing, has remained flat over the last 4 years since the SOC code reclassification while administrational staffing has grown slightly. At CSU and CCC, instructional and administrative staffing have remained flat. Source: IPEDS Data Center Note In 2012, The IPEDS HR survey was changed to comply with the requirement to align IPEDS HR reporting with the 2010 Standard Occupational Classification (SOC) system. Instruction includes instructional staff, instructional research, public service staff, librarians, curators, archivists, academic affairs and other educational services. Administration includes office and administrative support, management, business and financial operations, computer engineering and science, community service and legal arts and media. Other includes healthcare practitioners and technical, service staff, sales and related, natural resources, construction and maintenance, production, transport and material moving, as defined by IPEDS. 27
32 Faculty/Staffing Positions - Independent Institutions Higher Education Statistics 50.0% 40.0% National Staffing 44.3% 42.6% 39.9% 41.5% 30.0% 20.0% 15.8% 15.9% 10.0% 0.0% Instruction Admin Other 80.0% 60.0% 40.0% 20.0% 0.0% Regional Non-Profit Staffing 59.9% 51.4% 37.6% 31.1% 11.0% 9.0% Instruction Admin Other 100.0% 80.0% 60.0% 40.0% 20.0% 0.0% Regional For-Profit Staffing 80.0% 63.4% 31.9% 15.7% 4.7% 4.4% Instruction Admin Other At the National Independent s, instructional staffing, as a percentage of total staffing, grew slightly over the last 4 years since the SOC code reclassification while administrational staffing declined slightly. At the Regional Non-Profit and For-Profit Independent s, instructional staffing, as a percentage of total staffing, grew over the last 4 years since the SOC code reclassification while administrational staffing declined. Source: IPEDS Data Center Note In 2012, The IPEDS HR survey was changed to comply with the requirement to align IPEDS HR reporting with the 2010 Standard Occupational Classification (SOC) system. Instruction includes instructional staff, instructional research, public service staff, librarians, curators, archivists, academic affairs and other educational services. Administration includes office and administrative support, management, business and financial operations, computer engineering and science, community service and legal arts and media. Other includes healthcare practitioners and technical, service staff, sales and related, natural resources, construction and maintenance, production, transport and material moving, as defined by IPEDS. 28
33 Higher Education Statistics Faculty/Staffing Positions Public Instruction & Library Office Admin & Bus. Other Total Percent Instruction & Library Instruction & Library Office Admin & Bus. Other Total Percent Instruction & Library UConn 2,601 3,881 3,133 9, % 2,623 4,065 3,010 9, % Central 1, , % 1, , % Eastern % % Southern 1, , % 1, , % Western , % , % CSU Sub-total 3,522 1, , % 3,403 1, , % Asnuntuck % % Capital % % Gateway % % Housatonic % % Manchester % % Middlesex % % Naugatuck Valley % % Northwestern CT % % Norwalk % % Quinebaug Valley N/R N/R N/R N/R % Three Rivers % % Tunxis % % CCC Sub-Total 4, , % 4, , % Charter Oak % % Total 10,641 6,127 4,002 20, % 10,422 6,239 3,819 20, % Source: IPEDS Data Center Note In 2012, The IPEDS HR survey was changed to comply with the requirement to align IPEDS HR reporting with the 2010 Standard Occupational Classification (SOC) system. N/R - Not Reported 29
34 Higher Education Statistics Faculty/Staffing Positions - Independent Instruction & Library Office Admin & Bus. Other Total Percent Instruction & Library Instruction & Library Office Admin & Bus. Other Total Percent Instruction & Library National Non-Profit Independents Connecticut College N/R N/R N/R N/R % Trinity College N/R N/R N/R N/R % Wesleyan University % , % Yale University 5,657 6,453 2,325 14, % 6,040 6,453 2,367 14, % National Non-Profit Average 6,142 6,822 2,439 15, % 7,238 7,422 2,762 17, % Regional Non-Profit Independents Albertus Magnus College N/R N/R N/R N/R % Fairfield University N/R N/R N/R N/R , % Goodwin College % % Hartford Seminary N/R N/R N/R N/R % Holy Apostles College and Semi- N/R N/R N/R N/R % Mitchell College N/R N/R N/R N/R % Quinnipiac University , % 1, , % Sacred Heart University N/R N/R N/R N/R , % St. Vincent s College N/R N/R N/R N/R % University of Bridgeport % % University of Hartford N/R N/R N/R N/R - 1, , % University of New Haven , % , % University of Saint Joseph N/R N/R N/R N/R % Regional Non-Profit Average 1,794 1, , % 6,247 3, , % Regional For-Profit Independents Lincoln College of New England % % Paier College of Art N/R N/R N/R N/R % Post University % , % Regional For-Profit Average , % , % Source: IPEDS Data Center Note In 2012, The IPEDS HR survey was changed to comply with the requirement to align IPEDS HR reporting with the 2010 Standard Occupational Classification (SOC) system. N/R - Not Reported 30
35 Student Aid The Governor s Scholarship Program (GSP) The Governor s Scholarship Program (GSP) was the state s financial aid program for eligible Connecticut residents who were enrolled as undergraduates at Connecticut s public and nonprofit, independent institutions of higher education. The three components of the GSP were a need-merit scholarship, a need-based grant and an academic incentive award (AIA). All three components were designed to provide aid to Connecticut s neediest students, while supporting access, retention and completion. Objectives Access The GSP supported access by making college more affordable for the neediest students. This program applied the same eligibility and award standards to all students regardless of the school they chose to attend and targeted those students with the most need. This approach provided consistency for students, measurability for the state, and the most effective use of funding. Retention Awards contributed to students staying in school. Awards were renewable with satisfactory academic progress and continuing need. Awards were available for 1.5 times the minimum time to graduation (3 years for a 2 year school; 6 years for a 4 year school). Completion The GSP focused on student completion by making college more affordable and encouraging ontime completion. GSP Appropriation GSP Need-Based GSP Need-Merit AIA FY 2014 $42,011,398 $33,408,876 $8,402,279 $0 FY 2015 $42,023,498 $32,463,152 $8,404,699 $765,195 FY 2016 $43,159,400 $29,565,007 $11,365,016 $888,103 Total GSP Recipients FY 2014 FY2015 FY2016 CC 5,254 4, CSU 4,200 3, UConn 3,821 3, Independents 5,648 5, Ind. - Nationals Total GSP Aid Dollars FY 2014 FY2015 FY2016 CC $6,924,366 $5,766,558 $6,011,837 CSU $10,619,190 $9,680,064 $11,906,408 UConn $10,355,306 $10,936,559 $13,865,123 Independents $13,985,908 $12,948,500 $9,136,568 Ind. - Nationals $998,466 $768,162 $612,109 Average GSP Student Award FY 2014 FY2015 FY2016 CC $1,104 $1,124 $1,180 CSU $2,411 $2,496 $2,880 UConn $2,688 $2,557 $3,133 Independents $2,533 $2,344 $1,986 Ind. - Nationals $3,491 $3,417 $3,802 Source: Institution generated student data reports. 31
36 Student Aid The Need-Merit Scholarship The Governor s Scholarship Program (GSP) The Governor's Need-Merit Scholarship Program provided state aid to help Connecticut s neediest and brightest students pay for college. It was not strictly a merit program; priority was given to those who were least able to contribute to college costs. Based upon continued funding, students could use their awards at any Connecticut college or university. Awards were made on a sliding scale up to a maximum federal expected family contribution (EFC) set annually by the Office of Higher Education and based on funding levels and the number of eligible applicants. The dollar amount of individual Need-Merit Scholarships were higher than Need-Based Grants and were awarded by the Office of Higher Education. Objectives Access To qualify, students first had to meet the same EFC range as those students who recieved a GSP Need-Based Grant, but unlike the GSP Need-Based Grant, the GSP Need-Merit Scholarship provided Connecticut s neediest, highest academic achieving students a guaranteed award amount which was portable to any Connecticut college or university they chose to attend. In addition, their award was transferable. Retention These awards recognized the academic performance students achieved in high school. Recognizing and rewarding academic performance is a nationally proven enrollment and retention strategy. Awards were renewable with satisfactory academic progress and continuing need. Awards were renewable for 1.5 times the minimum time to graduation (3 years for a 2 year school; 6 years for a 4 year school). Completion For many students, the GSP Need-Merit Scholarship provided the final bridge to making attainment of their degree a reality. FY 2014 FY 2015 FY 2016 Total Awards $5,990,496 $8,447,282 $11,322,476 Total Recipients 2,438 2,503 2,727 Average Award $2,457 $3,375 $4,152 Source: Institution generated student data reports. 32
37 Student Aid The Governor s Scholarship Program (GSP) The Governor s Need-Based Grant The Governor's Need-Based Grant provided state aid to help Connecticut students that were least able to pay for college. Eligible individual institutions received a funding allotment based on the number of needy Connecticut students enrolled in the previous year. Awards were made on a sliding scale up to a maximum federal expected family contribution (EFC) as determined by the Office of Higher Education. Based upon continued funding, students were able to use their awards at any Connecticut college or university, but unlike the GSP Need-Merit Scholarship, the Need-Based Grant was not transferable from one institution to another. Student s who received a Governor s Need-Merit Scholarship were not eligible for a Governor s Need-Based Grant. Objectives Access To qualify, students first had to meet the same EFC range as those students who received a GSP Need-Merit Scholarship. The grant provided for a fair and equitable student award by requiring eligible institutions to award students with like EFC s the same award amount. Retention Awards were renewable with satisfactory academic progress and continuing need. Awards were renewable for 1.5 times the minimum time to graduation (3 years for a 2 year school; 6 years for a 4 year school). Completion The GSP Need-Based Grant helped many students achieve their degrees. FY 2014 FY 2015 FY 2016 Total Awards $34,376,946 $33,302,721 $29,534,588 Total Recipients 17,380 16,743 14,898 Average Award $1,978 $1,989 $1,982 Source: Institution generated student data reports. 33
38 Student Aid The Governor s Scholarship Program (GSP) The Academic Incentive Award The Academic Incentive Award (AIA) was created to encourage retention and completion for any student who received the GSP Need-Based Grant with sufficient credits to complete an associate s degree in two years or bachelor s degree in four years and who exceeded the minimum satisfactory academic performance standards set by the Office of Higher Education. This component was effective for new students (freshmen in fall 2013) who were eligible in their second year of study. Objectives Retention The Academic Incentive Award provided additional funding to recipients of the GSP Need- Based Grant who were on pace, academically, to complete their degree in the required time frame with a competitive GPA. Completion This award component encouraged Connecticut s neediest students to complete their degrees on-time with good academic achievement. Thus, avoiding additional loan indebtedness, increased college costs and lost future earnings. FY 2015 FY 2016 Total Awards $746,100 $885,703 Total Recipients Average Award $1,079 $1,168 Source: Institution generated student data reports. 34
39 Student Aid Minority Teacher Incentive Grant Program The Minority Teacher Incentive Program was launched in 1999 to encourage more minority students to become teachers in Connecticut. Minority junior or senior college students enrolled in state teacher preparation programs are nominated by their institutions to receive grants of up to $5,000 per year for the last two years enrolled in college. Additionally, students who gain teaching positions in a Connecticut public elementary, middle, or high school are eligible for loan reimbursement grants for up to four years of $2,500 per year. Potentially, each qualified student and subsequent teacher may earn up to $20,000 from the program in total. Since its inception, the Minority Teacher Incentive Program has awarded nearly $5.5 million in grants and $2.0 million in loan reimbursements to 633 potential teachers of whom 67 percent carried loans, 24 percent were transfers from community colleges and 33 percent were eligible for stipends and have become teachers in Connecticut public schools. There are likely to be more program participants than reported who are active teachers, but those without loans are not tracked at this time. Program graduates are currently teaching in 24 Connecticut towns including Bridgeport, Hartford, New Haven, New London and Waterbury. Current grant recipients are attending the University of Connecticut, the Connecticut State University System, Connecticut College, the University of Hartford and Fairfield University First-Time Teachers New Participants * With Loans CC Transfers * Out of 59 nominations, 14 were awarded due to lack of funding. Program Recipients Source: Institution generated student data reports. 35
40 Student Aid Minority Teacher Incentive Grant Program Grant and Stipend Expenditures Grants # $ # $ # $ # $ # $ # $ # $ # $ # $ # $ Alternate Route to Certification 21 10, , , , Central CSU , , , , , , , , , ,500 Connecticut College 2 7, , , , Eastern CSU 3 10, , , , , , , , , ,500 Fairfield University 1 5, , , , , , , , ,000 Quinnipiac University , , , , Sacred Heart University 1 5, , Southern CSU 5 20, , , , , , , , ,500 University of Connecticut 14 70, , , , , , , , , ,000 University of Hartford 6 30, , , , , , , , ,000 University of Saint Joseph 4 20, , , , , , , , Western CSU 10 45, , , , , , , , , ,000 Yale University 2 10, , Subtotal , , , , , , , , , ,500 Stipends # $ # $ # $ # $ # $ # $ # $ # $ # $ # $ Central CSU 20 48, , , , , , , , , ,000 Connecticut College , , ,160 Eastern CSU 1 2, , , , , , , , , ,500 Fairfield University 1 2, , , , , , , , Quinnipiac University 1 2, , , , , , ,000 Sacred Heart University Southern CSU 9 20, , , , , , , , , ,000 University of Connecticut 19 47, , , , , , , , , ,384 University of Hartford 2 5, , , , , , , , , ,500 University of Saint Joseph 1 2, , , , , , ,000 Western CSU 6 15, , , , , , , , , ,500 Yale University Subtotal , , , , , , , , , ,044 Grand Total , , , , , , , , , ,544 Source: Institution generated student data reports. 36
41 Appendix 2016 Connecticut Higher Education Trends Enrollment - Appendix I 38 Residence - Appendix II Undergraduate Transfers Appendix III a, b Endowment - Appendix IV a, b State Funding - Appendix V 45 Instructional Expenses - Appendix VI a, b 46-47
42 Appendix - I Enrollment - All Institutions Fall FTE Enrollment Storrs 20,669 21,127 21,488 21,931 21,700 22,034 22,454 23,114 24,100 24,184 Avery Point Stamford ,040 1,041 1,161 1,269 1,250 Tri-Campus 1,941 2,036 2,024 2,066 2,128 2,181 2,072 1,995 1,975 1,807 Total 24,115 24,726 25,060 25,551 25,422 25,892 26,190 26,874 27,972 27,864 Change 1.2% 2.5% 1.3% 1.9% -0.5% 1.8% 1.1% 2.5% 3.9% -0.4% Central 9,289 9,430 9,620 9,760 9,724 9,521 9,377 9,483 9,507 9,341 Eastern 4,366 4,583 4,778 4,851 4,816 4,824 4,778 4,672 4,654 4,716 Southern 9,179 9,172 9,345 9,528 9,370 9,063 8,834 8,684 8,516 8,490 Western 4,986 5,231 5,425 5,458 5,315 5,089 4,944 4,896 4,793 4,716 CSU Subtotal 27,820 28, ,168 29,597 29,225 28,497 27,933 27,735 27,470 27,263 Asnuntuck ,013 1, , ,118 Capital 2,053 2,197 2,373 2,533 2,471 2,398 2,271 2,210 1,882 1,738 Gateway 3,367 3,631 3,919 4,195 4,160 4,538 4,491 4,708 4,413 4,062 Housatonic 2,518 2,885 3,266 3,603 3,478 3,459 3,245 2,994 3,005 2,998 Manchester 3,959 4,193 4,604 4,600 4,462 4,488 4,454 4,259 4,017 3,866 Middlesex 1,484 1,495 1,707 1,713 1,669 1,697 1,711 1,801 1,724 1,590 Naugatuck Valley 3,530 3,644 4,043 4,376 4,430 4,438 4,374 4,194 4,156 3,903 Northwestern CT Norwalk 3,505 3,619 3,962 4,021 3,991 3,966 3,854 3,795 3,654 3,461 Quinebaug Valley 1,004 1,056 1,180 1,256 1,142 1,151 1,095 1, Three Rivers 2,184 2,305 2,573 2,960 2,947 2,844 2,752 2,628 2,488 2,456 Tunxis 2,160 2,470 2,588 2,762 2,732 2,667 2,582 2,419 2,391 2,199 CCC Subtotal 27,507 29,288 32,122 33,865 33,298 33,422 32,880 31,890 30,431 29,040 Total BOR 55,327 57,704 61,290 63,562 62,523 61,919 60,813 59,625 57,901 56,302 Change 3.2% 4.1% 5.9% 3.6% -1.7% -1.0% -1.8% -2.0% -3.0% -2.8% National Non-Profit 21,096 20,871 21,097 21,359 22,241 22,470 22,637 22,905 22,754 23,020 Regional Non-Profit 35,980 37,460 38,163 39,878 40,848 40,570 41,680 43,959 43,656 43,802 Regional For-Profit 1,514 1,963 2,487 3,705 4,939 5,752 5,978 6,053 5,605 5,508 Total 58,590 60,294 61,747 64,942 68,028 68,792 70,295 72,917 69,721 72,330 Change 2.4% 2.8% 2.4% 4.9% 4.5% 1.1% 2.1% 3.6% -1.3% 0.4% Source: IPEDS Fall Enrollment Surveys 38
43 Appendix - II Residence Status Undergraduate - Public Institutions % In-State % Out-of- State % Non- Res. Alien % In-State % Outof-State % Non- Res. Alien UConn 80.6% 17.9% 1.5% 76.8% 17.2% 6.0% Central 94.1% 4.4% 1.5% 94.3% 4.1% 1.6% Eastern 92.5% 6.7% 0.8% 91.7% 7.7% 0.6% Southern 94.0% 5.2% 0.7% 93.2% 5.8% 1.1% Western 90.2% 9.5% 0.3% 89.7% 9.9% 0.4% CSU Subtotal 93.1% 6.0% 0.9% 92.6% 6.3% 1.0% Asnuntuck 94.3% 5.6% 0.1% 94.2% 5.8% 0.0 Capital 98.7% 0.5% 0.7% 98.8% 0.6% 0.6 Gateway 98.2% 0.5% 1.3% 98.4% 0.4% 1.2 Housatonic 98.3% 1.0% 0.7% 98.2% 0.7% 1.1 Manchester 98.7% 0.7% 0.6% 98.9% 0.5% 0.6 Middlesex 99.0% 0.8% 0.2% 99.3% 0.4% 0.3 Naugatuck Valley 98.9% 0.6% 0.5% 99.0% 0.4% 0.6 Northwestern CT 98.7% 1.3% 0.1% 98.5% 1.5% 0.0 Norwalk 92.5% 2.8% 4.7% 93.1% 2.3% 4.6 Quinebaug Valley 98.6% 1.2% 0.1% 94.4% 0.6% 0.0 Three Rivers 98.7% 0.8% 0.5% 98.6% 0.9% 0.5 Tunxis 98.7% 0.7% 0.6% 98.5% 0.9% 0.7 CCC Subtotal 97.7% 1.2% 1.1% 98.7% 0.8% 0.5% Charter Oak State College 59.3% 40.6% 0.1% 53.2% 46.7% 0.1% Source: IPEDS Fall Enrollment Surveys 39
44 Appendix - II Residence Status Undergraduate - Independent Institutions Independent Institutions % In-State % Out-of- State % Non-Res. Alien % In-State % Out-of- State % Non-Res. Alien National Non-Profit Independents Connecticut College 15.6% 80.0% 4.4% 17.7% 75.3% 6.9% Trinity College 21.5% 75.1% 3.4% 18.5% 71.9% 9.5% Wesleyan University 8.6% 85.0% 6.4% 8.4% 81.3% 10.3% Yale University 6.0% 85.6% 8.4% 6.5% 82.8% 10.7% National Subtotal 11.0% 82.6% 6.4% 10.8% 79.4% 9.8% Regional Non-Profit Independents Albertus Magnus College 96.3% 3.5% 0.2% 93.9% 4.4% 1.7% Fairfield University 33.9% 65.2% 0.9% 29.5% 67.5% 3.0% Goodwin College 99.0% 0.9% 0.0% 96.0% 3.7% 0.3% Holy Apostles College and Seminary 60.9% 30.4% 8.7% 16.3% 59.3% 24.4% Mitchell College 62.9% 36.5% 0.7% 65.5% 36.9% 0.6% Quinnipiac University 29.4% 69.3% 1.3% 30.0% 67.9% 2.1% Sacred Heart University 41.6% 57.1% 1.3% 36.6% 62.1% 1.3% St. Vincent s College 99.1% 0.0% 0.9% 98.4% 1.6% 0.0% University of Bridgeport 56.7% 29.3% 14.0% 54.2% 31.3% 14.5% University of Hartford 39.6% 56.7% 3.7% 47.2% 46.9% 5.9% University of New Haven 57.8% 40.5% 1.7% 40.6% 52.0% 7.4% University of Saint Joseph 91.5% 8.1% 0.4% 95.5% 3.4% 1.1% Regional Non-Profit Subtotal 49.2% 48.3% 2.5% 48.6% 47.2% 4.2% Regional For-Profit Independents Lincoln College of New England 93.4% 6.3% 0.3% 89.2% 10.8% 0.0% Paier College of Art 97.6% 1.2% 1.2% 96.1% 2.9% 1.0% Post University 69.5% 29.7% 0.8% 26.3% 73.5% 0.2% Regional For-Profit Subtotal 80.2% 19.0% 0.7% 31.6% 68.2% 0.2% Source: IPEDS Data Center 40
45 Appendix - III a Undergraduate Transfers - Public Institutions CT Residents Total Transfers CT Residents Out-of- State Res- Out-of- State Total Transfers UConn ,071 1, ,129 Central , ,067 Eastern Southern Western CSU Subtotal 2, ,650 2, ,909 Asnuntuck Capital Gateway Housatonic Manchester Middlesex Naugatuck Valley Northwestern CT Norwalk Quinebaug Valley Three Rivers Tunxis CCC Subtotal 6, ,610 4, ,825 Charter Oak State College N/A N/A N/A Source: IPEDS Fall Enrollment Surveys 41
46 Appendix - III b Undergraduate Transfers - Independent Institutions Independent Institutions CT Residents Out-of-State Residents Total Transfers CT Residents Out-of-State Residents Total Transfers National Non-Profit Independents Connecticut College Trinity College Wesleyan University Yale University National Subtotal Regional Non-Profit Independents Albertus Magnus College Fairfield University Goodwin College Holy Apostles College and Seminary Mitchell College Quinnipiac University Sacred Heart University St. Vincent s College University of Bridgeport University of Hartford University of New Haven University of Saint Joseph Regional Non-Profit Subtotal 1, ,551 1,271 1,106 2,377 Regional For-Profit Independents Lincoln College of New England Paier College of Art Post University ,301 1,625 2,926 Regional For-Profit Subtotal ,416 1,635 3,051 Source: IPEDS Data Center 42
47 Appendix - IV a Endowment - Public Institutions (in Millions) UConn $217.3 $248.1 $233.0 $245.8 $263.6 $306.3 $301.6 $329.0 $367.0 $364.6 Central N/R N/R N/R N/R N/R $33.4 $37.0 $43.5 $53.7 $54.4 Eastern $6.9 $7.6 $10.0 $7.6 $10.2 $11.5 $11.4 $12.3 $13.3 $13.4 Southern $8.2 $9.2 $10.0 $9.9 $11.3 $11.1 $11.2 $11.7 $13.5 $15.2 Western N/R N/R N/R N/R N/R $11.9 $13.0 $14.8 $14.8 $18.4 CSU Average $7.6 $8.4 $9.9 $8.7 $10.8 $17.0 $18.2 $20.6 $23.8 $25.3 Asnuntuck $0.1 $0.1 $0.1 $0.1 $0.1 $0.1 $0.1 $0.1 $0.1 $0.1 Capital $0.7 $0.8 $0.8 $0.7 $0.8 $0.8 $0.8 $0.8 $0.8 $0.8 Gateway $0.2 $0.2 $0.2 $0.2 $0.2 $0.3 $0.3 $0.6 $0.6 $0.9 Housatonic $0.3 $0.3 $0.3 $0.3 $0.3 $0.6 $0.5 $0.5 $0.6 $0.6 Manchester $1.5 $1.7 $2.0 $2.1 $2.2 $2.2 $ Middlesex $0.2 $0.2 $0.3 $0.3 $0.3 $0.3 $0.3 $0.3 $0.3 $0.4 Naugatuck Valley $0.5 $0.5 $0.7 $0.7 $0.7 $0.7 $0.7 $0.8 $0.8 $0.8 Northwestern CT $0.3 $0.4 $0.7 $0.2 $0.7 $0.8 $0.7 $1.1 $1.2 $1.2 Norwalk $13.0 $15.4 $21.1 $15.2 $15.6 $15.4 $15.7 $16.1 $16.2 $16.2 Quinebaug Valley $1.2 $1.4 $1.5 $1.4 $1.8 $2.0 $2.1 $2.3 $2.5 $2.7 Three Rivers $0.8 $1.0 $1.5 $1.9 $2.0 $2.1 $2.3 $2.3 $2.3 $2.4 Tunxis $0.1 $0.2 $0.2 $0.2 $0.5 $0.5 $0.5 $0.5 $0.5 $0.5 CCC Average $1.6 $1.9 $2.5 $2.0 $2.1 $2.2 $2.2 $2.3 $2.4 $2.5 Charter Oak State College $1.1 $1.4 $1.4 $1.1 $1.2 $1.4 $1.3 $1.5 $1.7 $1.7 Source: IPEDS Data Center N/R Not Reported 43
48 Appendix - IV b Endowment - Independent Institutions (in Millions) Independent Institutions National Non-Profit Independents Connecticut College $192.5 $225.0 $215.5 $165.0 $179.2 $212.6 $211.2 $237.0 $278.0 N/R Trinity College $387.4 $460.3 $434.3 $339.8 $370.8 $436.7 $439.1 $486.5 $551.8 $572.0 Wesleyan University $619.8 $710.8 $652.2 $476.5 $512.9 $601.5 $616.2 $688.6 $793.3 $838.8 Yale University $17,949.1 $22,364.7 $22,686.8 $16,103.5 $16,504.2 $19,174.4 $19,264.3 $20,708.8 $23,859.0 $25,543.0 National Non-Profit Average $4,787.2 $5,940.2 $5,997.1 $4,271.2 $4,391.8 $5,106.3 $5,132.7 $5,530.2 $6,370.4 $8,984.6 Regional Non-Profit Independents Albertus Magnus College $2.7 $2.7 $3.3 $2.6 $3.7 $4.5 $4.5 $5.4 $6.5 $6.8 Fairfield University $218.5 $269.4 $262.3 $203.2 $223.4 $254.0 $245.3 $271.6 $313.1 $317.0 Goodwin College $0.2 $0.3 $0.4 $0.8 $2.1 $3.4 $5.3 $7.9 $8.7 $8.7 Hartford Seminary N/R N/R N/R $30.4 $32.7 $38.5 $37.5 $41.4 $46.7 $43.9 Holy Apostles College and Seminary $0.7 $0.7 $0.6 $0.6 $0.6 N/R N/R N/R N/R N/R Mitchell College $4.6 $5.2 $5.4 $4.3 $5.1 $6.4 $6.6 $7.3 $8.5 $8.8 Quinnipiac University N/R $223.0 $228.5 $192.5 $223.5 $277.5 $272.1 $315.2 $348.9 $367.9 Sacred Heart University $53.9 $69.5 $76.1 $67.4 $82.8 $109.4 $112.5 $124.1 $137.1 $141.1 St. Vincent s College $4.1 $4.4 $3.3 $3.1 $3.4 $3.4 $4.2 $3.9 $4.4 $4.2 University of Bridgeport $4.9 $6.7 $6.5 $10.0 $13.1 $20.7 $24.9 $27.7 $30.7 $33.6 University of Hartford $94.7 $109.3 $101.5 $82.9 $91.4 $115.8 $114.6 $128.4 $146.1 $148.9 University of New Haven $10.6 $11.9 $11.9 $12.3 $17.6 $25.3 $25.8 $29.8 $34.8 $49.1 University of Saint Joseph $16.2 $20.1 $18.1 $15.5 $15.5 $21.4 $21.7 $23.1 $25.6 $26.5 Regional Non-Profit Average $37.4 $60.3 $59.8 $48.1 $55.0 $73.4 $72.9 $82.1 $92.6 $96.4 Regional For-Profit Independents Lincoln College of New England $1.2 $1.2 $1.2 $13.4 $218.6 $222.5 N/R N/R N/R N/R Paier College of Art $0.6 $0.6 $0.7 $0.7 $0.7 $0.7 $0.7 $0.6 $0.6 $0.5 Post University $13.9 $11.5 $11.4 $12.0 $12.1 $13.6 $17.8 $19.2 $19.5 $20.8 Regional For-Profit Average $5.2 $4.4 $4.4 $8.7 $77.2 $78.9 $9.3 $9.9 $10.0 $10.6 Source: IPEDS Data Center N/R Not Reported 44
49 Higher Education Funding - State Appropriations (in Millions) Appendix - V UConn Central Eastern Southern Western CSU Subtotal Asnuntuck Capital Gateway Housatonic Manchester Middlesex Naugatuck Valley Northwestern CT Norwalk Quinebaug Valley Three Rivers Tunxis CCC Subtotal Charter Oak State College Total , , ,164.3 Source: IPEDS Data Center 45
50 Higher Education Total Expenses - Public Institutions (in Millions) Appendix - VI a UConn $835.6 $863.6 $938.0 $1,762.2 $1,764.7 $1,865.0 $1,835.8 $1, , ,218.3 Central $176.1 $186.2 $198.9 $210.1 $198.4 $208.0 $200.2 $ Eastern $96.7 $97.8 $105.0 $117.4 $112.3 $115.0 $113.6 $ Southern $167.6 $179.2 $192.8 $203.1 $188.4 $199.1 $199.7 $ Western $120.9 $106.7 $107.6 $110.8 $110.5 $117.5 $116.3 $ CSU Subtotal $561.3 $569.8 $604.2 $641.3 $609.7 $639.7 $629.9 $ Asnuntuck $12.2 $13.0 $14.7 $14.9 $15.7 $17.4 $16.5 $17.3 $19.5 $22.0 Capital $30.3 $32.1 $35.4 $35.7 $38.1 $40.3 $39.5 $38.4 $40.1 $41.3 Gateway $34.3 $36.5 $41.2 $45.6 $47.8 $51.2 $58.5 $67.5 $70.2 $70.2 Housatonic $26.8 $27.8 $33.3 $38.1 $40.2 $44.7 $43.2 $41.6 $44.0 $46.4 Manchester $42.7 $46.2 $50.7 $53.6 $57.0 $59.9 $58.2 $56.5 $59.8 $60.9 Middlesex $16.3 $17.7 $19.2 $20.9 $20.9 $23.5 $21.8 $23.2 $25.8 $27.6 Naugatuck Valley $44.1 $44.2 $50.8 $55.7 $56.3 $59.5 $56.8 $59.3 $64.3 $65.8 Northwestern CT $14.0 $15.3 $17.4 $17.6 $16.2 $17.4 $17.3 $16.8 $18.4 $18.9 Norwalk $40.7 $43.8 $46.5 $49.4 $50.4 $51.5 $52.9 $52.1 $58.9 $58.7 Quinebaug Valley $13.3 $14.6 $15.6 $17.0 $17.4 $18.4 $17.3 $17.7 $18.1 $19.2 Three Rivers $24.9 $26.0 $29.8 $37.6 $35.2 $38.6 $37.4 $38.4 $39.4 $39.8 Tunxis $27.2 $29.1 $34.0 $35.1 $35.6 $36.6 $35.6 $36.3 $39.3 $40.1 CCC Subtotal $326.7 $346.3 $388.7 $421.0 $431.0 $459.0 $455.0 $465.1 $497.7 $510.8 Charter Oak State College $6.7 $6.9 $8.0 $8.5 $9.6 $10.8 $11.3 $11.5 $13.3 $14.9 Total $1,730.4 $1,786.6 $1,938.9 $2,833.4 $2,814.9 $2,974.6 $2,931.9 $3,031.0 $3,295.9 $3,496.7 Source: IPEDS Data Center 46
51 Appendix - VI b Higher Education Total Expenses - Independent Institutions (in Millions) National Non-Profit Independents Connecticut College $81.4 $82.4 $90.1 $94.9 $95.4 $97.6 $102.2 $105.0 $107.4 $108.8 Trinity College $114.7 $120.7 $129.4 $128.3 $123.0 $129.3 $130.8 $137.7 $148.1 $145.3 Wesleyan University $166.8 $167.6 $177.9 $187.4 $174.5 $180.8 $178.7 $181.2 $184.7 $191.8 Yale University $1,963.6 $2,108.5 $2,314.4 $2,493.5 $2,572.1 $2,684.0 $2,816.8 $2,976.1 $3,058.9 $3,187.6 National Non-Profit Average $2,326.4 $2,479.2 $2,711.8 $2,904.0 $2,971.9 $3,091.7 $3,228.4 $3,400.0 $3,499.2 $3,633.5 Regional Non-Profit Independents Albertus Magnus College $21.4 $22.4 $24.2 $25.2 $25.6 $26.7 $29.8 $29.5 $27.3 $27.0 Fairfield University $130.8 $140.8 $156.3 $156.2 $156.1 $159.5 $166.7 $165.7 $173.7 $180.0 Goodwin College $11.1 $13.8 $16.1 $20.9 $25.3 $34.0 $30.9 $46.8 $55.0 $65.8 Hartford Seminary N/R N/R N/R $5.0 $4.6 $4.4 $4.3 $4.4 $4.5 $4.4 Holy Apostles College and Seminary $2.1 $2.5 $2.9 $2.6 $2.9 $2.8 $3.2 $3.3 $3.2 $3.2 Mitchell College $15.0 $17.3 $20.2 $22.0 $23.5 $24.1 $24.0 $22.1 $21.9 $20.6 Quinnipiac University $140.4 $148.9 $172.0 $189.0 $191.7 $219.5 $245.3 $263.2 $291.8 $293.3 Sacred Heart University $103.2 $106.5 $114.4 $121.9 $119.3 $128.4 $139.4 $146.7 $160.4 $172.3 St. Vincent s College $3.5 $3.8 $4.2 $4.4 $5.2 $6.0 $6.3 $7.1 $8.5 $8.6 University of Bridgeport $48.0 $54.3 $66.8 $73.7 $73.8 $75.4 $78.2 $80.2 $80.9 $92.5 University of Hartford $143.1 $150.0 $154.3 $166.1 $167.9 $165.3 $169.8 $168.7 $167.5 $173.8 University of New Haven $78.7 $85.0 $98.2 $111.7 $122.0 $122.0 $137.7 $146.0 $154.5 $168.9 University of Saint Joseph $33.0 $34.4 $36.0 $39.5 $41.4 $45.8 $51.6 $54.4 $58.7 $60.9 Regional Non-Profit Average $730.3 $779.9 $865.6 $938.0 $959.3 $1,013.8 $1,087.1 $1,138.5 $1,207.9 $1,271.4 Regional For-Profit Independents Lincoln College of New England $8.0 $8.3 $9.1 $9.0 $11.2 $13.0 $17.1 $20.9 $16.1 $13.2 Paier College of Art $2.5 $2.5 $2.4 $2.3 $2.5 $2.4 $2.3 $2.1 $1.7 $1.7 Post University $19.1 $22.5 $20.3 $ $50.8 $66.6 $86.8 $90.1 $94.3 Regional For-Profit Average $29.6 $33.3 $31.8 $36.1 $48.9 $66.3 $85.9 $109.8 $107.9 $109.1 Source: IPEDS Data Center N/R - Not Reported 47
52
53
54
55
56
57
58
59
60
61
62
63
64
65
66
67
68
Strategic Plan Dashboard Results. Office of Institutional Research and Assessment
 29-21 Strategic Plan Dashboard Results Office of Institutional Research and Assessment Binghamton University Office of Institutional Research and Assessment Definitions Fall Undergraduate and Graduate
Financial aid: Degree-seeking undergraduates, FY15-16 CU-Boulder Office of Data Analytics, Institutional Research March 2017
 CU-Boulder financial aid, degree-seeking undergraduates, FY15-16 Page 1 Financial aid: Degree-seeking undergraduates, FY15-16 CU-Boulder Office of Data Analytics, Institutional Research March 2017 Contents
Data Glossary. Summa Cum Laude: the top 2% of each college's distribution of cumulative GPAs for the graduating cohort. Academic Honors (Latin Honors)
") Institutional Research and Assessment Data Glossary This document is a collection of terms and variable definitions commonly used in the universities reports. The definitions were compiled from various
Institutional Research and Assessment Data Glossary This document is a collection of terms and variable definitions commonly used in the universities reports. The definitions were compiled from various
EDUCATIONAL ATTAINMENT
 EDUCATIONAL ATTAINMENT By 2030, at least 60 percent of Texans ages 25 to 34 will have a postsecondary credential or degree. Target: Increase the percent of Texans ages 25 to 34 with a postsecondary credential.
Invest in CUNY Community Colleges
 Invest in Opportunity Invest in CUNY Community Colleges Pat Arnow Professional Staff Congress Invest in Opportunity Household Income of CUNY Community College Students
Suggested Citation: Institute for Research on Higher Education. (2016). College Affordability Diagnosis: Maine. Philadelphia, PA: Institute for
. College Affordability Diagnosis: Maine. Philadelphia, PA: Institute for") MAINE Suggested Citation: Institute for Research on Higher Education. (2016). College Affordability Diagnosis: Maine. Philadelphia, PA: Institute for Research on Higher Education, Graduate School of Education,
MAINE Suggested Citation: Institute for Research on Higher Education. (2016). College Affordability Diagnosis: Maine. Philadelphia, PA: Institute for Research on Higher Education, Graduate School of Education,
EDUCATIONAL ATTAINMENT
 EDUCATIONAL ATTAINMENT By 2030, at least 60 percent of Texans ages 25 to 34 will have a postsecondary credential or degree. Target: Increase the percent of Texans ages 25 to 34 with a postsecondary credential.
Facts and Figures Office of Institutional Research and Planning
 Facts and Figures 2008-2009 Office of Institutional Research and Planning Office of Institutional Research Fall 2009 Facts at a Glance Credit Headcount Enrollments Headcount Ethnicity Headcount Percent
Status of Women of Color in Science, Engineering, and Medicine
 Status of Women of Color in Science, Engineering, and Medicine The figures and tables below are based upon the latest publicly available data from AAMC, NSF, Department of Education and the US Census Bureau.
TRENDS IN. College Pricing
 2008 TRENDS IN College Pricing T R E N D S I N H I G H E R E D U C A T I O N S E R I E S T R E N D S I N H I G H E R E D U C A T I O N S E R I E S Highlights 2 Published Tuition and Fee and Room and Board
Higher Education Six-Year Plans
 Higher Education Six-Year Plans 2018-2024 House Appropriations Committee Retreat November 15, 2017 Tony Maggio, Staff Background The Higher Education Opportunity Act of 2011 included the requirement for
1.0 INTRODUCTION. The purpose of the Florida school district performance review is to identify ways that a designated school district can:
 1.0 INTRODUCTION 1.1 Overview Section 11.515, Florida Statutes, was created by the 1996 Florida Legislature for the purpose of conducting performance reviews of school districts in Florida. The statute
NATIONAL CENTER FOR EDUCATION STATISTICS
 NATIONAL CENTER FOR EDUCATION STATISTICS Palm Desert, CA The Integrated Postsecondary Education Data System (IPEDS) is the nation s core postsecondary education data collection program. It is a single,
A Snapshot of the Graduate School
 A Snapshot of the Graduate School Prepared for the Research Council February 6, 2009 John R. Mullin, Ph.D., FAICP Dean of the Graduate School University of Massachusetts Amherst Graduate School Purpose
Enrollment Trends. Past, Present, and. Future. Presentation Topics. NCCC enrollment down from peak levels
 Presentation Topics 1. Enrollment Trends 2. Attainment Trends Past, Present, and Future Challenges & Opportunities for NC Community Colleges August 17, 217 Rebecca Tippett Director, Carolina Demography
Graduate Division Annual Report Key Findings
 Graduate Division 2010 2011 Annual Report Key Findings Trends in Admissions and Enrollment 1 Size, selectivity, yield UCLA s graduate programs are increasingly attractive and selective. Between Fall 2001
https://secure.aacte.org/apps/peds/print_all_forms.php?view=report&prin...
 1 of 35 4/25/2012 9:56 AM A» 2011 PEDS» Institutional Data inst id: 3510 Institutional Data A_1 Institutional Information This information will be used in all official references to your institution. Institution
Shelters Elementary School
 Shelters Elementary School August 2, 24 Dear Parents and Community Members: We are pleased to present you with the (AER) which provides key information on the 23-24 educational progress for the Shelters
University of Arizona
 Annual Report Submission View Questionnaire (Edit) University of Arizona Annual Report Submission for the year 2009. Report has been submitted 1 times. Report was last submitted on 11/30/2009 7:12:09 PM.
Higher Education. Pennsylvania State System of Higher Education. November 3, 2017
 November 3, 2017 Higher Education Pennsylvania s diverse higher education sector - consisting of many different kinds of public and private colleges and universities - helps students gain the knowledge
12-month Enrollment
 12-month Enrollment 2016-17 Institution: Potomac State College of West Virginia University (237701) Overview 12-month Enrollment Overview The 12-Month Enrollment component collects unduplicated student
Iowa School District Profiles. Le Mars
 Iowa School District Profiles Overview This profile describes enrollment trends, student performance, income levels, population, and other characteristics of the public school district. The report utilizes
PUBLIC INFORMATION POLICY
 CALIFORNIA STATE POLYTECHNIC UNIVERSITY, POMONA Landscape Architecture College of Environmental Design PUBLIC INFORMATION POLICY Landscape Architecture Accreditation Board (LAAB) accredited programs are
Trends in Higher Education Series. Trends in College Pricing 2016
 Trends in Higher Education Series Trends in College Pricing 2016 See the Trends in Higher Education website at trends.collegeboard.org for figures and tables in this report and for more information and
School of Medicine Finances, Funds Flows, and Fun Facts. Presentation for Research Wednesday June 11, 2014
 School of Medicine Finances, Funds Flows, and Fun Facts Presentation for Research Wednesday June 11, 2014 Duke University Management Center Structure: Duke University Duke University Academic campus Duke
OFFICE OF ENROLLMENT MANAGEMENT. Annual Report
 2014-2015 OFFICE OF ENROLLMENT MANAGEMENT Annual Report Table of Contents 2014 2015 MESSAGE FROM THE VICE PROVOST A YEAR OF RECORDS 3 Undergraduate Enrollment 6 First-Year Students MOVING FORWARD THROUGH
MAINE 2011 For a strong economy, the skills gap must be closed.
 For a strong economy, the skills gap must be closed. 62% 36% 26% By 2020, jobs requiring a career certificate or college degree Skills gap Too few students make it through college. MEMBER Maine adults
Financing Education In Minnesota
 Financing Education In Minnesota 2016-2017 Created with Tagul.com A Publication of the Minnesota House of Representatives Fiscal Analysis Department August 2016 Financing Education in Minnesota 2016-17
UDW+ Student Data Dictionary Version 1.7 Program Services Office & Decision Support Group
 UDW+ Student Data Dictionary Version 1.7 Program Services Office & Decision Support Group 1 Table of Contents Subject Areas... 3 SIS - Term Registration... 5 SIS - Class Enrollment... 12 SIS - Degrees...
Best Colleges Main Survey
 Best Colleges Main Survey Date submitted 5/12/216 18::56 Introduction page 1 / 146 BEST COLLEGES Data Collection U.S. News has begun collecting data for the 217 edition of Best Colleges. The U.S. News
New Jersey Institute of Technology Newark College of Engineering
 New Jersey Institute of Technology Newark College of Engineering AND IN ELECTRICAL AND COMPUTER ENGINEERING Program Review Last Update: Nov. 23, 2005 MISSION STATEMENTS DOCTOR OF PHILOSOPHY IN ELECTRICAL
Access Center Assessment Report
 Access Center Assessment Report The purpose of this report is to provide a description of the demographics as well as higher education access and success of Access Center students at CSU. College access
Trends in College Pricing
 Trends in College Pricing 2009 T R E N D S I N H I G H E R E D U C A T I O N S E R I E S T R E N D S I N H I G H E R E D U C A T I O N S E R I E S Highlights Published Tuition and Fee and Room and Board
In 2010, the Teach Plus-Indianapolis Teaching Policy Fellows, a cohort of early career educators teaching
 Introduction Dollars and Sense: Elevating the teaching profession by leveraging talent In 2010, the Teach Plus-Indianapolis Teaching Policy Fellows, a cohort of early career educators teaching in low-income
November 6, Re: Higher Education Provisions in H.R. 1, the Tax Cuts and Jobs Act. Dear Chairman Brady and Ranking Member Neal:
 The Honorable Kevin Brady The Honorable Richard Neal Chairman Ranking Member Ways and Means Committee Ways and Means Committee United States House of Representatives United States House of Representatives
Differential Tuition Budget Proposal FY
 Differential Tuition Budget Proposal FY 2013-2014 MPA Differential Tuition Subcommittee MPA Faculty This document presents the budget proposal of the MPA Differential Tuition Subcommittee (MPADTS) for
Educational Attainment
 A Demographic and Socio-Economic Profile of Allen County, Indiana based on the 2010 Census and the American Community Survey Educational Attainment A Review of Census Data Related to the Educational Attainment
Trends in Student Aid and Trends in College Pricing
 Trends in Student Aid and Trends in College Pricing 2012 NYSFAAA Conference Katrina Delgrosso Senior Educational Manager Agenda What is the College Board Advocacy & Policy Center? Trends in College Pricing
Update Peer and Aspirant Institutions
 Update Peer and Aspirant Institutions Prepared for Southern University at Shreveport January 2015 In the following report, Hanover Research describes the methodology used to identify Southern University
Change Your Life. Change The World.
 Change Your Life. Change The World. Hartford Public Library has gained national recognition in redefining the urban public library in the 21 st century as an innovative and stimulating place where people
A Guide to Finding Statistics for Students
 San Joaquin Valley Statistics http://pegasi.us/sjstats/ 1 of 2 6/12/2010 5:00 PM A Guide to Finding Statistics for Students CV Stats Home By Topic By Area About the Valley About this Site Population Agriculture
State Budget Update February 2016
 State Budget Update February 2016 2016-17 BUDGET TRAILER BILL SUMMARY The Budget Trailer Bill Language is the implementing statute needed to effectuate the proposals in the annual Budget Bill. The Governor
Student Mobility and Stability in CT
 Student Mobility and Stability in CT A Report by Christine Mwaturura, Research Assistant, Partnership for Strong Communities Definitions Contrary to what many people assume, the mobility rate and the stability
Council on Postsecondary Education Funding Model for the Public Universities (Excluding KSU) Bachelor's Degrees
 Bachelor's Degrees") Bachelor's Degrees Institution 2013-14 2014-15 2015-16 UK 3,988 4,238 4,540 UofL 2,821 2,832 2,705 EKU 2,508 2,532 2,559 MoSU 1,144 1,166 1,306 MuSU 1,469 1,512 1,696 NKU 2,143 2,214 2,196 WKU 2,751 2,704
Bachelor's Degrees Institution 2013-14 2014-15 2015-16 UK 3,988 4,238 4,540 UofL 2,821 2,832 2,705 EKU 2,508 2,532 2,559 MoSU 1,144 1,166 1,306 MuSU 1,469 1,512 1,696 NKU 2,143 2,214 2,196 WKU 2,751 2,704
University of Utah. 1. Graduation-Rates Data a. All Students. b. Student-Athletes
 University of Utah FRESHMAN-COHORT GRADUATION RATES All Students Student-Athletes # 2009-10 Graduation Rate 64% 64% Four-Class Average 61% 64% Student-Athlete Graduation Success Rate 87% 1. Graduation-Rates
Bellevue University Bellevue, NE
 C O L L E G E P R O F I L E - O V E R V I E W Bellevue University Bellevue, NE Bellevue, founded in 1966, is a private university. Its campus is located in Bellevue, in the Omaha metropolitan area. Web
Trends in Tuition at Idaho s Public Colleges and Universities: Critical Context for the State s Education Goals
 1 Trends in Tuition at Idaho s Public Colleges and Universities: Critical Context for the State s Education Goals June 2017 Idahoans have long valued public higher education, recognizing its importance
Executive Summary. Laurel County School District. Dr. Doug Bennett, Superintendent 718 N Main St London, KY
 Dr. Doug Bennett, Superintendent 718 N Main St London, KY 40741-1222 Document Generated On January 13, 2014 TABLE OF CONTENTS Introduction 1 Description of the School System 2 System's Purpose 4 Notable
NATIONAL CENTER FOR EDUCATION STATISTICS
 NATIONAL CENTER FOR EDUCATION STATISTICS The Integrated Postsecondary Education Data System (IPEDS) is the core postsecondary education data collection program for the NCES. It is a single, comprehensive
About the College Board. College Board Advocacy & Policy Center
 15% 10 +5 0 5 Tuition and Fees 10 Appropriations per FTE ( Excluding Federal Stimulus Funds) 15% 1980-81 1981-82 1982-83 1983-84 1984-85 1985-86 1986-87 1987-88 1988-89 1989-90 1990-91 1991-92 1992-93
Transportation Equity Analysis
 2015-16 Transportation Equity Analysis Each year the Seattle Public Schools updates the Transportation Service Standards and bus walk zone boundaries for use in the upcoming school year. For the 2014-15
Frank Phillips College. Accountability Report
 Frank Phillips College Accountability Report January 2016 Accountability System, January 2016 1 of 22 Participation - Key Measures Enrollment 1. Fall Headcount (Unduplicated) Fall 2000 Fall 2014 Fall 2015
Availability of Grants Largely Offset Tuition Increases for Low-Income Students, U.S. Report Says
 Wednesday, October 2, 2002 http://chronicle.com/daily/2002/10/2002100206n.htm Availability of Grants Largely Offset Tuition Increases for Low-Income Students, U.S. Report Says As the average price of attending
Undergraduates Views of K-12 Teaching as a Career Choice
 Undergraduates Views of K-12 Teaching as a Career Choice A Report Prepared for The Professional Educator Standards Board Prepared by: Ana M. Elfers Margaret L. Plecki Elise St. John Rebecca Wedel University
COLLEGE ADMISSIONS Spring 2017
 COLLEGE ADMISSIONS Spring 2017 mefa.org info@mefa.org (800) 449-MEFA (6332) Presented by: Joe Farragher, Ed.D. jfarragher@comcast.net MASSACHUSETTS EDUCATIONAL FINANCING AUTHORITY About MEFA Not-for-profit
Lakewood Board of Education 200 Ramsey Avenue, Lakewood, NJ 08701
 March 20, 2017 Judee DeStefano-Anen Interim Executive County Superintendent 212 Washington Street Toms River, NJ 08753 Dear Dr. DeStefano-Anen: It is with great sadness that I must inform you that the
U VA THE CHANGING FACE OF UVA STUDENTS: SSESSMENT. About The Study
 About The Study U VA SSESSMENT In 6, the University of Virginia Office of Institutional Assessment and Studies undertook a study to describe how first-year students have changed over the past four decades.
Segmentation Study of Tulsa Area Higher Education Needs Ages 36+ March Prepared for: Conducted by:
 Segmentation Study of Tulsa Area Higher Education Needs Ages 36+ March 2004 * * * Prepared for: Tulsa Community College Tulsa, OK * * * Conducted by: Render, vanderslice & Associates Tulsa, Oklahoma Project
Value of Athletics in Higher Education March Prepared by Edward J. Ray, President Oregon State University
 Materials linked from the 5/12/09 OSU Faculty Senate agenda 1. Who Participates Value of Athletics in Higher Education March 2009 Prepared by Edward J. Ray, President Oregon State University Today, more
Financial Plan. Operating and Capital. May2010
 10 Financial Plan Operating and Capital May2010 Published by: The Division of Planning and Budget Cornell University 440 Day Hall Ithaca, New York 14853 http://dpb.cornell.edu 607 255 0155 May 2010 Edited
A Diverse Student Body
 A Diverse Student Body No two diversity plans are alike, even when expressing the importance of having students from diverse backgrounds. A top-tier school that attracts outstanding students uses this
University of Maine at Augusta Augusta, ME
 C O L L E G E P R O F I L E - O V E R V I E W University of Maine at Augusta Augusta, ME U Maine at Augusta, founded in 1965, is a public university. Its 165-acre campus is located in Augusta, 50 miles
The number of involuntary part-time workers,
 University of New Hampshire Carsey School of Public Policy CARSEY RESEARCH National Issue Brief #116 Spring 2017 Involuntary Part-Time Employment A Slow and Uneven Economic Recovery Rebecca Glauber The
LIM College New York, NY
 C O L L E G E P R O F I L E - O V E R V I E W LIM College New York, NY The Laboratory Institute of Merchandising, founded in 1939, is a private institute. Its facilities are located in Manhattan. Web Site
Milton Public Schools Fiscal Year 2018 Budget Presentation
 Milton Public Schools Fiscal Year 2018 Budget Presentation 1 Background 2 How does Milton s per-pupil spending compare to other communities? Boston $18,372 Dedham $17,780 Randolph $16,051 Quincy $16,023
Junior (61-90 semester hours or quarter hours) Two-year Colleges Number of Students Tested at Each Institution July 2008 through June 2013
 Two-year Colleges Number of Students Tested at Each Institution July 2008 through June 2013") Number of Students Tested at Each Institution July 2008 through June 2013 List of Institutions Number of School Name Students AIKEN TECHNICAL COLLEGE, SC 119 ARKANSAS NORTHEASTERN COLLEGE, AR 66 ASHLAND
Number of Students Tested at Each Institution July 2008 through June 2013 List of Institutions Number of School Name Students AIKEN TECHNICAL COLLEGE, SC 119 ARKANSAS NORTHEASTERN COLLEGE, AR 66 ASHLAND
SUNY Downstate Medical Center Brooklyn, NY
 C O L L E G E P R O F I L E - O V E R V I E W SUNY Downstate Medical Center Brooklyn, NY SUNY Health Science Center at Brooklyn, founded in 1858, is a public, upper-division institution. Its 13-acre campus
Do multi-year scholarships increase retention? Results
 Do multi-year scholarships increase retention? In the past, Boise State has mainly offered one-year scholarships to new freshmen. Recently, however, the institution moved toward offering more two and four-year
Updated: December Educational Attainment
 Updated: Educational Attainment Among 25- to 29-year olds, the proportions who have attained a high school education, some college, or a bachelor s degree are all rising, according to longterm trends.
READY OR NOT? CALIFORNIA'S EARLY ASSESSMENT PROGRAM AND THE TRANSITION TO COLLEGE
 READY OR NOT? CALIFORNIA'S EARLY ASSESSMENT PROGRAM AND THE TRANSITION TO COLLEGE Michal Kurlaender University of California, Davis Policy Analysis for California Education March 16, 2012 This research
GRADUATE STUDENTS Academic Year
 Financial Aid Information for GRADUATE STUDENTS Academic Year 2017-2018 Your Financial Aid Award This booklet is designed to help you understand your financial aid award, policies for receiving aid and
Teacher Supply and Demand in the State of Wyoming
 Teacher Supply and Demand in the State of Wyoming Supply Demand Prepared by Robert Reichardt 2002 McREL To order copies of Teacher Supply and Demand in the State of Wyoming, contact McREL: Mid-continent
A comparative study on cost-sharing in higher education Using the case study approach to contribute to evidence-based policy
 A comparative study on cost-sharing in higher education Using the case study approach to contribute to evidence-based policy Tuition fees between sacred cow and cash cow Conference of Vlaams Verbond van
An Introduction to School Finance in Texas
 An Introduction to School Finance in Texas May 12, 2010 Sheryl Pace TTARA Research Foundation space@ttara.org (512) 472-8838 Texas Public Education System 1,300 school districts (#1 in the nation) 1,025
What You Need to Know About Financial Aid
 What You Need to Know About Financial Aid 2018-2019 Topics We Will Discuss Tonight What is financial aid? Cost of attendance (COA) Expected family contribution (EFC) Financial need Categories, types, and
UCLA Affordability. Ronald W. Johnson Director, Financial Aid Office. May 30, 2012
 UCLA Affordability Ronald W. Johnson Director, Financial Aid Office May 30, 2012 1 UC is affordable First, Students must: Apply for admission in November File FAFSA and GPA Verification Form between January
THE ECONOMIC IMPACT OF THE UNIVERSITY OF EXETER
 THE ECONOMIC IMPACT OF THE UNIVERSITY OF EXETER Report prepared by Viewforth Consulting Ltd www.viewforthconsulting.co.uk Table of Contents Executive Summary... 2 Background to the Study... 6 Data Sources
Paying for. Cosmetology School S C H O O L B E AU T Y. Financing your new life. beautyschoolnetwork.com pg 1
 Paying for Cosmetology School B E AU T Y S C H O O L Financing your new life. beautyschoolnetwork.com beautyschoolnetwork.com pg 1 B E AU T Y S C H O O L Table of Contents How to Pay for Cosmetology School...
UNIVERSITY OF REGINA. Tuition and fees
 UNIVERSITY OF REGINA Tuition and fees 2017-18 The following tuition and fee changes will be effective September 1, 2017: Tuition for all undergraduate credit hours will be increased by 2.5%, rounded to
DATE ISSUED: 11/2/ of 12 UPDATE 103 EHBE(LEGAL)-P
-P") TITLE III REQUIREMENTS STATE POLICY DEFINITIONS DISTRICT RESPONSIBILITY IDENTIFICATION OF LEP STUDENTS A district that receives funds under Title III of the No Child Left Behind Act shall comply with the
TITLE III REQUIREMENTS STATE POLICY DEFINITIONS DISTRICT RESPONSIBILITY IDENTIFICATION OF LEP STUDENTS A district that receives funds under Title III of the No Child Left Behind Act shall comply with the
SASKATCHEWAN MINISTRY OF ADVANCED EDUCATION
 SASKATCHEWAN MINISTRY OF ADVANCED EDUCATION Report March 2017 Report compiled by Insightrix Research Inc. 1 3223 Millar Ave. Saskatoon, Saskatchewan T: 1-866-888-5640 F: 1-306-384-5655 Table of Contents
Tale of Two Tollands
 Tale of Two Tollands 3-14-2017 State of Connecticut Enrollment trends Tolland Public School Enrollment Enrollment 2006-2016 3141 3131 3149 3151 3054 2954 2837 2733 2657 2599 2484 FY 2006-07 FY 2007-08
Scholarship & Travel Award Guidelines. Revised November 2016
 Scholarship & Travel Award Guidelines (non-assistantship) Revised November 2016 November 2016 Page 1 Table of Contents Sections Topics Pages I. CPH Scholarships and Awards 3 II. CPH Scholarship and Travel
Meeting these requirements does not guarantee admission to the program.
 .Eastern Connecticut State University, School of Education & Professional Studies Committee on Admission and Retention in Education (CARE) UNDERGRADUATE ELEMENTARY Teacher Certification Application Application
CHESTER FRITZ AUDITORIUM REPORT
 CHESTER FRITZ AUDITORIUM REPORT Because auditoriums serve as a force for uplifting the human spirit, it is my hope that this building will be an additional means by which future students at my Alma Mater
Kahului Elementary School
 Kahului Elementary Code: 405 Status and Improvement Report Year 2014-15 Focus On Standards Grades K-5 Focus on Standards Description Contents Setting Student Profile Community Profile Improvement Summary
FORT HAYS STATE UNIVERSITY AT DODGE CITY
 FORT HAYS STATE UNIVERSITY AT DODGE CITY INTRODUCTION Economic prosperity for individuals and the state relies on an educated workforce. For Kansans to succeed in the workforce, they must have an education
Moving the Needle: Creating Better Career Opportunities and Workforce Readiness. Austin ISD Progress Report
 Moving the Needle: Creating Better Career Opportunities and Workforce Readiness Austin ISD Progress Report 2013 A Letter to the Community Central Texas Job Openings More than 150 people move to the Austin
2010 DAVID LAMB PHOTOGRAPHY RIT/NTID FINANCIAL AID AND SCHOLARSHIPS
 2010 DAVID LAMB PHOTOGRAPHY RIT/NTID FINANCIAL AID AND SCHOLARSHIPS An Exceptional Value An Outstanding Investment An Affordable Choice You ve decided that you re looking for the quality, reputation and
2015 Annual Report to the School Community
 2015 Annual Report to the School Community Narre Warren South P-12 College School Number: 8839 Name of School Principal: Rob Duncan Name of School Council President: Greg Bailey Date of Endorsement: 23/03/2016
NC Community College System: Overview
 NC Community College System: Overview Presentation to Joint Appropriations Subcommittee on Education Brett Altman Mark Bondo Fiscal Research Division March 18, 2015 Presentation Agenda 1. NCCCS Background
Teach For America alumni 37,000+ Alumni working full-time in education or with low-income communities 86%
 About Teach For America Teach For America recruits, trains, and supports top college graduates and professionals who make an initial commitment to teach for two years in urban and rural public schools
The Condition of College & Career Readiness 2016
 The Condition of College and Career Readiness This report looks at the progress of the 16 ACT -tested graduating class relative to college and career readiness. This year s report shows that 64% of students
FRANKLIN D. CHAMBERS,
 CURRICULUM VITAE FRANKLIN D. CHAMBERS, Ph.D. EDUCATIONAL BACKGROUND Doctor of Philosophy: Organizational Communications Howard University, Washington, D.C. Masters Degree: Educational Administration Howard
SCHOOL. Wake Forest '93. Count
 Count ID 43 256 VALID N 256 Q.1A ACTIVITIES YEAR FOLLOWING GRADUATION? Primary Employed full-time 157 61.6% Employed part-time 12 4.7% Unemployed, by choice 3 1.2% Unemployed, seeking employment 7 2.7%
A Decision Tree Analysis of the Transfer Student Emma Gunu, MS Research Analyst Robert M Roe, PhD Executive Director of Institutional Research and
 A Decision Tree Analysis of the Transfer Student Emma Gunu, MS Research Analyst Robert M Roe, PhD Executive Director of Institutional Research and Planning Overview Motivation for Analyses Analyses and
Annual Report to the Public. Dr. Greg Murry, Superintendent
 Annual Report to the Public Dr. Greg Murry, Superintendent 1 Conway Board of Education Ms. Susan McNabb Mr. Bill Clements Mr. Chuck Shipp Mr. Carl Barger Dr. Adam Lamey Dr. Quentin Washispack Mr. Andre
Basic Skills Initiative Project Proposal Date Submitted: March 14, Budget Control Number: (if project is continuing)
") Basic Skills Initiative Project Proposal 2016-2017 Date Submitted: March 14, 2016 Check One: New Proposal: Continuing Project: X Budget Control Number: (if project is continuing) Control # 87-413 - EOPS
Basic Skills Initiative Project Proposal 2016-2017 Date Submitted: March 14, 2016 Check One: New Proposal: Continuing Project: X Budget Control Number: (if project is continuing) Control # 87-413 - EOPS
SAT Results December, 2002 Authors: Chuck Dulaney and Roger Regan WCPSS SAT Scores Reach Historic High
 ABOUT THE SAT 2001-2002 SAT Results December, 2002 Authors: Chuck Dulaney and Roger Regan WCPSS SAT Scores Reach Historic High The Scholastic Assessment Test (SAT), more formally known as the SAT I: Reasoning
ESSEX COUNTY COLLEGE. INSTITUTIONAL PROFILE (Excellence and Accountability)
") ESSEX COUNTY COLLEGE INSTITUTIONAL PROFILE (Excellence and Accountability) Submitted to Commission on Higher Education September 28, 2009 Office of Planning, Research & Assessment Dr. J. Scott Drakulich
ESSEX COUNTY COLLEGE INSTITUTIONAL PROFILE (Excellence and Accountability) Submitted to Commission on Higher Education September 28, 2009 Office of Planning, Research & Assessment Dr. J. Scott Drakulich