PROGRAM REVIEW CM1 COLLEGE LEVEL MATH COURSES (MATH 170, 180, 190, 191, 210, 220, 270) December 2016
|
|
|
- Jason Ambrose Carpenter
- 6 years ago
- Views:
Transcription
1 PROGRAM REVIEW CM1 COLLEGE LEVEL MATH COURSES (MATH 170, 180, 190, 191, 210, 220, 270) December 2016 MICHAEL BATEMAN JEFF COHEN JILL EVENSIZER GREG FRY MEGAN GRANICH HAMZA HAMZA LINDA HO ANNA HOCKMAN BOB LEWIS ZACHARY MARKS MATTHEW MATA ASHOD MINASIAN EDUARDO MORALES JASMINE NG KRIS NUMRICH ABAN SEYEDIN SUSAN TAYLOR RALPH TAYLOR LIJUN WANG PAUL YUN 1
2 Table of Contents 1. Overview of the Program Page 4 a) Description of the Program b) Degrees and Certificates c) College Mission and Strategic Initiatives d) Status of Previous Recommendations 2. Analysis of Institutional Research and Planning Data Page 11 a) Head Count of Students b) Course Grade Distribution c) Success Rates d) Retention Rates e) Face-to-Face Classes vs Distance Education Classes f) Enrollment Statistics g) Scheduling of Courses h) Improvement Rates i) Additional data Compiled by Faculty. j) Recommendations 3. Curriculum Page 27 a) Curriculum course review timeline b) Course additions to current course offerings c) Course deletions and inactivations from current course offerings d) Courses and number of sections offered in distance education (including hybrid classes) e) Courses, degrees, or certificates meeting students transfer or career training needs f) Recommendations 4. Assessment and Student Learning Outcomes (SLOs) Page 34 a) Alignment grid b) Timeline for course and program level SLO assessments c) Assessment percentages for course and program SLO statements d) Summaries of SLO and PLO assessment results e) Level of CM2 program in the SLO Rubric in Appendix B f) Incorporating assessment results to improve the SLO process g) Recommendations 5. Analysis of Student Feedback Page 52 a) Results of student feedback b) Implications of results for the program c) Recommendations 2
3 6. Facilities and Equipment Page 56 a) Existing program facilities and equipment b) Immediate (1-2 years) needs and cost estimate c) Long-range (2-4+ years) needs and cost estimate d) Recommendations 7. Technology and Software Page 59 a) Assessment of current technology and software b) Immediate (1-2 years) needs and cost estimate c) Long-range (2-4+ years) needs and cost estimate d) Recommendations 8. Staffing Page 61 a) Current Staffing b) Immediate and long term staffing needs and cost estimate c) Recommendations 9. Direction and Vision Page 63 a) Changes and Impact in the next 4 years b) Direction and Vision in the next 4 years c) Recommendations 10. Prioritized Recommendations Page 68 Appendix A: College Strategic Objectives Page 71 Appendix B: Demographic and Enrollment Statistics Page 72 Appendix C: Student Survey Results Page 75 Appendix D: Gateways To Engineering Page 79 3
4 1. Overview of the Program a) Description of the Program The College Level Mathematics Program (CM1) is a vital part of the Mathematics Division at El Camino College. We provide an outstanding learning environment in which students can develop the skills and knowledge needed for success in any STEM (Science, Technology, Engineering, and Mathematics) field. The CM1 program served 3485 students in 91 course sections during the school year. Our program has grown in the past four years, but further expansion and improvement of instruction could be hampered by two major factors: 1) a lack of growth in the number of full-time faculty needed to maintain a quality program, and 2) a limited amount of space in the current building housing the math department, MBA, that was not built, nor had space allocated, with such growth in mind. The program consists of the following courses: Math 170 Trigonometry Math 180 Precalculus Math 190 Single Variable Calculus and Analytical Geometry I Math 191 Single Variable Calculus and Analytical Geometry II Math 210 Introduction to Discrete Structures Math 220 Multivariable Calculus Math 270 Differential Equations with Linear Algebra The core of the program is the STEM Calculus sequence (and often the prerequisites). Many students must take this progression of courses: Math 170, 180, 190, 191, 220 and 270. The outlier is Math 210, a course in math relating to computer science, but also relevant to future mathematicians and others interested in math. CM1 students form the core of the Math Team that consistently places in the top 10% of schools nationally in the AMATYC (American Math Association of Two Year Colleges) Student Math League. Typically around one hundred students participate each year, attending weekly practices and taking the test once in the Fall and once in the Spring. The CM1 math courses form the core of a well-rounded STEM education. As stated on the website: The United States has developed as a global leader, in large part, through the genius and hard work of its scientists, engineers, and innovators. In a world that s becoming increasingly complex, where success is driven not only by what you know, but by what you can do with what you know, it s more important than ever for our youth to be equipped with the knowledge and skills to solve tough problems, gather and evaluate evidence, and make sense of information. These are the types of skills that students learn by studying science, technology, engineering, and math subjects collectively known as STEM. Yet today, few American students pursue expertise in STEM fields and we have an inadequate pipeline of teachers skilled in those subjects. That s why President Obama has set a priority of increasing the number of students and teachers who are proficient in these vital fields. 4
5 This sentiment is echoed in a CNN interview with noted astrophysicist Neil Degrasse Tyson: Innovations in science, engineering, technology and math will be the drivers of tomorrow s economy. And if you are not a participant on that frontier, you will trail behind it and possibly get left behind entirely. In 2011, the U.S. Department of Commerce s Economics and Statistics Administration released an article entitled STEM: Good Jobs Now and For the Future, detailing the state of STEM jobs over the first decade of the 21 st century. In it, they found that the growth in STEM jobs was three times as fast as growth in non- STEM jobs. In terms of earnings, STEM workers command higher wages, earning 26 percent more than their non-stem counterparts. Interestingly, they found that having a degree in a STEM field led to increased wages regardless of whether they work in STEM or non-stem occupations. The common thread is that a STEM education, which comes in part from classes such as those present in CM1, leads to increased job opportunities and higher wages even for those who choose not to pursue a career in a STEM field. In turn, the demand for a quality STEM education is likely to be on the rise. The skills gained in taking and succeeding, for example, in higher level math courses permeates other areas that are vital to future success, such as critical thinking and problem solving. The primary vision of the CM1 Program is to provide the community with a comprehensive and dynamic mathematics curriculum that will not only strengthen the math skills of our students, but will also bolster their efforts in all STEM courses. This will lead to higher success rates, graduation rates, and transfer rates. We must strive to be a department that will attract students from near or far. The local area population is aging and there are expected to be fewer school-aged children in future. CM1 will respond to this vision by maintaining our high standards, by continuously reviewing our curriculum, and by keeping up with educational trends both at local colleges and nationally. Our vision is a teaching environment that encourages faculty and students to share ideas and explore. Some teachers do this by offering student projects that go beyond course content and allow interested students to learn more than what is in the course outline. The use of Mathematica for projects, for example, allows students the opportunity to investigate mathematical concepts on their own. This also has the added benefit of introducing students to basic computer programming, which may aid them in future courses or introduce them to related fields such as computer science that they may have not considered studying before. Encouraging faculty to share their ideas, student projects, or teaching ideas at Brown Bags, which are talks given by faculty to their peers during the college hour, would foster a more stimulating educational atmosphere. 5
6 b) Degrees and Certificates Students may earn an A.S. degree in Mathematics. From the El Camino College catalog: The degree provides the student with sufficient depth to support a lifelong interest in mathematics, and is suitable for the student who plans to transfer in mathematics. The core of the major is the calculus sequence, in which the student will acquire a conceptual understanding of the principles of differential and integral calculus for calculus of one and several variables, as well as the ability to apply calculus techniques in a variety of applications. The required courses are Math 190, 191, 220, and 270. Also, 4-5 additional units from Math 150, Math 210, CSCI 1, CSCI 2, CSCI 3, PHYS 1A or PHYS 3A. Additionally, the AS-T degree in Mathematics is available. This is intended for students who plan to complete a bachelor s degree in a similar subject at a CSU campus. Students completing the AS-T degree are given priority consideration for admission to the CSU system. This has the same required courses as the A.S. Degree. 6
7 c) College Mission and Strategic Initiatives Explain how the program fulfills the college s mission and aligns with the strategic initiatives. CM1 Mission Statement: The College Level Mathematics Program at El Camino College offers quality, comprehensive mathematics courses to ensure the educational success of students from our diverse community, with an emphasis on preparing students to transfer to STEM-related majors at four-year colleges and universities. Students will learn to think analytically and critically, to work collaboratively, and to model real world problems both with and without technology and to become better communicators. The following is an overview of how the CM1 Program aligns with the college s strategic initiatives. A. STUDENT LEARNING Support student learning using a variety of effective instructional methods, educational technologies, and college resources. CM1 courses rely heavily on the use of educational technology such as Mathematica, both for student assignments and to illustrate difficult graphical and computational concepts. CM1 instructors engage students with a variety of teaching approaches, and many attend conferences and workshops each year to improve and learn new strategies. B. STUDENT SUCCESS & SUPPORT Strengthen quality educational and support services to promote and empower student learning, success, and self-advocacy. CM1 instructors advocate for more funding so that the tutoring center can be improved, so that MESA can be expanded, so that Supplemental Instruction can be introduced, and so that more workshops can be scheduled. We desire to increase the participation and success of all demographic groups through such funding and through other projects such as having a variety of outside speakers come to discuss math and STEM careers. C. COLLABORATION Advance an effective process of collaboration and collegial consultation conducted with integrity and respect. The CM1 Committee is one of the largest in the Math Division. The processes of course review, program review and SLOs are all done with efficiency and effectiveness. Many instructors work together to discuss ways to improve curriculum and to increase student engagement both in and out of class. We plan to collaborate with the Computer Science Department and other STEM departments in an effort to obtain new grants. D. COMMUNITY RESPONSIVENESS Develop and enhance partnerships with schools, colleges, universities, businesses, and community-based organizations to respond to the educational, workforce training, and economic development needs of the community. The CM1 Committee makes sure that all courses articulate with all major four-year colleges in the state. We offer courses that form the core of a good STEM education, preparing students for many fields that will be important for the economic growth of our country. 7
8 E. INSTITUTIONAL EFFECTIVENESS Strengthen processes, programs, and services through the effective and efficient use of assessment, program review, planning, and resource allocation. The CM1 Committee always gets 100% of the SLOs done on time. We work hard on course reviews and program reviews. We have strong representation on various committees, such as the Division Council, the Division Curriculum Committee, the Division Learning Outcomes Committee and the Academic Senate. F. MODERNIZATION Modernize infrastructure and technological resources to facilitate a positive learning and working environment. The CM1 Committee strongly supports an increase in funding to increase the number of computer labs, to improve the WiFi in the MBA building, to keep computer software up to date, and an allocation of more instructional space for STEM and other math and computer science courses. 8
9 d) Status of Previous Recommendations from 2011 Program Review: Recommendation a: (Increase Course Offerings Math 210) It is recommended that Math 210 be offered in both the Fall and the Spring Semesters on a permanent basis. Status: Completed. This policy was put into action in There have been sections of Math 210 offered in both the Fall and the Spring Semesters since Spring In fact, to keep up with the growth of our Computer Science program, we increased the Math 210 offerings to two sections per semester starting in Spring Recommendation b: (Increase Course Offerings-Other Courses) Also, it is recommended that at least two additional sections of Math 170, 180, and 190 and at least one additional section of Math 191, 220 and 270 be added to the schedule each semester. Status: Mostly Completed CM 1 Course Offerings M170 M180 M190 M191 M220 M270 Fall Spring Fall Spring The recommendation has been implemented for all courses except for Math 180, where the same number of sections were offered in Spring 2012 and Spring There is still room for growth, as will be discussed in the Section 2 under Scheduling of Classes. In Spring 2016, additional sections were scheduled, but had to be cancelled due to low enrollment, possibly because of times during which these sections were offered. Recommendation c: (Increase Course Offerings-Intermediate Algebra) Also, a significant increase in the number of Math 80 sections offered is recommended. (Curriculum) Status: In Progress. There has been a significant increase in the number of sections of Math 80 since However, we are nowhere near the level we were at in For background on this recommendation, see the Curriculum section. Recommendation : (Faculty Hiring) It is recommended that four more full-time tenure track professors be hired beyond our present count of forty. It is further recommended that CM1 courses be taught by full-time instructors only, when possible. (Staffing) Status: No Change. Currently there are 40 full-time math faculty. We have fluctuated between 38 and 41 over the past six years due to the cycle of retiring and hiring. We will recommend hiring several more fulltime faculty that are capable of teaching at all levels in the math department. Recommendation : (Technology) It is recommended that a long-range, sustainable plan to purchase and use the most up-to-date version of the software and hardware used in the courses in this program be implemented and that newer technologies be investigated for possible introduction to the CM1 Program. Additionally, classroom sets of graphing calculators and scientific calculators should be purchased. Status: In Progress. Graphing calculators have been purchased. This will be further discussed in the Technology section. 9
10 Recommendation : (Facilities) It is recommended that funding be provided for an expanded tutoring center. Perhaps some instructor office hours could take place there. Computers and a reserve desk, stocked with textbooks and calculators, should be added. Status: No Change. The math department moved into the new MBA building in Spring 2013 and got a new tutoring center in MBA 119. We will address new recommendations in the Facilities section. Recommendation : It is recommended that SI sections be funded for CM1 courses and that funding be increased for MESA workshops. Status: No change. Scheduling SI sections for STEM courses will be investigated further, since MESA has limited membership and resources. Recommendation : It is recommended that funding be increased for conferences and professional development. Status: No Change. There is still $200 available from the school and $700 available from the district these should still be raised. There was funding available from the HSI-STEM grant, but that has ended. Recommendation : (SLOs) It is recommended that we work to increase participation of faculty, both full-time and part-time, in the administration, reporting and analysis of SLOs. Additionally, we should continue to develop and review the SLO statements and assessments and update relevant course outlines on a regular basis. Status: In progress 10

 from 2011-12 to 2012-13.")


11 2. Analysis of Research Data a) Head count of students in the program Figure 1 shows that the number of students in the CM-1 Program has been steadily increasing, although there was a slight dip (less than a 2% decrease) from to The increase in the following years was more than 12% and 6%, respectively, which is significant. This trend is also reflected in Figure 2, demonstrating that student participation at the college has also behaved in a similar manner over this time period and is not something endemic only to math. Figure 1: CM1 Program Annual Headcount Figure 2: CM1 Program Annual Seat Count and Sections b) Course grade distribution (Are there some courses that stand out in one way or another in terms of grades?) 11


12 From Figures 3-6, we can see that: For all four consecutive academic years, through , Math 220 and 270 reported the top three percentages of A s. At the same time, these two courses saw the lowest percentages of withdrawals. We may conclude that those students who survived successfully from Math 190 through Math 220 were well prepared to end the calculus sequence in Math 270 strongly. The top three percentages of withdrawals for the four academic years occurred in Math 190 and 191. This may be a sign that some of our students that entered the calculus sequence were not sufficiently prepared at the previous levels or may have had a semester or more gap between taking the prerequisite courses and enrolling in Math 190 or 191. Even though Math 180 is a prerequisite for Math 190, much of the content in the course has been covered in various courses, from Math 40 up through Math 170. Despite all Math 190 instructors reviewing the prerequisite material at the beginning of the course, this may not be enough to mend the students lack of mastery of these materials. The percentage of A s for Math 170 and Math 180 rank near the bottom throughout all four academic years. This may be the reason why the percentage of withdrawals for Math 190 and 191 consistently rank highest, or almost so, over the same period of time, as these students may have understood the material well enough to advance beyond the current class but not enough to progress further. Figure 3: CM1 Program Grade Distribution

13 CM1 Math Grade Distribution % Percentage of Class 30.0% 25.0% 20.0% 15.0% 10.0% 5.0% 0.0% A B C D F Drop W Math 170 Math 180 Math 190 Math 191 Math 210 Math 220 Math 270 Figure 4: CM1 Program Grade Distribution CM1 Math Grade Distribution % Percentage of Class 30.0% 25.0% 20.0% 15.0% 10.0% 5.0% 0.0% A B C D F Drop W Math 170 Math 180 Math 190 Math 191 Math 210 Math 220 Math 270 Figure 5: CM1 Program Grade Distribution

14 CM1 Math Grade Distribution % 35.0% Percentage of Class 30.0% 25.0% 20.0% 15.0% 10.0% 5.0% 0.0% A B C D F Drop W Math 170 Math 180 Math 190 Math 191 Math 210 Math 220 Math 270 Figure 6: CM1 Program Grade Distribution
15 c) Success rates (Discuss your program s rates in light of the college s success rate standard. Set a standard for your program.) The college s preliminary success standard is set as 57.6%, a standard provided by the college. In Figure 7, if we compare Math 170 (Trigonometry) and Math 180 (Pre-Calculus), the two courses which lead into the calculus sequence, the annual success rate for Math 170 is 7.2% below standard, but Math 180 is slightly above by 2%. This may be due to Math 170 being one of the first courses for students beyond algebra that presents predominantly new material, whereas Math 180 is largely a review of content from previous courses, including Math 170. For the calculus sequence itself, Math 190 through 270, the annual success rate for Math 190 sits around 6.7% below standard but, for each successive course, the success rate is above the standard and climbs slowly to over a 77% success rate by the end of the sequence. CM1 Program Success Rates (Yearly) Course Success Rate MATH % 49.4% 50.7% 48.8% 50.4% MATH % 58.7% 58.8% 55.2% 59.6% MATH % 51.6% 51.8% 53.2% 51.9% MATH % 58.7% 55.9% 53.2% 57.8% MATH % 59.0% 64.7% 67.6% 66.1% MATH % 74.6% 74.1% 73.4% 73.6% MATH % 79.0% 72.3% 82.2% 77.4% Program Success Rate 60.5% 57.3% 56.8% 55.8% Figure 7: CM1 Yearly Success Rates 15
16 Figures 8 and 9 compare the success rates, by course, for each of the fall and spring semesters. For Math 210, 220, and 270, the success rates are consistently above the standard for both fall and spring. From the success rates for Math 170, 180, 190 and 191, it is apparent that a sizable percentage of students who are entering the calculus sequence are in need of better preparation to pass these courses. The addition of SI sections, workshops and pre-math 190 boot camps would be helpful to deal with this situation. CM1-College Level Math Program Success Rates Fall Terms Course Course Success Rate MATH % 53.0% 51.8% 48.8% 42.9% 49.8% MATH % 59.1% 63.5% 62.1% 56.9% 61.0% MATH % 52.8% 53.1% 54.4% 53.4% 52.7% MATH % 54.0% 57.1% 46.4% 56.3% 54.3% MATH % 63.9% 59.5% 60.0% MATH % 77.7% 72.2% 77.9% 71.9% 73.3% MATH % 75.9% 68.9% 81.5% 74.4% 74.7% PROGRAM SUCCESS 57.6% 58.1% 58.1% 56.9% 55.2% 57.2% RATE MATH DEPT SUCCESS 54.1% 54.6% 52.8% 54% 53% RATE COLLEGE SUCCESS RATE 67.3% 69.8% 68.2% 68% 68% Figure 8: CM1 Fall Success Rates CM1-College Level Math Program Success Rates Spring Terms Course Course Success Rate MATH % 45.4% 49.6% 48.8% 56.0% 50.0% MATH % 58.4% 53.1% 46.6% 53.7% 55.0% MATH % 50.7% 50.7% 51.9% 54.9% 51.2% MATH % 62.7% 54.8% 59.3% 59.6% 60.7% MATH % 59.0% 71.1% 71.1% 60.7% 67.0% MATH % 69.5% 75.6% 68.7% 72.5% 72.3% MATH % 82.1% 74.2% 82.7% 82.8% 78.0% PROGRAM SUCCESS 58.3% 56.5% 55.5% 54.7% 59.2% 56.8% RATE MATH DEPT SUCCESS 53.3% 56.3% 52.7% 54% 54% RATE COLLEGE SUCCESS RATE 68.1% 69.2% 67.9% 68% 70% Figure 9: CM1 Spring Success Rates 16
17 Success Rates by Gender Figures 10 and 11 demonstrate no appreciable difference in the success rate of CM1 math classes between the genders. Females had a higher rate of success in 5 of the 8 semesters studied, but the differences either way were very small with none exceeding 5%. However, the number of female students in STEM math class courses lags behind the number of males. The creation of workshops geared towards women would be useful, especially if they involved outside female speakers who have had success in the STEM field. We will work with the Computer Science Committee to search for other ideas to get more female students to show interest in STEM fields. We will also encourage more female students to participate in the AMATYC math contest. Demographic Success Characteristics by Gender Fall Semesters Fall 2011 Fall 2012 Fall 2013 Fall 2014 Gender N Success N Success N Success N Success Male % % % % Female % % % % Figure 10 Demographic Success Characteristics by Gender Spring Semesters Spring 2012 Spring 2013 Spring 2014 Spring 2015 Gender N Success N Success N Success N Success Male % % % % Female % % % % Figure 11 17
18 Success Rates by Ethnicity Figures 12 and 13 depict the demographic success characteristics by ethnicity. The highlighted sectors indicate areas of concern, namely groups that achieve a rate at less than 80% of the reference group. African-Americans and Latinos each fall into this category in 4 of the 8 semesters studied. Additionally, the success rates for these groups were significantly lower than the other two major groups, Asian and White, in the other four semesters. The school is attempting to address this equity issue with several special programs. In our program, we should do a better job of making all groups aware of the resources available to them, such as MESA and the tutoring center. We suggest increasing the funding for these programs, so that the capacity of MESA can be increased and more advanced tutors can be hired, in addition to a full-time tutoring coordinator. Additionally, SI sessions could be added to STEM courses and pre-stem boot camps could be scheduled. We could also look for grant money to hold special workshops, some featuring speakers of various ethnicities that have had success in the STEM math field, for these courses (The HSI-STEM grant did some of this in the year, but that funding ran out). Demographic Success Characteristics by Ethnicity Fall Semesters Fall 2011 Fall 2012 Fall 2013 Fall 2014 ETHNICITY N Success N Success N Success N Success African-American % % % % Amer. Ind /Alask. X 0% X 0% X 100.0% X 0% Native Asian % % % % Latino % % % % Pacific Islander X 25.0% X 60.0% X 80.0% X 60.0% Two or More % % % % Unknown or Decline % % % X 62.5% White % % % % X: Counts are suppressed for groups with less than 10 students. Shaded regions indicate groups achieving at a rate less than the 80% of the reference group Figure 12 Demographic Success Characteristics by Ethnicity Spring Semesters Spring 2012 Spring 2013 Spring 2014 Spring 2015 ETHNICITY N Success N Success N Success N Success African-American % % % % Amer. Ind /Alask. X 0% X 0% X 100% X 0% Native Asian % % % % Latino % % % % Pacific Islander X 50.0% X 66.7% X 66.7% X 75.0% Two or More % % % % Unknown or Decline % % % X 40.0% White % % % % Figure 13 18
19 d) Retention rates In Figures 14 and 15, the retention rates for CM1 courses are consistent with the overall rates for the math department. It is not surprising that the highest rates occur in courses such as Math 220 and 270, since the students who get to these courses are sufficiently prepared and ready, having run the gamut of previous courses in the calculus sequence. That the lowest retention rates occur in Math 190 and 191 is not surprising either these courses introduce students to many new ideas and at a higher level of rigor than they may be used to. The introduction of more resources, such as SI sessions, could potentially raise these retention rates. CM1-College Level Math Program Retention Rates Fall Terms Course Course Retention Rate MATH % 73.2% 73.8% 68.5% 73.2% 72.5% MATH % 78.8% 81.3% 83.1% 80.9% 81.2% MATH % 74.8% 71.5% 69.3% 70.4% 70.1% MATH % 65.3% 72.8% 62.3% 72.0% 69.2% MATH % 66.7% 73.0% 71.0% MATH % 88.4% 79.6% 81.7% 84.9% 82.8% MATH % 82.3% 82.4% 87.7% 91.5% 83.8% PROGRAM RETENTION 74.2% 75.5% 75.7% 73.1% 76.2% 74.9% RATE MATH DEPT RETENTION 75.5% 77.6% 76.1% 75% 76% RATE COLLEGE RETENTION RATE 81.8% 84.3% 83.1% 82% 83% Figure 14: CM1 Fall Retention Rates CM1-College Level Math Program Retention Rates Spring Terms Course Course Retention Rate MATH % 70.1% 75.3% 69.1% 74.8% 72.9% MATH % 80.5% 75.5% 70.6% 75.5% 75.9% MATH % 69.3% 71.6% 69.1% 74.2% 69.9% MATH % 77.6% 69.1% 76.1% 73.5% 75.8% MATH % 69.2% 84.2% 76.3% 65.6% 75.8% MATH % 78.0% 84.7% 79.8% 82.4% 82.4% MATH % 88.5% 89.2% 91.3% 90.5% 88.4% PROGRAM 75.3% 75.1% 75.3% 72.9% 76.0% 74.9% RETENTION RATE MATH DEPT 74.7% 76.7% 76.1% 74% 74% RETENTION RATE COLLEGE RETENTION RATE 82.0% 82.8% 83.0% 81% 83% Figure 15: CM1 Spring Retention Rates e) A comparison of success and retention rates in face-to-face classes with distance education classes. 19
20 There are no CM1 distance education classes. f) Enrollment statistics with section and seat counts and fill rates. Figure 16 shows the section counts for each CM1 course, by semester, since the last program review. There is a gradual increase in section offerings for each course, which was one of the recommendations from the last program review. CM1 Program Section Counts: Fall 2011-Spring 2016 M170 M180 M190 M191 M210 M220 M270 Total F W S Sum F W S Sum F S Sum F S Sum F S Totals Figure 16 CM1 Section Counts Figure 17 shows students enrolled in each course by semester since the last program review. Just as there was a gradual increase in the number of sections offered, there is a commensurate increase in enrollees. CM1 Program Seat Counts: Fall 2011-Spring 2016 M170 M180 M190 M191 M210 M220 M270 Total F W S Sum F W S Sum F S Sum F S Sum F S
21 Totals Figure 17 CM1 Seat Counts Figure 18 shows the overall CM1 fill rates for the fall semesters from While there was a slight decline, this is not a problem since the rates are all well over 100%. This decline could be attributed to the increase in the number of sections. When there were too few sections, the classes were often filled to the maximum capacity of each room in an effort to meet the needs of the students. However, the higher studentteacher ratio that a 110% fill rate generates is not as conducive to student learning as a properly-sized class. Percent of Seats Filled 120% 110% 100% 90% 80% 70% 60% 50% 40% 30% 20% Fall Section Fill Rates 110% 106.5% 105% 103.6% Figure 18 CM1 Fill Rates Fall Semesters Figure 19 shows the overall CM1 fill rates for the spring semesters from A similar downward trend is evident, but the fill rates still hover near 100%. Percent of Seats Filled 120% 110% 100% 90% 80% 70% 60% 50% 40% 30% 20% Spring 105.8% Section Fill Rates 108.8% 97.1% 96.3% Figure 19 CM1 Fill Rates Spring Semesters 21
22 Figure 20 shows the fill rates for all CM1 courses during all semesters since the last program review. The overall fill rate for the 497 course sections offered from Fall 2011 to Spring 2016 is 101.6%. A majority of CM1 courses had fill rates over 100%. There were only two times that the fill rates dipped below 80%: both were for Math 220 in Spring 2014 and Spring 2015 when there was possibly one too many sections offered that semester. However, that was not a problem in Spring 2016 when the Math 220 fill rate rebounded to 109.3%. CM1 Program Fill Rates: Fall 2011-Spring 2016 M170 M180 M190 M191 M210 M220 M270 Total F % 111.4% 109.3% 107.6% % 104.3% 110.0% W % % S % 105.4% 108.6% 91.8% 105.7% 110.0% 112.9% 103.0% Sum % 107.1% 101.9% 92.9% % % F % 103.2% 107.5% 96.2% % 112.9% 104.8% W % % S % 107.6% 108.9% 98.4% 111.4% 117.1% 111.4% 107.6% Sum % 82.9% 108.6% 104.8% % % F % 102.6% 112.4% 91.4% 85.7% 102.9% 105.7% 104.8% S % 90.8% 106.0% 93.9% 108.6% 74.9% 88.6% 97.1% Sum % 80.0% 100.7% 89.5% % % F % 102.9% 99.7% 102.9% 102.9% 99.0% 115.7% 103.6% S % 101.6% 96.3% 100.0% 108.6% 70.7% 99.0% 98.5% Sum % 89.7% 85.7% 107.6% % % F % 106.0% 104.3% 109.4% 105.7% 104.3% 78.1% 103.9% S % 96.9% 100.8% 92.9% 87.1% 109.3% 82.9% 97.6% Totals 104.8% 100.8% 104.1% 98.4% 100.3% 96.4% 98.2% 101.6% Figure 20 CM1 Fill Rates for all courses and semesters 22
23 g) Scheduling of courses (day vs. night, days offered, and sequence offered, and sequence) Figures 21 and 22 show the enrollment by time of day. Approximately 80% of the enrollment is during the day and 20% is during the evening. Enrollment by Time of Day Fall Fall Term Day 78.1% 78.5% 80.7% 82.8% Night 21.9% 21.5% 19.3% 17.2% Weekend/Unknown 0.0% 0.0% 0.0% 0.0% Figure 21 Enrollment by Time of Day-Spring Spring Term Day 80.5% 82.5% 74.3% 76.4% Night 19.5% 17.5% 25.7% 23.6% Weekend/Unknown 0.0% 0.0% 0.0% 0.0% Figure 22 The evening is vastly underutilized and, because of this, there is great potential for growth by adding more sections of the CM1 courses during these hours. Figure 23 makes a comparison with the evening program at Santa Monica College during the Fall 2015 semester. Santa Monica offered twice as many evening sections as El Camino. Additionally, Santa Monica s average head count was 39.8, while El Camino s was only 33.6, so they served about 2.4 times as many evening students as us. Night Class Comparison Fall 2015 Classes After 4:30pm Santa Monica College El Camino College Sections Students Sections Students Math Math Math Math Math Math Math Math Math Math Math Math Math Math Totals Figure 23 The suggestion is not to redirect resources from elsewhere. We see no need to decrease the offerings during the day. We believe that new resources should be directed to the evening program. This could benefit other STEM programs, such as Computer Science, which have many late afternoon and evening classes. It might take some advertising to get the word out that our night program can be counted on to reliably continue from semester to semester. With the aging population of the area, we may need to increase evening offerings to help older students who are coming from work. Also, now that we are synced with the Santa Monica College Spring Semester, we may be able to absorb some of their overflow. 23
24 If there are only three or four total sections of a course, such as Math 220 or Math 270, we recommend that only one section be scheduled at night. It s better to have them distributed throughout the day with one or two in the morning, one or two in the afternoon and one in the evening. This recommendation may change if we are successful in getting the word out and growing the evening program. h) Improvement rates (if applicable) All of the courses in CM1, except for Math 210, form a sequence: Math 170, 180, 190, 191, 220, 270. Figures 24 and 25 show the success rates for the 6 courses in the sequence over four years in the fall and the spring. Our program has a very high set of standards for our students in order to meet the requirements of the four-year universities. This manifests itself in fairly low success rates at the beginning of the sequence, but there is big improvement for those students who master the concepts of the earlier courses and make it to the later ones. CM1 Program Success Rates - FALL TERMS Course Course Success Rate MATH % 51.8% 48.8% 42.9% 49.1% MATH % 63.5% 62.1% 56.9% 60.4% MATH % 53.1% 54.4% 53.4% 53.4% MATH % 57.1% 46.4% 56.3% 56.0% MATH % 72.2% 77.9% 71.9% 74.9% MATH % 68.9% 81.5% 74.4% 75.2% Figure 24 CM1 Program Success Rates SPRING TERMS Course Course Success Rate MATH % 49.6% 48.8% 56.0% 50.0% MATH % 53.1% 46.6% 53.7% 53.0% MATH % 50.7% 51.9% 54.9% 52.1% MATH % 54.8% 59.3% 59.6% 59.1% MATH % 75.6% 68.7% 72.5% 71.6% MATH % 74.2% 82.7% 82.8% 80.5% Figure 25 24
25 i) Additional data compiled by faculty AMATYC Math Contest The American Math Association of Two-Year Colleges (AMATYC) Student Math League (SML) competition is the only national math contest for students enrolled in a two-year college. The competition consists of two one-hour exams: one in fall and one in spring. The contest is free for students and all enrolled students are encouraged to participate, especially those that have progressed to Math 170 (Trigonometry) and beyond. Last year, more than 190 colleges and over 8000 students participated in the contest nationally. The top five scores at each school make up the team score. The school with the highest score is eligible for a team award. The El Camino team has done well nationally over the past few years. Fall Placement Spring Placement Overall Placement th 14th 20th th 7th 5th th 12th 10th th 18th 13th th 12th 8th Five or six faculty members help run the practices and proctor the exams. We recommend funding for the running of the practice workshops and proctoring the exams. There would be 16 practices each semester, each requiring one hour of prep time. Six proctors are needed on the exam day. The cost per semester is $3000. The CM1 Committee is planning to do a study that tracks how students who participate in the math contest do in their courses, including a look at majors and if there is any change in majors due to participation. Winter Semester The CM1 Committee supported the return of Winter Semester and the introduction of five unit courses to the Winter schedule. However, we recommend that the Winter Semester be extended by four days. The current Winter 2017 semester starts on Thursday, January 5 th and ends on Tuesday, February 7 th for 23 days of instruction. That forces us to schedule a 5 unit class over a 3 hour and 50 minute block. If four days are added by having the Winter start on Tuesday, January 3 rd and end on Thursday, February 9 th, then a 5 unit class could be scheduled into blocks of closer to 3 hours, which would be much less imposing and better for student learning. Additionally, the Spring Flex day, which is only a morning session, could be moved to Friday, February 10 th. While it might not be feasible to change the 2017 schedule we hope that some changes could be instituted for
26 j) List any related recommendations. 1) We recommend that Review Workshops be funded for CM1 classes. One possibility is to offer a review workshop for students who are entering Math 190/Math 191 since these traditionally have lower success rates. These might work like the current Summer Academy and could perhaps be offered in the Summer or Winter Semesters (Cost: ) 2) We recommend an increase in Supplemental Instruction (SI) funding so that more Math 80 sections could be covered and we could introduce the program to Math 170 and Math 180. (Cost: $2000 per section per semester) 3) We recommend the addition of boot camps prior to Math 190 be created and scheduled. (Cost: $6000 per boot camp) 4) We recommend the funding of math contest practices and proctoring (Cost: $3000 per semester). 5) We recommend the scheduling of more CM1 math classes in the evening. Advertising would be crucial to making the community aware of a growing evening STEM program (Cost per 5 unit section $10,500). 6) We recommend that the Winter Semester be extended by four days. This would not affect the start of Spring Semester. It would only require a shift of the Spring Flex day to the Friday morning before the start of Spring Semester. (Cost: none) 26
27 3. Curriculum a) Provide the curriculum course review timeline to ensure all courses are reviewed at least once every 6 years. There are currently six courses in the College Math for STEM majors program, referred to as CM1 in the math department. During the past four years, all of the courses have been reviewed. We have aligned courses with the C ID, when our courses matched the approved C ID descriptors. To date, there is not a matching C ID descriptor for Math 210, and since our course already articulates with courses taught at both CSU and UC schools, we have maintained the same course outline. Here is the six year review cycle, including when the courses were last reviewed, and when we plan to review Course Math - Major Courses Last Course Review them in the future. FA 15 YEAR 1 YEAR 2 YEAR 3 YEAR 4 YEAR 5 YEAR 6 SP 16 FA 16 SP 17 FA 17 SP 18 FA 18 SP 19 FA 19 SP 20 May, 2012 P P P P MATH X MATH X MATH X MATH X MATH X MATH X MATH X FA 20 SP 21 Note: All courses are 5 units, except for Math 170 (3 units) and Math 210 (4 units) 27
28 b) Explain any course additions to current course offerings. Intermediate Algebra Math 80 the Prerequisite for CM1 Prior to Fall 2009, there were over 100 sections of Math 80 (known as Math 70 until Fall 2009) offered each year. This intermediate algebra course, equivalent to high school Algebra II, was the only intermediate algebra course available, and was the main prerequisite for Math 170, the first of the CM1 courses. There were 55 sections of this course in Fall However, in the Fall 2009 semester, Math 80 was drastically reduced to 9 sections. A new intermediate algebra course, Math 73 (Intermediate Algebra for General Education), was offered with 37 sections, but this course was not designed to prepare students for CM1 courses. The creation of Math 73 was in response to California s change in the Title 5 regulations regarding associate degrees. The new guidelines raised the requirements from Elementary Algebra to Intermediate Algebra. This new course, the creation of which was not brought to a vote by the math department, removed many topics and was not deemed by the CM1 Committee to be appropriate preparation for CM1 courses. Another intermediate algebra course, Math 67, appeared in 2012, but this was designed as a pre-statistics course. The disparity in section offerings between Math 80 and Math 73 continued in the subsequent years. The drastic decrease in the number of Math 80 course sections was of serious concern because it choked off the main access point for students to the CM1 courses, which form the backbone of a solid education in the sciences and math. With math- and science-related fields becoming an increasingly important part of the country s economy, we must ensure that students have sufficient access to the pipeline of CM1 courses that leads to these fields. At the time of the last CM1 Program Review in 2011, the access to STEM courses was severely curtailed. In just two short years, the administration reduced the percentage of students taking Math 80 from 100% down to 22.4% (see Figure 1 below). This was not an issue of decreased demand the fill rates for these courses routinely exceed 100% (see Figure 2 below). 28
29 Intermediate Algebra Section Offerings and Head Counts MATH 80 MATH 73 MATH 67 Percent Sections Students Sections Students Sections Students Taking M % % % % % % % % Spring % Sum Fall % Figure 1 Math 80 Fill Rates Fill Rate 97.8% 106.5% 107.5% 104.4% 104.2% Figure 2 Many faculty were shocked by this drastic decrease so, in 2011, we recommended an increase in Math 80 sections. This recommendation was heeded and, as a result, was steadily implemented over the next few years. Progress has been made, but we feel that a higher percentage of intermediate algebra offerings should be at the Math 80 level. To accommodate this, the need for alternative intermediate algebra courses can be lessened by providing more resources to students in Math 80. This would create more equity among students, especially in cases where students may not have access to sufficient resources outside of the classroom or had inadequate training in previous math courses. In turn, this would enable all students the opportunity to succeed in the course. A starting point would be Supplemental Instruction (SI) being available for every section. Along with SI, review workshops should be funded and scheduled to help students perform to the best of their ability in the course. We will seek out grant money and SEP funds to fund these workshops. One concern is that students coming from underrepresented groups, that may have mitigating factors affecting their performance in college, could be directed to these less rigorous versions of Intermediate Algebra and they could unknowingly end up limiting their future options because of it. Since Math 80 provides students with the widest range of directions, as it satisfies the prerequisite for every subsequent math course, it should be amply available to students as well as the most supported intermediate algebra course. In contrast, Math 67 and Math 73, which have far less rigor and depth of content than Math 80, satisfy the prerequisites of very few subsequent math courses. If students from backgrounds where their previous education in math may have been compromised are steered toward the Math 67 or Math 73 track, then it seems likely that when we do equity statistics in a few years, we will see a grave disparity in the makeup of students enrolled in Math 80 versus these alternatives. 29
30 The problem with having multiple courses at the intermediate algebra level, and the fallout from it, has already started to negatively impact students who may not have known which was the best option for them or chose Math 67 or 73 because there were not adequate sections of Math 80 available. Case in point, a challenge exam for Math 80 has been created this year for those students who take Math 73 and later realize that they need Math 80 as a prerequisite for another class. Many CM1 members do not consider this to be a practical solution. The best thing for students is to learn how to handle Math 80 in real time this will prepare them for the courses to follow, both in math and related fields. Otherwise, they may be unused to and unable to quickly adjust to the workload that is expected when they reach Math 170 or 180. The success rate for Math 70 in Fall 2008 was 51.4%. In comparison, the success rate for Math 80 (equivalent to Math 70) in Fall 2015 was 53% and for Math 73 was 51%. Therefore, it seems reasonable to believe that many of the students that succeeded in Math 73 could have done well in Math 80 if they had been given some extra resources to help them. Additionally, the fill rate as of the September 9, 2016 census date for Math 80 was 106.5%. The sections were overfilled by over 100 students. There is huge demand for this course. In contrast the fill rate for Math 73 was 100.4% and for Math 67 was 77.8%. We recommend that more sections of Math 80 be added, either by shifting from Math 67 and 73 or by increasing the overall number of intermediate algebra sections. Also, support for Math 80 should be increased by increasing the funding of the Math Study Center, increasing the number of sections being supported by Supplemental Instruction, and by offering special review workshops throughout the semester. Each Supplemental Instruction coach is paid $11 per hour and works 11 hours per week, so the cost is about $2000 per semester per section, including administrative costs. 30
31 Trigonometry and Precalculus The CM1 Committee has been investigating various ways to redesign the Math 170 (Trigonometry, 3 units) and 180 (Precalculus, 5 units) sequence that is the prelude to all later STEM courses. One of the flaws in the current design of the sequence is that Math 180 contains a good deal of material from Intermediate Algebra (Math 80) and Trigonometry (Math 170) that is simply reviewed, but not extended. Our considerations have to take into account articulation and the state C-ID. These are the major redesigns that we have considered: 1. Add material to Math 170 and increase it to 4 units. Change parts of Math 180 so that a more integrated approach is taken, rather than just reviewing disparate topics from previous courses. 2. Redesign both courses and integrate trigonometry throughout by covering the first half of trigonometry in Math 170 and the second half in Math 180. Also, spread the other topics throughout both. 3. Create two new courses, perhaps calling them Analysis I and II (this is done at Pasadena City College and CSU Long Beach), where trigonometry is the main topic of one of the courses and every other precalculus topic is the focus of the other course. Other logistics of such a change would need to be considered, such as whether we would allow them to be taken concurrently. The CM1 Committee will continue to explore the potential of such changes by studying what other schools are doing. However, we do not think that the two courses should be combined into one course. Santa Monica College is in the process of splitting their one semester precalculus course into two separate courses. We will keep an eye on that situation. An experimental sequence was started in the academic year called Gateways to Engineering. It is intended for engineering and other STEM majors who are at the intermediate algebra level. In the fall, the students enroll in both Intermediate Algebra (Math 80) and Geometry (Math 60). In the spring, they enroll in both Trigonometry (Math 170) and Precalculus (Math 180). The goal is for these students to be able to enroll in Calculus I (Math 190) after only one year. While Math 80 and Math 60 are not part of CM1, the students who enroll in these courses are typically planning to complete the calculus sequence and major in a STEM field. Please see Appendix C for more detailed information. 31
32 c) Explain any course deletions and inactivations from current course offerings. No courses have been deleted or inactivated. d) Describe the courses and number of sections offered in distance education. (Distance education includes hybrid classes.) No distance education courses are offered. Currently, CM1 has no plans to create distance education courses. We believe students are better served at this level by substantial contact with professors and fellow students in a classroom several times a week. e) Discuss how well the courses, degrees, or certificates meeting students transfer or career training needs. 1. Have all courses that are required for your program s degrees and certificates been offered during the last two years? If not, has the program established a course offering cycle? Yes, all courses that are required have been offered in the last two years. All required courses are now offered every spring and fall semester. Most are also available in the summer semester. During Winter 2017 we are piloting several STEM math courses (Math 180, 190, and 191) that were not taught in previous winter sessions. 2. Are there any concerns regarding program courses and their articulation? All our courses articulate with our main transfer schools. Math 210 (Discrete Math) does not receive credit from UC Berkeley. It does not completely match the C-ID, because there are two vastly different C-IDs in existence for Discrete Math. We should add a few topics which will also require adding one unit. We will explore this over the next year. Math 270 (Differential Equations and Linear Algebra) does not receive credit for both Linear Algebra and Differential Equations at many schools in the UC and Cal State system. We will investigate the feasibility of splitting it into two separate courses. We will investigate what other community colleges are doing, what is required in the C-IDs, and the articulation ramifications. We must also make sure we have faculty who are willing and able to teach these advanced classes. Finally, in order to maintain high standards and the integrity of the program we must ensure that future hires have the ability to handle most of the CM1 math courses. 32
33 3. How many students earn degrees and/or certificates in your program? Do students take licensure exams? If so, what is the pass rate? If few students receive degrees or certificates or if few students pass the licensure exam, should the program s criteria or courses be reexamined? Set an attainable, measurable goal for future degrees, certificates, and/or licensure pass rates. A.S. Degrees in Math Awarded The number of degrees awarded is fairly small, but this is to be expected since most students who are taking the STEM sequence are seeking degrees in other areas, such as Computer Science, Engineering or the Natural Sciences. Our students do not take any licensure exams. f) List any related recommendations. 1. We recommend a shift in the distribution of Intermediate Algebra courses so that at least 75% of students are enrolled in Math 80. This would involve a shifting of sections from Math 67 and Math 73 (Cost: none). 2. We recommend an increase in Supplemental Instruction availability to Math 80 (Cost: $2000 per section per semester). 3. We recommend the introduction of Supplemental Instruction to Math 170 and 180 (cost: $2000 per section per semester). 4. We recommend an increase in funding to MESA so that they can expand student access. 5. We recommend that a unit be added to Trigonometry, Math 170, with the commensurate addition of some topics (Cost:). 6. We recommend that Math 80 be moved to the CM1 Committee (Cost: none). 33
34 4. Assessment and Student Learning Outcomes (SLOs) a. Provide a copy of your alignment grid, which shows how course, program, and institutional learning outcomes are aligned. MATHEMATICAL SCIENCES Institutional (ILO), Program (PLO), and Course (SLO) Alignment Program: Math (Math and Science Majors) ILOs 1. Critical Thinking Students apply critical, creative and analytical skills to identify and solve problems, analyze information, synthesize and evaluate ideas, and transform existing ideas into new forms. 2. Communication Students effectively communicate with and respond to varied audiences in written, spoken or signed, and artistic forms. Number of Courses: 7 Date Updated: Community and Personal Development Students are productive and engaged members of society, demonstrating personal responsibility, and community and social awareness through their engagement in campus programs and services. 4. Information Literacy Students determine an information need and use various media and formats to develop a research strategy and locate, evaluate, document, and use information to accomplish a specific purpose. Students demonstrate an understanding of the legal, social, and ethical aspects related to information use. SLO-PLO-ILO ALIGNMENT NOTES: Mark boxes with an X if: SLO/PLO is a major focus or an important part of the course/program; direct instruction or some direct instruction is provided; students are evaluated multiple times (and possibly in various ways) throughout the course or are evaluated on the concepts once or twice within the course. PLOs PLO to ILO Alignment (Mark with an PLO #1 Understanding Concepts Students will explain and demonstrate mathematical concepts relevant to the course content. PLO #2 Solving Problems Students will solve problems, including application problems, relevant to the course concepts and content. PLO #3 Graphs Students will create, interpret and analyze graphs relevant to the course concepts and content. PLO #4 Proofs Students will analyze and construct proofs relevant to the course concepts and content. X X X X X X X X X X X X X 34
35 SLOs MATH 170 Trigonometry: SLO #1 Understanding Concepts Students will explain and demonstrate basic trigonometric concepts and definitions. MATH 170 Trigonometry: SLO #2 Solving Problems Students will solve trigonometric application problems, including those involving the laws of sines and cosines. MATH 170 Trigonometry: SLO #3 Graphs Students will create, interpret and analyze the graphs of trigonometric functions and their inverses. MATH 170 Trigonometry: SLO #4 Proofs Students will analyze and construct proofs of trigonometric identities. MATH 180 Pre-Calculus: SLO #1 Understanding Concepts Students will explain and demonstrate basic precalculus concepts by solving equations, inequalities and systems involving algebraic, exponential, logarithmic, trigonometric, and absolute value expressions. MATH 180 Pre-Calculus: SLO #2 Solving Problems Students will use polynomial, rational, exponential, logarithmic, and trigonometric equations and functions to set up and solve application and modeling problems. MATH 180 Pre-Calculus: SLO #3 Graphs Students will create, interpret and analyze the graphs of polynomial, rational, exponential, logarithmic, trigonometric, parametric, polar and conic equations. MATH 180 Pre-Calculus: SLO #4 Proofs Students will analyze and construct proofs, including proofs by induction. MATH 190 Single Variable Calculus and Analytical Geometry I: SLO #1 Understanding Concepts Students will explain and demonstrate the idea of the limit, the derivative and the integral. MATH 190 Single Variable Calculus and Analytical Geometry I: SLO #2 Solving Problems Solve problems, including problems involving velocity and acceleration, by using derivatives and integrals. MATH 190 Single Variable Calculus and Analytical Geometry I: SLO #3 Graphs Students will use techniques of calculus to determine maxima, minima, and points of inflection on the graph of a function. MATH 190 Single Variable Calculus and Analytical Geometry I: SLO #4 Proofs Students will analyze and construct proofs involving limits, derivatives, and integrals. SLO to PLO Alignment SLO to ILO Alignment P1 P2 P3 P X X X X X X X X X X X X X X X X X X X X X X X X X X X X X X X X X X X X X X X X X X X X X X X X X X X X X X X X X X X X X X X 35
36 SLOs MATH 191 Single Variable Calculus and Analytical Geometry II: SLO #1 Understanding Concepts Students will explain and demonstrate advanced integration techniques and convergence of sequences and series. MATH 191 Single Variable Calculus and Analytical Geometry II: SLO #2 Solving Problems Students will use integrals to evaluate volumes, surface area and arc length. MATH 191 Single Variable Calculus and Analytical Geometry II: SLO #3 Graphs Students will use limits, derivatives and integration to analyze graphs of parametric equations, polar equations, and conic sections. MATH 191 Single Variable Calculus and Analytical Geometry II: SLO #4 Proofs Students will analyze and construct proofs to determine convergence and divergence of sequences and series. MATH 210 Introduction to Discrete Structures: SLO #1 Understanding Concepts Students will explain and demonstrate an understanding of the key principles of logic, number theory, combinatorics, probability and graph theory. MATH 210 Introduction to Discrete Structures: SLO #2 Solving Problems Students will use logic, functions, number theory, and combinatorics to solve a variety of problems, including application problems and computer science algorithm analysis. MATH 210 Introduction to Discrete Structures: SLO #3 Graphs Students will analyze and solve problems in graph theory. MATH 210 Introduction to Discrete Structures: SLO #4 Proofs Students will analyze and construct proofs in logic, number theory, combinatorics, probability and graph theory. MATH 220 Multi-Variable Calculus: SLO #1 Understanding Concepts Students will explain and demonstrate partial derivatives, multiple integrals and the major theorems of vector calculus. MATH 220 Multi-Variable Calculus: SLO #2 Solving Problems Students will calculate partial derivatives for a function of more than one variable and use them to solve multivariable optimization problems; and evaluate double and triple integrals, and apply them to physical problems such as moments and centers of mass. MATH 220 Multi-Variable Calculus: SLO #3 Graphs Students will analyze the graphs and equations of curves and surfaces in three-dimensional space, as well as vector fields. MATH 220 Multi-Variable Calculus: SLO #4 Proofs Students will analyze and apply Green s, Stokes, and Gauss Theorems. MATH 270 Differential Equations with Linear Algebra: SLO #1 Understanding Concepts Students will explain and demonstrate the key concepts of linear algebra, including determinants, vector spaces and linear transformations. MATH 270 Differential Equations with Linear Algebra: SLO #2 Solving Problems Students will use differential equations and linear algebra to solve a variety of problems, including application problems. SLO to PLO Alignment SLO to ILO Alignment P1 P2 P3 P X X X X X X X X X X X X X X X X X X X X X X X X X X X X X X X X X X X X X X X X X X X X X X X X X X X X X X X X X X X X X X X X X X X X X X X X X X X X 36
37 SLOs MATH 270 Differential Equations with Linear Algebra: SLO #3 Graphs Students will use graphical techniques to solve differential equations or systems of differential equations. MATH 270 Differential Equations with Linear Algebra: SLO #4 Proofs Students will analyze and construct proofs relevant to differential equations and linear algebra. SLO to PLO Alignment SLO to ILO Alignment P1 P2 P3 P X X X X X X X X X X X X 37
38 b. Provide a timeline for your course and program level SLO assessments. SLO and PLO Assessment Timeline Division: Math Program: Math for Engineering, Science and Math Students Program Review Date: SP15/FA15 Semester and Year SLO to be Assessed Include the SLO# and Short Title PLO to be Assessed Include the PLO# and Short Title Spring 2014 Summer 2014 (If applicable) Fall 2014 Math 170 SLO #1 - Understanding Concepts Math 180 SLO #1 - Understanding Concepts Math 190 SLO #1 - Understanding Concepts Math 191 SLO #1 - Understanding Concepts Math 210 SLO #1 - Understanding Concepts Math 220 SLO #1 - Understanding Concepts Math 270 SLO #1 - Understanding Concepts PLO #1: Students will explain and demonstrate mathematical concepts relevant to the course content. Spring 2015 Summer 2015 (if applicable) Fall 2015 Spring 2016 Math 170 SLO #2 Solving Problems Math 180 SLO #2 Solving Problems Math 190 SLO #2 Solving Problems Math 191 SLO #2 Solving Problems Math 210 SLO #2 Solving Problems Math 220 SLO #2 Solving Problems Math 270 SLO #2 Solving Problems PLO #2: Students will solve problems, including application problems, relevant to the course concepts and content. Summer 2016 (If applicable) 38
39 Fall 2016 Math 170 SLO #3 Graphs Math 180 SLO #3 Graphs Math 190 SLO #3 Graphs Math 191 SLO #3 Graphs Math 210 SLO #3 Graphs Math 220 SLO #3 Graphs Math 270 SLO #3 Graphs PLO #3: Students will create, interpret and analyze graphs relevant to the course concepts and content. Spring 2017 Summer 2017 (If applicable) Fall 2017 Math 170 SLO #4 Proofs Math 180 SLO #4 Proofs Math 190 SLO #4 Proofs Math 191 SLO #4 Proofs Math 210 SLO #4 Proofs Math 220 SLO #4 Proofs Math 270 SLO #4 Proofs PLO #4: Students will analyze and construct proofs relevant to the course concepts and content. c. State the percent of course and program SLO statements that have been assessed. Division % of Courses With At Least One Assessment by end of Spring 2012 % of Courses With At Least One Assessment by end of Fall 2012 % of Courses With At Least One Assessment by end of Spring 2013 % of Courses With At Least One Assessment by end of Fall 2013 % of Courses With At Least One Assessment by end of Fall 2014 % of Courses With At Least One Assessment by end of Fall 2015 Mathematics 100% 100% 100% 100% 100% 100% 39
40 d) Summary of SLO and PLO assessment results over the past four years for CM1 Math 170, 180, 190, 191, 210, 220, 270 from Spring Fall 2015 CM1 Summary of SLO Success Rates from Spring to Fall Spring Fall Spring Fall Spring Fall Spring Fall Math- 170 Math- 180 Math- 190 Math- 191 Math- 210 Math- 220 Math % 68.8% 59% % % 77% 73.4% 76% 75.6% % % 77% 89% 79% % % 82% 78% 80.3% % % 87% % % % 88.9% 88.5% 87.9% 87.4% % % 84% 83% 73% % % SLO Assessment and Analysis (organized by course) SLO Assessment Summary - Math Trigonometry Term SLO Number SLO Statement Score 3 Score 2 Score 1 Score 0 Success Rate (scoring 2 or 3) Spring 2012 SLO #1 (formerly SLO #5) Students will find the unknown side(s) and angle(s) of triangles. 68.0% (120) 18.0% (32) 14.0% (24) 86.0% Fall 2012 SLO #2 (formerly SLO # 6) Students will use trigonometry to work with vectors and complex numbers. 49.4% (84) 19.4% (33) 31.2% (53) 68.8% Spring 2013 SLO #4 Prove Trigonometric Identities - Students will prove trigonometric identities. 50.0% (33) 9.0% (6) 41.0% (27) 59.0% Fall 2014 SLO #1 (formerly SLO #5) Understanding Concepts - Students will explain and demonstrate basic trigonometric concepts and definitions. 74.0% (157) 10.0% (22) 9.0% (19) 7.0% (16) 84.0% 40
41 Fall 2015 SLO #2 Solving Problems - Students will solve trigonometric applications problems, including those involving the laws of sines and cosines. 53.0% (127) 22.0% (53) 14.0% (33) 11.0% (28) 75.0% Math Summary of Analysis and Actions: Overall, we see very strong success rates ranging from 68%-86% (being defined as students earning a 2 or a 3 on the SLO assessments for the term). In Fall 2012, instructors commented that students seemed to have consistent practice with trigonometric application problems, in particular involving law of sines and cosines. In the future, more practice for the students will continue to raise success rates. We continue to encourage students to attend instructor office hours, arrange study groups, and complete similar problems to increase understanding. In Spring 2013, it was recommended by instructors to increase the number of units for Math 170 from 3 to 4 so we may fully explore the depth of trigonometry and better prepare students for STEM Precalculus. Since we observed an 84% success rate, increasing the rigor of such application problems being assessed will be effective in analyzing what our students understand. In Fall 2015, we saw good results assessing students ability to analyze an application problem using trigonometry. Techniques that seem to help include training students to sketch appropriate diagrams and having students work on exercises collaboratively and on the board. To improve these results, we will continue to suggest instructors emphasize conceptual understanding of the mathematical ideas as well as the computational procedures. Important terminology such as angle of depression or angle of elevation cannot be treated lightly. These terms in conjunction with application problems will help our students improve their performance. As an action, we would like to follow up with trigonometry problems that utilize different skill sets and/or increase the rigor of the problem being assessed. Term SLO Number Spring 2012 SLO #1 Fall 2012 SLO #2 Spring 2013 SLO #1 (formerly SLO #7) Fall 2013 SLO #4 Fall 2014 SLO #1 SLO Assessment Summary - Math Precalculus SLO Statement Score 3 Score 2 Score 1 Score 0 Students will find zeros of polynomial functions by factoring polynomials using polynomial division and the factor theorem. Students will solve algebraic, exponential, logarithmic, trigonometric, absolute value equations, and systems of equations using matrices. Students will solve quadratic and rational inequalities and inequalities with absolute value. Proofs - Students will analyze and construct proofs, including proofs by induction. Understanding concepts - Students will explain and % (159) 44.3% (90) 44.6% (90) 47.6% (121) 47.0% (158) 17.0% (29) 29.1% (59) 31.2% (63) 28.0% (71) 36.0% (120) 23.0% (41) 26.6% (54) 24.2% (49) 24.4% (62) 9.0% (30) 8.0% (26) Success Rate (scoring 2 or 3) 77.0% 73.4% 75.8% 75.6% 83.0%
42 Fall 2015 SLO #2 demonstrate basic pre-calculus concepts by solving equations, inequalities and systems involving algebraic, exponential, logarithmic, trigonometric, and absolute value expressions. Solving Problems - Students will use polynomial, rational, exponential, logarithmic, and trigonometric equations and functions to set up and solve application and modeling problems. 58.8% (134) 18.4% (42) 9.2% (21) 13.5% (31) 77.2% Math Summary of Analysis and Actions: Overall, we see very strong success rates ranging from the low-70% to mid-80%. In Spring 2012, 79% of the students successfully acquired the skill of determining zeroes of a higher degree polynomial function. Since this is an acceptable success percentage, only minor modifications are planned in teaching this skill in the future. The results were actually better than overall test scores. Students practiced solving this type of problem both in class and on homework. In Fall 2012, instructors all agreed that students struggled with problems involving radicals and fractions. We have assumed that students have been exposed to those problems for three consecutive semesters prior to this course, but the outcome was not great. We believe that periodical reviews using activities and/or quizzes on fractions and radicals will help to increase retention. Although many students understood the concept of logarithmic equations, some of them still had difficulty solving the equations because they forgot to use the properties of logarithm. In addition, we think that we could increase the success rate by spending more time on the inverse trigonometric functions and trigonometric functions in general. After many discussions among faculty members, we decided to give cumulative exams so that students do not forget what they learned at the beginning of the semester. In Spring 2013, instructors commented that the most common error when solving quadratic inequalities occurs when students solved them as if they were equations, so they did not test the correct intervals. As a suggestion, instructors should provide more in-depth examples and homework assignments, with extra emphasis given to the distinction between solving a quadratic equation and a quadratic inequality. In Fall 2014, instructors commented that the students again performed well in finding the zeros of polynomial functions. Next time, we want to increase the rigor of the SLO by using harder functions such as trigonometric, logarithmical or exponential. We will try to continue having students work in class on these problems, give supplemental handouts, and hold more review sessions before the exams. Term SLO Assessment Summary - Math Calculus w/ Analytic Geometry SLO Number Spring 2012 SLO #2 SLO Statement Score 3 Score 2 Score 1 Score 0 Students will find derivatives of single-variable elementary functions. 39.0% (75) 38.0% (73) 23.0% (43) Success Rate (scoring 2 or 3) 77.0% 42
43 Fall 2012 SLO #2 Spring 2013 SLO #1 (formerly SLO #6) Fall 2014 SLO #1 Fall 2015 SLO #2 Students will find derivatives of single-variable elementary functions. Fundamental Theorem of Calculus - Students will be able to use the Fundamental Theorem of Calculus Understanding Concepts - Students will explain and demonstrate the idea of the limit, the derivative, and the integral. Solving Problems - Solve problems, including problems involving velocity and acceleration, by using derivatives and integrals. 66.0% (102) 55.0% (124) 54.2% (169) 43.0% (100) 23.0% (33) 24.0% (55) 25.0% (78) 25.0% (57) 11.0% (18) 21.0% (48) 13.4% (42) 18.0% (42) 7.4% (23) 14.0% (33) 89.0% 79.0% 79.2% 68.0% Math Summary of Analysis and Actions: Overall, we see strong success rates ranging from the upper 60s to high 80%. We are very pleased with the results and as we assess future SLOs in the terms to come, we plan to increase the rigor of the assessments to further push our students to deeper understanding of the subject matter. In Spring 2012, instructors commented on a need to spend more class time on analyzing implicit equations (in particular when taking implicit derivatives). This has been an area that many students struggled with. In spring 2013, 79% of the students performed at the excellent or satisfactory level. Some instructors noted that students had more difficulty with Part 1 than Part 2 of the Fundamental Theorem of Calculus. Most instructors will give more examples and assign more homework problems in the future, especially for those related to Part 1 of the Fundamental Theorem of Calculus. In Fall 2014, since students performed well in utilizing the definition of the derivative, we would like to change the type of function being evaluated in the next assessment. Instead of using a polynomial function, we plan to increase the rigor and utilize a basic rational function or radical function (thus changing the algebraic techniques required to evaluate the limit of the difference quotient). We hope to raise the success rate to 70% in a future assessment. Perhaps we will use a different application problem such as related rates to assess calculus problem solving techniques. Term Spring 2012 SLO Assessment Summary - Math Calculus w/ Analytic Geometry II SLO Number SLO #3 (formerly SLO #5) Fall 2012 SLO #2 SLO Statement Score 3 Score 2 Score 1 Score 0 Students will solve problems involving parametric equations, polar coordinates, and conic sections. Students will evaluate integrals, both proper and improper, using integration techniques including integration by parts, trigonometric substitutions, partial fraction decompositions and numerical techniques to approximate the values of integrals % (87) 47.0% (85) 22.0% (32) 31.0% (57) 18.0% (26) 22.0% (39) Success Rate (scoring 2 or 3) 82.0% 78.0%
44 Spring 2013 SLO #4 Students will construct proofs relevant to the course concepts and content. 45.9% (84) 34.4% (63) 19.7% (36) 80.3% Fall 2014 SLO #1 Fall 2015 SLO #2 Understanding concepts - Students will explain and demonstrate advanced integration techniques and convergence of sequences and series. Solving Problems - Students will use integrals to evaluate volumes, surface area and arc length. 40.0% (64) 34.8% (72) 32.5% (52) 29.5% (61) 14.4% (23) 27.0% (56) 13.1% (21) 8.7% (18) 72.5% 64.3% Math Summary of Analysis and Actions: Overall, we see strong success rates in the mid-60% to low-80% range. We are pleased with the results and will continue to increase the rigor of assessments in the future to further analyze how deeply our students understand challenging STEM material. In Fall 2012, some instructors commented that students had difficulties with integration by parts. We strongly believe that a better understanding of limits and indeterminate forms should be required for students to be successful in this course. In Fall 2014, the students who participated in this SLO assessment did well in utilizing the tests for convergence of sequences and series. Five out of the seven sections used geometric sequence and series to be tested for convergence. For the next assessment, instead of using a geometric series, we would like to use a series that requires students to use a test for convergence other than the geometric series test. We are planning to use a series that can be tested for convergence using the ratio test or the integral test. In Fall 2015, we would like to improve the success rate to 65%. Further, we should expand the question to include concepts, such as surface area and arc length. Instructors commented that it is important to train students to visualize and sketch functions, in addition to solids in three dimensions. Reinforcing basic concepts from Precalculus (such as trigonometric functions) can help alleviate some performance issues. Trigonometry is also central to many of the difficult ideas in Calculus II. Without this foundation, we run into trouble. Many instructors have commented that students have trouble setting up the problem while the integration goes pretty smoothly. Using some mathematical visualization software in classes can help bolster students abilities to sketch appropriate diagrams and visualize the solids of revolution actually being generated. Putting students into groups can also help them develop their problem solving skills by collaborating and bouncing ideas off each other. Term Spring 2012 SLO Number SLO #1 (formerly SLO #3) SLO Assessment Summary - Math Discrete Math SLO Statement Score 3 Score 2 Score 1 Score 0 Students will use number theory to find factorizations, common multiples and factors, perform modular arithmetic, and prove important results. 55.0% (17) 32.0% (10) 13.0% (4) Success Rate (scoring 2 or 3) 87.0% 44
45 Spring 2013 SLO #1 Spring 2014 SLO #3 (formerly SLO #5) Fall 2014 SLO #1 Fall 2015 SLO #2 Logic and Proof - Students will use logic and set algebra to analyze statements and arguments and use these ideas to write proofs using a variety of methods. Graph Theory - Students will solve problems and write proofs in graph theory. Understanding Concepts - Students will explain and demonstrate an understanding of key principles of logic, number theory, combinatorics, probability and graph theory. Solving Problems - Students will use logic, functions, number theory, and combinatorics to solve a variety of problems, including application problems and computer science algorithm analysis. 55.6% (15) 51.9% (14) 56.0% (15) 70.0% (15) 29.5% (8) 37.0% (10) 30.0% (8) 21.3% (5) 14.8% (4) 11.1% (3) 14.0% (4) 8.7% (2) 0.0% (0) 0.0% (0) 85.2% 88.9% 86.0% 91.0% Math Summary of Analysis and Actions: We usually only have one section of Discrete Math each term. However, in recent terms popularity of the course has increased due to the increasing size of our Computer Science Program. We hope to have two or more sections each term. Overall, SLO success rates are very high from 85% to 91%. Students tend to be very capable at this level and show a trend of persistence. In Spring 2012, the instructor commented that 87% of the students did well in applying the Chinese Remainder Theorem to solving a system of linear congruencies using modular arithmetic. The students did well by studying important examples from class and doing practice problems before the test. In the future, more useful practice problems will be given to the students to prepare them for tests. In Spring 2013, the students did well again on graph theory proof since 85.2% succeeded at the excellent or satisfactory level. In the future, we will give them a wider variety of examples so they can tackle harder proofs. In Fall 2014, approximately 86% of the students excelled on this SLO assessment because they were exposed to several examples related to the classification of relations in detail explanations. Next time, we want to assess a different topic such as number theory, combinatorics, probability or graph theory to check for full understanding of this SLO. In Fall 2015, with a high success rate of 91%, almost everyone showed complete or almost complete understanding. For future assessment of SLO #2, we would like to possibly increase the rigor of the problem and/or change the nature of the problem to assess a different skill set for discrete mathematics. Term SLO Assessment Summary - Math Calculus w/ Analytic Geometry III SLO Number SLO Statement Score 3 Score 2 Score 1 Score 0 Success Rate (scoring 2 or 3) 45
46 Spring 2012 SLO #2 (formerly SLO #3) Calculate partial derivatives for a function of more than one variable. 79.0% (53) 10.5% (7) 10.5% (7) 88.5% Fall 2012 SLO #2 (formerly SLO #5) Fall 2014 SLO #1 Fall 2015 SLO #2 Solve problems involving double integrals. Understanding concepts - Students will explain and demonstrate partial derivatives, multiple integrals and the major theorems of vector calculus. Solving Problems - Students will calculate partial derivatives for a function of more than one variable and use them to solve multivariable optimization problems; and evaluate double and triple integrals, and apply them to physical problems such as moments and center of mass. 53.0% (35) 78.0% (66) 51.6% (65) 34.9% (23) 12.0% (10) 31.0% (39) 12.1% (8) 8.0% (7) 11.1% (14) 2.0% (2) 6.3% (8) 87.9% 90.0% 83.0% Math Summary of Analysis and Actions: Overall, we see very high success rates in our high-level STEM courses. With success rates in the 80-90% in all SLO assessments, we continue to raise our standards and increase the rigor of our assessments to further challenge our advanced STEM students as they prepare for their four-year university STEM programs. In Spring 2012, instructors commented that by explaining the concept, and thorough exercises, almost all of the students were able to do excellent work with the partial derivatives. As an action for the future, we must continue to emphasize applications of the topics, including utilizing partial derivatives to solve real-world problems. In Fall 2012, students performed very well on the SLO mainly due to a huge amount of review practice time on the topic at the end of semester. Most of the errors were not due to misunderstanding of problems, but rather, carelessness. Although the question was not challenging, it did require a change of coordinate systems which some students had trouble with. Overall, the students had a firm grasp of what needed to be done and how to do it. The results indicate to us that a greater emphasis on understanding the region of integration is needed. One approach might be to include in our lectures more problems involving graphs of the region of integration. Since there are only few questions on the topic in the textbook, we will look into different supplemental resources for the topic and create activities and more practice problems. There is no recommendation for curriculum change at the course and program level. In Fall 2014, instructors commented that due to their strong foundation in differentiation from the Single Variable Calculus sequence (Math 190 and Math 191), the students were able to learn partial derivatives quickly. A brief review of differentiation was helpful to students. Possible actions may include 1. Since the majority of students understand the concept, we will continue what works well. 2. Flip-n-teach and teach-n-flip. 3. For the nine students who scored a 0 (No understanding) and a 1 (Some understanding), we need to encourage them to put in more effort and to study hard. We also need to encourage the students who have work-related issues to balance time between studying and work. For those who have health-related issues, we need to encourage them to take care of their health first before they enroll in an intense course like Math 220. In Fall 2015, students seemed to meet or exceed expectations with this SLO. Instructors found that utilizing a variety of teaching strategies, from traditional lecturing to putting students into collaborative groups, helps to strengthen student understanding of 46
47 Multivariable Calculus. Assigning a variety of homework problems and having students practice the ideas frequently will help to improve future results. Some strategies that we can try for future assessments of this SLO include using math visualization software in class to generate images and animations of the calculus at work. Optimizing quantities in three dimensions definitely takes some getting used to and having strong visual aids will help bolster student understanding. Thus, for future assessment of SLO #2, we would like to change the nature of the optimization-type problem to incorporate different skill sets utilized in the Multivariable Calculus course and/or increase the rigor of the assessed problem. Term SLO Assessment Summary - Math Differential Equations & Linear Algebra SLO Number Spring 2012 SLO #1 Fall 2012 Spring 2013 SLO #2 (formerly SLO #4) SLO #1 (formerly SLO #4) Fall 2014 SLO #1 Fall 2015 SLO #2 SLO Statement Score 3 Score 2 Score 1 Score 0 Students will solve both linear and nonlinear 1st and 2nd order ordinary differential equations and higher order ODE and their applications. Students will solve systems of ODEs, especially with eigenvalues and eigenvectors in order to effectively solve linear systems of ODE. Students will understand linear algebra (linear systems, matrices, determinants, vector spaces, linear transformations) as a first step to generalize procedure to solve higher order linear ODEs. Understanding concepts - Students will explain and demonstrate the key concepts of linear algebra including determinants, vector spaces and linear transformations. Solving problems - Students will use differential equations and linear algebra to solve a variety of application problems. 71.0% (53) 66.2% (43) 55.7% (39) 27.0% (20) 47.0% (36) 13.0% (10) 16.9% (11) 17.2% (12) 11.0% (8) 34.0% (26) 16.0% (12) 16.9% (11) 27.1% (19) 54.0% (40) 19.0% (15) 8.0% (6) 0.0% (0) Success Rate (scoring 2 or 3) 84.0% 83.0% 73.0% 38.0% 81.0% Math Summary of Analysis and Actions: Overall, the Math 270 course has mostly high success rates (73% to 84%). In Spring 2012, the majority of students knew how to solve first order nonlinear differential equations even though they were not told which 47
48 specific technique was required to solve the problem. We think that the main reason for the high success rate is that students differential and integral skills were well developed throughout Math 190, Math 191, and Math 220. In Fall 2012, the majority of students (about 83%) understood how to solve the system of ordinary differential equations using eigenvalues and eigenvectors. We can increase the student success rate by solving more sample problems and also giving more in-depth lectures so that students can grasp the concept to solve a linear system of ordinary differential equations with eigenvalues & eigenvectors. Also, providing more faculty office hours and practice outside classroom is absolutely necessary for this course. In Spring 2013, the data showed that more than 50% of all the students enrolled in Math 270 have a strong understanding of the concepts of linear algebra. More exercises in linear algebra will help students grasp the concept. We should offer a separate course in linear algebra, so that the students will have a detailed understanding of the concepts in the subject before they try to understand its applications to differential equations. In Fall 2014, we had a bit of an anomaly with a lower success rate of 38% for a linear algebra problem. Due to the small sample size of such an advanced math course, we get a variety of results depending on the nature of the SLO problems and the materials used to teach the course. Different instructors emphasize different topics in this course from time to time which may have contributed to the difference in performance. One section (0970) had a bit more trouble with the SLO and this could be a due to a variety of reasons. We would like to see closer to 60% of the students reach the good to excellent understanding on the SLO when it is assessed again. The course is quite advanced and requires a substantial amount of abstract thinking for our higher-level STEM students. Continuing to have the students work individually and collaboratively on problems related to basis and vector spaces will help improve performance. For Fall 2015, with 81% of students assessed at complete or most understanding, overall we are pleased with the results. At this level, students tend to have strong study habits. We continue to emphasize with students the need to work diligently on assigned homework problems. Using collaborative activities in class can help students strengthen their own understanding by explaining the problem solving process and techniques to their peers. We hope to continue emphasizing conceptual understanding of the ideas being studied in addition to the mathematical procedures to help students solve application problems. In the future, we plan to assess a mixed variety of differential equations problems (perhaps focusing on a different application, such as population dynamics or temperature) and increase the rigor of the problem as well. PLO Assessment for CM1 Mathematics (for Engineering, Sciences, and Math Students) SPRING PLO #4 Students will construct proofs relevant to the course concepts and content. Linking Course Assessments PLO #4 was linked to these course SLOs: Math #4(#3old), Math #1(#7old), Math #1(#6old), Math #4(#3old), Math #1 and #3(#5old), Math #3, Math #1(#4old) Reporting Assessment: Section Excellent * Satisfactory * Unsatisfactory * Totals* Math (50.0%) 6 (9.1%) 27 (40.1%) 66 Math (44.6%) 63 (31.2%) 49 (24.2%)
49 Section Excellent * Satisfactory * Unsatisfactory * Totals* Math (54.6%) 55 (24.3%) 48 (21.1%) 227 Math (45.9%) 63 (34.4%) 36 (19.7%) 183 Math (53.7%) 18 (33.3%) 7 (13.0%) 54 Math (53.0%) 23 (34.9%) 8 (12.1%) 66 Math (55.7%) 12 (17.2%) 19 (27.1%) 70 Total 434 (50.0%) 240 (27.6%) 194 (22.4%) 868 PLO #4 - Summary of Analysis and Actions: Overall, we see that 77.6% of the students performed at the Excellent or Satisfactory level. The only course that differed significantly from this percentage was Math 170 at 59.1%. This is the first course in the STEM sequence, so it is not surprising that students have a hard time adjusting to the rigors of a STEM course. Here are some suggestions made by instructors to encourage improvements for higher student success in constructing proofs: 1. Many instructors are suggesting that we should introduce more practice problems and examples on proofs to supplement the textbooks. Some instructors are already creating extra handouts for students to use as an additional resource. 2. Also, increasingly more instructors are taking advantage of online resources like videos and online homework. Implications and Future Directions: In order to increase the overall success rate in STEM courses, we recommend adding a unit to Math 170 to help strengthen student learning of basic concepts in trigonometry. FALL PLO #1 Understanding Concepts - Students will explain and demonstrate mathematical concepts relevant to the course content. Linking Course Assessments PLO #1 was linked to these course SLOs: Math #1, Math #1, Math #1, Math #1, Math #1, Math #1, Math #1 Reporting assessment: Sections Score 3 Score 2 Score 1 Score 0 Total Math (74%) 22(10%) 19(9%) 16(7%) 214 Math (47%) 120(36%) 30(9%) 26(8%) 334 Math (54.2%) 78(25%) 42(13.4%) 23(7.4%) 312 Math (40%) 52(32.5%) 23(14.4%) 21(13.1%) 160 Math (56%) 8(30%) 4(15%) 0(0%) 27 Math (78%) 10(12%) 7(8%) 2(2%) 85 Math (27%) 8(11%) 40(54%) 6(8%) 74 Total 649(54%) 298(25%) 165(14%) 94(7%) 1206 PLO #1 - Summary of Analysis and Actions: Overall, 79% of the students scored a 3 or a 2 and passed SLO#1. We are very pleased with the results demonstrating that we have met our standard for this PLO. The only course that differed significantly from this 49
50 percentage was Math 270 at 38%. Due to a small sample size for this advanced math course, we get a variety of results depending on the nature of the SLO problems and the materials used to teach the course (please see full analysis in the Math 270 SLO Summary). We will continue to use instructor feedback on their student performance to raise our success rates and help students become successful on the STEM track. Many instructors found that utilizing a variety of teaching techniques is helpful in reaching students that respond better to different learning styles - including collaborative group work, interactive demonstrations, and utilizing technology in the classroom (e.g., software, Mathematica, graphing calculators, online homework) to further illustrate challenging math concepts and engage our diverse student population. Instructors have suggested the following action for future assessment: We find it helpful to establish real world applications of the concepts being studied to further demonstrate to students that their success in STEM career fields can be bolstered with a strong understanding of mathematics. FALL PLO #2 Solving Problems: Students will solve problems, including application problems, relevant to the course concepts and content. Linking Course Assessments PLO #2 was linked to these course SLOs: Math #2, Math #2, Math #2, Math #2, Math #2, Math #2, Math #2 Reporting assessment: Sections Score 3 Score 2 Score 1 Score 0 Total Math (53%) 53(22%) 33(14%) 28(11%) 241 Math (58.8%) 42(18.4%) 21(9.2%) 31(13.5%) 228 Math (43%) 57(25%) 42(18%) 33(14%) 232 Math (34.8%) 61(29.5%) 56(27%) 18(8.7%) 207 Math (70%) 5(21.3%) 2(8.7%) 0(0%) 23 Math (51.6%) 39(31%) 14(11.1%) 8(6.3%) 126 Math (47%) 26(34%) 15(19%) 0(0%) 77 Total 550(48.5%) 283(25%) 183(16.1%) 118(10.4%) 1134 PLO #2 - Summary of Analysis and Actions: Overall, we have attained a 73.5% success rate (that is, scoring a 2 or a 3 on the assessment). This meets our target for success. Instructors across our CM1 courses have commented on many ways we are helping our students succeed and methods we can be utilizing to further help them achieve success. For our STEM track students, we hold them to a very high standard and we expect students to work hard, complete homework exercises regularly, and seek out assistance when needed using our on-campus resources, such as the tutoring center or MESA center. Utilizing a variety of technologies and online resources in the classroom continues to help provide students with different ways of seeing, interacting and learning the material. Graphing calculators and computer visualization software, such as Mathematica, help to speed up computations and bolster conceptual understanding. We continue to devise ways to utilize this technology in the classroom and strive to remain current and relevant. Exposure to technology has become increasingly important in today's modern job market. We continue to explore and utilize a variety of teaching methods to reach our diverse student population, including collaborative group activities and project-based learning. Instructors have suggested the following action: We hope to assess problem solving in our STEM courses by increasing the difficulty and rigor of assessed problems as well as changing the application area being assessed. 50
51 e) Describe how you have improved your SLO process and engaged in dialogue about assessment results. As a committee, we continue to devise ways to increase our percentage of faculty reporting SLO data results from their classes and raising awareness (with students as well as faculty) with regards to our SLO and PLO assessment process. Following a department-wide measure from DLOACC, we have consistently posted all assessed courses for a particular term in the department mail room as well as their associated SLO problems and methods of assessment. The rubrics are accessible to all faculty via the posted bulletin and are also distributed by to the entire department as well. On our department website, we have continued to post all the SLO and PLO data and summary reports from the TracDAT (since not all faculty and certainly no students have access to it). Our goal is to keep the SLO assessment transparent keeping all faculty and students aware of the process and the results. After collecting all the data from the term of SLO assessment, we distribute the results to the committee for further discussion. Especially when we see uniquely high or low results, we discuss modifying our assessments adequately to further gauge our students understanding of crucial mathematical ideas. To improve reporting rates (especially among part-time faculty), as a department and committee we continue to remind adjunct faculty that the SLO assessment process is tracked and it is a requirement for part-time faculty evaluation. In TracDAT, we keep tabs on all reporting faculty. Our reporting rate in the last two years has been 100%. f) List any related recommendations. Here are the recommendations for future direction of our SLO and PLO assessment process and results: 1. Increase the units for Math 170 (Trigonometry) from 3 to Hold more TracDat training sessions to train our part-time and full-time faculty in the new assessment and record-keeping system for our SLO and PLO data. Perhaps we can enlist experienced full-time faculty to run such sessions. 3.Continue to emphasize the importance of the assessment and reflection process to part-time faculty members. 4. Continue to involve and engage faculty (part-time and full-time) in dialogue regarding SLO and PLO results. 51
52 5. Analysis of Student Feedback During the Spring 2016 semester, a short survey was distributed to students (n = 1,444) taking the following courses for engineering, science and math: Math 80 (Intermediate Algebra) Math 170 (Trigonometry) Math 180 (Pre-Calculus) Math 190 (Single Variable Calculus and Analytical Geometry I) Math 191 (Single Variable Calculus and Analytical Geometry II) Math 210 (Introduction to Discrete Structures) Math 220 (Multivariable Calculus) Math 270 (Differential Equations with Linear Algebra) The survey contained the following questions: 1. Which math course are you enrolled in this semester? 2. What is your intended major? 3. How many units have you completed at ECC (not including this semester)? 4. Select all math courses you have completed at ECC. 5. Select all math courses you plan to complete at ECC (including this semester). 6. In previous semesters, which courses have you been unable to enroll in? 7. Which technology or computer programs have you used in your math classes at ECC? 8. What is your desired transfer college or university? 9. Which of the following campus resources do you use? 10. Which academic degrees are you interested in achieving? 11. Where do you usually buy math textbooks? 12. Which of these resources would you like to see in the MBA building? 13. Is there an appropriate range of courses offered by the Math and Computer Science Divisions? 14. Are math courses scheduled on days and times that are convenient to me? 15. Have I been able to register for the classes I need in the Math and CS division? 16. Are the courses in Math and CS helping me to achieve my academic goals? 17. Are there a variety of extracurricular activities related to this program on campus? 18. Am I satisfied with the buildings and classrooms used by Math and CS? 19. Am I satisfied with the computers and software used by Math and CS? 20. Am I satisfied with the Math Study Center (MBA119)? 21. Are the tutors in the Math Study Center able to answer my questions? 22. Have my professors adequately prepared me for the next math course? The full results of all 22 questions are included at the end of this section, and will be referred to by question number going forward (Q1 = Question #1, etc). 52
53 a) Describe the results of relevant student feedback. The results of the student feedback can be broken down into four sections: demographics, access to classes, technology and infrastructure/access to assistance. Items noted in red are to be further discussed in section (b) Implications of the survey results and (c) related recommendations. I. Results regarding the demographics of the population surveyed: - Q1-86% of those surveyed were taking Math 80, 170, 180, 190 and Math 191 and only 11.35% were taking Math 210, 270 or 220. The remaining 2.35% were labeled as missing. - Q % of those surveyed were majoring in either engineering (23.75%), computer science (15.65%) or science (18.83%, including life sciences at 11.77% and physical sciences 7.06%). Only 4.43% major in mathematics. - Q8 - Over 50% (52.91%) hope to attend either CSULB, UCLA or other CSU/UC schools. The remaining stated USC or other, with 30.12% labeled missing. - Q10 - Over 50% (52%) are hoping to pursue a Bachelor s or a Master s degree. While this is a positive response, it must be noted that 32.48% were noted missing. II. Results regarding access to the classes being studied in this survey: - Q6 - Almost 10% (9.9%) of those surveyed stated that they had been unable to enroll in Math Q % either agree or strongly agree that there is an appropriate range of courses being offered by the Math and CS divisions. - Q % either agree or strongly agree that math courses are scheduled on convenient times and days. - Q % either agree or strongly agree that they have been able to register for the classes they need in the Math or CS divisions (with Math 80 being the exception as stated in Q6). - Q % either agree or strongly agree that classes in the Math and CS divisions are helping them achieve their academic goals. III. Results regarding technology: - Q % stated that they have used Mathematica (17.17%) and/or online homework (21.26%) in their classes, however 51.39% of the data was missing. - Q19 Over 50% (53.39%) either agree or strongly agree that they are satisfied with the computers and software used by Math and CS. However, it must be noted that 34.76% had no opinion. IV. Results regarding infrastructure and access to assistance: - Q % make use of MESA, Math Study Center, Supplemental Instruction (SI) and Instructor office hours. - Q % buy their textbooks from somewhere other than the ECC bookstore (e.g., Amazon, other students). - Q % would like to see more tables, chairs and whiteboards in the department hallways. In addition, 18.14% would like to see the expansion of the Math Study Center. - Q % agree or strongly agree that they are satisfied with the Math Study Center. - Q % agree or strongly agree that Math Study Center tutors are able to answer their questions. 53
54 - Q % agree or strongly agree that their professors have adequately prepared them for the next math class. b) Discuss the implications of the survey results for the program. We learned from our survey results (Q2) that although most of our students are engineering majors (23.75%), there is a boom in students majoring in computer science which comprises 15.65% of the STEM students. In Spring 2016, we started to offer two sections of Math 210 (Discrete Structures) which is a requirement for computer science majors. This semester (Fall 2016), both sections of Math 210 (morning and afternoon) are full. We recommend that the Math Department continues to offer two sections of Math 210 during Fall and Spring semesters. Sadly, only 4.43% of our students intend to major in mathematics (Q2). Most of our students are not aware that seven out of the top ten highest ranking jobs in the future are math-related (see Vision Section for more details). We recommend that funding for student math clubs be established so we can invite speakers from the industry to promote the usefulness for majoring in mathematics and also to establish funding for math-related field trips. In question 10 observe that only 4.43% of our students plan to get an Associate s Degree. However, many students taking CM1 courses are not as concerned about earning this degree. Rather, they are interested in completing their transfer requirements so that they can move on to a four year institution. We should do a better a job of making the students aware that most of them meet the requirements for an AA and should stress that it s a good idea to get it even if a higher degree is their ultimate goal. In addition, with 52.91% (Q8) of our students hoping to attend four-year colleges and 62.66% (Q2) majoring in either math, computer science, science or engineering, it does not benefit our student body that 10% of them are unable to register for Math 80 (Q6). Since Math 80 is a vital course in the mathematics sequence, we are doing our future four-year college students a disservice if we do not offer enough sections to meet their demand. We recommend increasing the number of sections of Math 80 in fall, winter, spring and summer semesters, so students can get to the appropriate transfer-level class without delay. Also, approximately 17% of our students (Q7) mentioned in our survey that they have used Mathematica in their STEM classes. We recommend that funding be reserved to renew the license of Mathematica annually. Furthermore, our survey data shows that while the majority of our students feel adequately prepared for the next course by their professors, it is clear that they do not feel as if the Math Study Center is beneficial to them. Only 41% (Q20) are satisfied overall with the center and only 35% (Q21) are satisfied with the quality of guidance they are receiving while there. Tutors who are hired and staffed to work in the Math Study Center should be able to help all levels of students who come into the center looking for assistance, and not just those at the developmental/algebra level. It is inequitable to our students (most of whom are transferring to four-year schools and majoring in math, computer science, science or engineering) to have a Study Center where too many tutors are unable to help those at the higher levels. We strongly recommend that we hire a full-time Math Study Tutoring Coordinator to plan, develop and coordinate a comprehensive tutoring program to support students and student success in the Mathematical Sciences Division. Moreover, in order to attract quality tutors, we need to raise the salary of student tutors at the Math Study Center from $10/hour to $12/hour. Last, but not least, most of our tutors have no experience in tutoring whatsoever. We highly recommend reserving staff development funds for instructors who conduct tutor training and materials used during tutor training every semester. 54
55 Lastly, the survey results show that only 34% (Q12) are satisfied with the layout of the MBA building space and common areas. This includes, but is not limited to, lack of chairs, tables and white boards in and around the hallways near faculty offices. With 70% of our students making use of assistance such as office hours, and with our offices already being occupied with two professors, it would only make sense that our students would at least have access to extra tables, chairs and whiteboards. We recommend that additional white boards, tables and chairs be placed in common areas (inside and outside of the MBA building) without causing fire hazards. c) List any related recommendations 1. We recommend that the Math Department continues to offer two sections of Math 210 during Fall and two sections during Spring semester. It will cost approximately $10,500 per additional Math 210 class. 2. We recommend that funding for student math clubs (approximately $2,000 - $3,000 per year) be established so we can invite speakers from the industry to promote the usefulness for majoring in mathematics and also to establish funding for math-related field trips 3. We strongly recommend that we hire a full-time Math Study Tutoring Coordinator to plan, develop and coordinate a comprehensive tutoring program to support students and student success in the Mathematical Sciences Division. Depending on education and experience, the annual salary including benefits is approximately $90, Raise the salary of student tutors at the Math Study Center from $10/hour to $12/hour. 5. We highly recommend reserving staff development funds for instructors who conduct tutor training and materials used during tutor training every semester. Estimated cost $4,000 per semester or $8,000 per year. 6. We recommend that funding be reserved to renew the license of Mathematica annually. ($8000 per year) 7. We recommend placing more tables ($90 per foldable round table), chairs ($25 per chair) and whiteboards ($200 per board) in common areas (inside and outside of MBA) without causing fire hazards. 55
56 6. Facilities and Equipment a) Describe and assess the existing program facilities and equipment. The current Mathematics Department consists of 40 full-time mathematics faculty members and 73 parttime instructors, and has 25 classrooms and 3 laptop computer labs available to use per semester. In the MBA building, 24 offices are designated for full-time faculty, 7 additional offices for part-time faculty, and 2 faculty workrooms. Each workroom is equipped with 3 computers, 2 printers, and only one scanner is available for 116 instructors to use. The demand for more full-time instructors persists due to increased student enrollment, faculty retirement, and attrition. Consequently, the current office space available for the Mathematics Department will be insufficient. As part of the Mathematical Sciences Division, CM1 faculty have started to integrate new technology with their teaching methods. This requires that all computers in the classrooms and labs have software, such as Mathematica or Scientific Notebook, along with regular maintenance to support the equipment and software. Up-to-date technology (hardware and software) for instructors and classroom is still needed despite the fact that each classroom in the MBA building is equipped with a computer, a projection system, and a document reader (Please see 7. Technology and Software for more details). b) Explain the immediate (1-2 years) needs related to facilities and equipment. Provide a cost estimate for each need and explain how it will help the program better meet its goals. Classrooms Since we do not have a full-time technician on site to do repairs and maintenance, many of the document readers are nearing the end of their life span and will need to be replaced soon. We recommend that the Math Department purchase five backup document cameras. This would cost approximately $3,000 ($600 per document camera x 5). Hallways Two large magnetic whiteboards (8 ft. by 4 ft.) need to be installed in each of the hallways of the MBA building. These whiteboards would be placed in the middle of the hallway facing each other. The large boards can be designated as a place where important math department/college announcements for the day or week will be posted, as well as the place where the students are able to work on mathematics before and after class. Students would pay more attention to these whiteboards than those flyers that they typically see and ignore. Each large magnetic whiteboard costs approximately $420 with taxes and shipping. The approximate cost for 6 magnetic whiteboards would be $2520. Faculty Workrooms Each of the two math faculty workrooms is equipped with only three computers and two printers, but unfortunately, the printers keep getting jammed and become inoperable. It is highly recommended that a better HP printer be added in each of the workrooms. The cost of each HP printer is approximately between $575 and $675. The total approximate cost for two more HP printers would be between $1150 and $
57 Currently, there is only one old scanner available in the second floor workroom for 116 faculty to use. Oftentimes, faculty are restricted from use of the scanner if the computer connected to it is currently being used. Also, the scanner is very slow, since it no longer allows the scanning of multiple copies they must be scanned one page at a time. It is highly recommended that two new scanners be purchased for the second floor workroom, along with the purchase of two more scanners for the workroom on the third floor of the MBA building. Scanners offer various uses such as being able to the students the answer key to exams/quizzes/projects and other assignments, sending notes to students who are absent, or scanning students exams for record keeping. The estimated cost for a top of the line scanner is $1,200. The total approximate cost for four new scanners is $4,800. Moreover, the mathematics faculty greatly recommends that a copy machine be available in the workrooms of the second and third floor since the copier in the Division Office often breaks down due to overuse. Faculty have shared their disillusionment when they have wanted to share great material with their students the next morning but were not able to do so since requesting copies of materials from the Copy Center requires a week turnaround. This creates additional stress on faculty members who want to improve student success. Also, most community colleges offer a more lenient copy quota in their math department and a faster turnaround time than ECC. The cost of a run-of-the-mill reliable copier, such as Xerox 4150 copier, is approximately $2,000. c) Explain the long-range (2-4+ years) needs related to facilities and equipment. Provide a cost estimate for each need and explain how it will help the program better meet its goals. In addition, more classrooms with computers are necessary. Having only three classroom computer labs for the thousands of students that the math department serves is a tremendous disappointment. Furthermore, two out of three classroom computer labs are occupied by the Basic Skills Program. Also, the drop-in computer lab is shared with the Business Division, which wants it to be a quiet room, which does not allow for any collaboration among students. We recommend that additional classroom computer labs be dedicated to STEM students in order to give them adequate hands-on experience and to enhance learning. The cost for each desktop computer attached to the cloud is approximately $300- $400. Lastly, we recommend that additional classrooms in the MBA building be dedicated to the Division of Mathematical Sciences. Some faculty have shared their disenchantment with the classrooms they have been assigned in other locations outside the MBA building especially if they have back-to-back classes. d) List any related recommendations. 1. We recommend that the Math Department purchase five backup document cameras. Cost: This would cost approximately $3,000 ($600 per document camera x 5). 2. Purchase two additional HP printer to replace the old printers (one in each faculty workroom). Cost: The cost of each HP printer is approximately between $575 and $675. The total approximate cost for two more HP printers would be between $1150 and $ Purchase 4 new scanners to be placed in the faculty workrooms (two per floor). Cost: The total cost for four new scanners is $4,800 (approx. $1,200 per scanner). 4. Purchase 2 additional copiers for faculty members to share. Cost: The total cost for two standard copiers is $4,000 (approx. $2,000 per copier). 57
58 5. We recommend that additional classroom computer labs be dedicated to STEM students in order to give them adequate hands-on experience and to enhance learning. Cost: The cost for each desk top computer attached to the cloud is approximately $300-$ We recommend purchasing 6 magnetic whiteboards (8ft by 4ft). Two to be installed in each of the hallways of the MBA building. Cost: $ We recommend that additional classrooms in the MBA building are dedicated to the Division of Mathematical Sciences based on room usage. Cost: $0 58
59 7. Technology and Software a) Describe and assess the adequacy and currency of the technology and software used by the program. In today s classroom, technology and software are essential tools for teaching and learning mathematics. Not only is technology used for teaching presentations, but is often used to design, implement, and assess curriculum. With the rapid growth of the internet and technology, instructors are able to access various resources that help support mathematics instruction and enhance the students conceptual understanding of mathematics. Moreover, by combining technology and software with real-world applications, the students will not only gain a deeper understanding of mathematics, but can also build their self-confidence, and hopefully develop an appreciation of the mathematics content that is being introduced in the course. Many math teachers integrate technology and software into their teaching. This includes the use of Excel, Mathematica, Scientific Notebook, Texas Instruments graphing software, and Webassign/eBook/online homework. Consequently, all classrooms must have the appropriate technology equipment and software installed, but there is also a need for faculty to have such software installed on their computers. It will also be necessary to maintain and update this technology and software regularly. b) Explain the immediate (1-2 years) needs related to technology and software. Provide a cost estimate for each need and explain how it will help the program better meet its goals. The MBA building offers three computer labs for instruction with 34 computer stations in each lab, but the expectation of the college is to enroll at least 35 students per class whenever possible. This means that for every class using one of the computer labs with 35 or more students, there will be a few students who will not be able to fully participate in the course activities. To address the shortfall of classroom computers for students, the Math Department has class sets of ipads which require WiFi availability in the classroom. Currently, ITS is working on establishing campus-wide and classroom WiFi availability for students. Wolfram Mathematica (current version 11) is a robust computer algebra system enabling teachers and students to solve math problems and interactively explore math concepts using technology. While on campus, Mathematica is available for teachers in each math classroom and for students in the MBA computer lab and computer classrooms. In the past year or so, El Camino College s ITS department made Mathematica even more readily available to students and faculty so they can work from home on math projects and CAS homework assignments. Directions for any El Camino College student or faculty member: from the Math Division webpage simply click CAS Mathematica Student Access found in the left sidebar under Special Programs. A PDF will open with instructions on how to get access to Mathematica from a personal computer or laptop. Approximate cost for annual Wolfram Mathematica license: $8000 c) Explain the long-range (2-4+ years) needs related to technology and software. Provide a cost estimate for each need and explain how it will help the program better meet its goals. WiFi availability in the classrooms is critical to providing students and faculty creative options for using technology like Mathematica. WiFi in the classroom will enable more technology-related student projects or interactive demonstrations where students can manipulate the controls at their desks. 59
60 Today s learners need to be more active and engaged in the classroom. The lack of proper technological tools and software in the classrooms will impose limitations on the type of teaching and interaction that can take place. CM1 recommends funding for the aforementioned technology and software, as well as maintaining all equipment, retaining currency, and providing for new and innovative technological tools in the classroom. d) List any related recommendations. 1. We recommend that the license for Mathematica be renewed each year (Cost: $8000 per year) 2. We recommend that the license for Scientific Notebook be renewed each year (Cost: $1000 per year) 3. We recommend that a stronger WiFi signal be made available in the MBA building. 60
61 8. Staffing a) Describe the program s current staffing, including faculty, administration, and classified staff. We compared the number of sections taught by full-time and part-time faculty. The staffing data is obtained from published schedules of classes and should therefore be considered approximate since changes to the official schedule are often made after the publication of the schedule. College Level Mathematics Program M170 M180 M190 M191 M210 M220 M270 Total F T P T F T P T FT PT F T P T F T P T F T P T F T P T Sections Fall Winter Spring Summer Fall Winter Spring Summer Fall Spring Summer Fall Spring Summer Fall Spring Summer Fall Full Time/ Part Time Course Totals % FT 55% 74% 86% 92% 100% 96% 96% 79% b) Explain and justify the program s staffing needs in the immediate (1-2 years) and long-term (2-4+ years). Provide cost estimates and explain how the position/s will help the program better meet its goals. 61
62 The number of sections offered by the College Level Mathematics Program is up 40% from 2012 to 2016, and the ratio of full-time to part-time faculty meets California Community College requirements. However, looking at the waitlist situation for the fall 2016 semester, we have: Course M170 M180 M190 M191 M220 M270 Total On Waitlists For 9 of the sections, the waitlist had reached 10, the maximum number allowed, which means that it is very possible/likely that the total number of waitlisted students should be greater. Given these numbers and the general pattern of growth established, it is recommended that we hire at least two full-time tenure track professors in the immediate future (1-2 years) and at least 2 additional full-time tenure track professors in the long term (2-4+ years). It is further recommended that an additional full-time tenure track professor be hired for each full-time faculty member who decides to leave the Mathematical Sciences Division, and that the hiring process be completed as soon as possible. STRS 607,872/ Health and Welfare 502,039/ Medicare 89,494 / Average Salary SUI 3140/ Workers Comp / Total Average Cost For Full-Time Faculty The basic data in the table above was obtained from accounting on August 26, 2016, and represents the average cost for existing Mathematical Sciences full-time faculty. It should be noted that the average cost for hiring new faculty would probably be significantly less, based on the assumption that they would have much less teaching experience. c) List any related recommendations. 1. We recommend hiring 5 full-time faculty members over the next two years that are capable of teaching at all levels in the math department. This should be beyond the replacement of retirees, to take the total number of full-time math faculty from 40 to 45. The average cost of hiring a full-time faculty member including the cost of health care and pension is approximately $90,000/year. 2. We recommend having two part-time hiring panels each year to increase the part-time pool so that we can keep up with the growing demand for instructors that we will need for all programs in our department. 62
63 9. Direction and Vision a) Describe relevant changes within the academic field/industry. How will these changes impact the program in the next four years? The CM1 math courses form the core of a well-rounded STEM education. As stated on the website: The United States has developed as a global leader, in large part, through the genius and hard work of its scientists, engineers, and innovators. In a world that s becoming increasingly complex, where success is driven not only by what you know, but by what you can do with what you know, it s more important than ever for our youth to be equipped with the knowledge and skills to solve tough problems, gather and evaluate evidence, and make sense of information. These are the types of skills that students learn by studying science, technology, engineering, and math subjects collectively known as STEM. Yet today, few American students pursue expertise in STEM fields and we have an inadequate pipeline of teachers skilled in those subjects. That s why President Obama has set a priority of increasing the number of students and teachers who are proficient in these vital fields. This sentiment is echoed in a CNN interview with noted astrophysicist Neil Degrasse Tyson: Innovations in science, engineering, technology and math will be the drivers of tomorrow s economy. And if you are not a participant on that frontier, you will trail behind it and possibly get left behind entirely. In the same interview, Dr. Tyson addresses those who may feel that math is not a necessary component of an education for everyone and stresses the importance of STEM education beyond just the knowledge itself that is gained in the process: There are people who say I ll never need this math, these trig identities from tenth grade, or eleventh grade, or maybe you never learn them. Here is the catch: whether or not you ever again use the math that you learned in school, the act of having learned the math established a wiring in your brain that didn t exist before, and it s the wiring in your brain that makes you the problem solver. Even if you don t want to become a scientist, the minimum you should ask of yourself, demand of yourself, is that you become scientifically literate. Better yet, scientifically literate and mathematically literate because therein are the engines of problem solving in the world. [In relation to jobs and earning money with a STEM education], now you re valuable to an employer because companies want to innovate, and the companies that don t innovate, they whither on the vine. So the connection between STEM fields and financial stability of a nation is what needs to be established. That connection is somehow broken; people don t see it. You should be educated and, in the education, you should value science, engineering, technology, and math. If you do so, you get to innovate and invent new industries, new economies. If you invent new economies, everybody has jobs tomorrow. In the current economic landscape, the need for STEM jobs is increasing faster than other occupations. 63

64 Source: According to careercast.com, a site related to finding jobs and an information source for the career market, seven of the top ten jobs of 2016 have a very strong math component. They ranked the jobs based on working environment, stress levels, and job outlook. Below are the aforementioned seven along with an additional five in the top 26: 1) Data Scientist 2) Statistician 3) Information Security Analyst 6) Mathematician 7) Software Engineer 8) Computer Systems Analyst 10) Actuary 14) Biomedical Engineer 17) Network Computer Systems Admin 20) Petroleum Engineer 21) Physicist 26) Web Developer 64
65 Focusing on jobs in the STEM fields, U.S. News and World Report recently listed the top 25 best STEM jobs of 2016, pointing out that these jobs are very diverse and have low unemployment rates and increased demand, with most median salaries in the high five to low six figures and demand reaching into the hundreds of thousands. Listed are the top ten, along with number of projected jobs, median salary, and unemployment rate. Rank Job Title Number of Projected Jobs Median Salary Unemployment Rate 1 Computer Systems 118,600 $82, % Analyst 2 Software Developer 135,300 $95, % 3 Statistician 10,100 $79, % 4 Web Developer $63, % 5 Accountant 142,400 $65, % 6 Biomedical Engineer 5,100 $86, % 7 IT Manager 53,700 $127, % 8 Financial Advisor 73,900 $81, % 9 Information Security $88, % Analyst 10 Mathematician 700 $103, % All of this points to the fact that there is currently a need for people trained in the STEM fields, which begins with a strong mathematical backbone for students. Proper and thorough training, as the students pass through the calculus sequence, will allow them to excel in their desired field of study. With the outlined characteristics of such jobs: high demand, good salary, and low unemployment, the skill set for these jobs will necessarily be in demand as well. In 2011, the U.S. Department of Commerce s Economics and Statistics Administration released an article entitled STEM: Good Jobs Now and For the Future, detailing the state of STEM jobs over the first decade of the 21 st century. In it, they found that the growth in STEM jobs was three times as fast as growth in non- STEM jobs. In terms of earnings, STEM workers command higher wages, earning 26 percent more than their non-stem counterparts. Interestingly, they found that having a degree in a STEM field led to increased wages regardless of whether they work in STEM or non-stem occupations. The common thread is that a STEM education, which comes in part from classes such as those present in CM1, leads to increased job opportunities and higher wages even for those who choose not to pursue a career in a STEM field. In turn, the demand for a quality STEM education is likely to be on the rise. The skills gained in taking and succeeding, for example, in higher level math courses permeates other areas that are vital to future success, such as critical thinking and problem solving. As mathematics instructors, we play a vital role in assuring that the students that we educate receive quality instruction that will not only prepare them for future math courses, but for other fields of education, STEMrelated or otherwise. With the ever-changing landscape in regard to technology, non-traditional teaching strategies, and student needs, we as instructors at the community college level need to look ahead and be prepared to best serve our population of students and guide them toward future success in life. A useful reference on mathematics education at the college level is the publication Beyond Crossroads, Implementing Mathematics Standards in the First Two Years of College, November, 2006, from the American 65
66 Mathematical Association of Two-Year Colleges (AMATYC). According to this document, these are the basic principles that will help to address the issues and challenges facing mathematics education in the coming years: 1. Assessment. The assessment of student learning in mathematics should be a fundamental tool for the improvement of instruction and student learning. 2. Broadening. Mathematics courses and programs in the first two years of college should broaden students options in educational and career choices. 3. Equity and access. All students should have equitable access to high-quality, challenging, effective mathematics instruction and support services. 4. Innovation. Mathematics programs should be thoughtfully constructed to approach content and instruction with appropriate use of traditional and innovative methods. 5. Inquiry. Effective mathematics instruction should require students to be active participants. 6. Quantitative literacy. Quantitative literacy should be integrated throughout the mathematics program and the college curricula. 7. Relevance. The mathematics that students study should be meaningful and foster their appreciation of the discipline. 8. Research into practice. The practice of mathematics teaching should be guided by research on teaching and learning. 9. Technology. Technology should be integral to the teaching and learning of mathematics. We believe that the courses that comprise the CM1 program address these issues very well. Student Learning Outcomes (SLO) provide an assessment tool for understanding student learning and teaching methods can be fine-tuned in response to the results. As mentioned earlier, a STEM education broadens the horizons for students, for whichever career they may choose to pursue. Technology is used in many of the CM1 courses, be it graphing calculators or even software packages such as Mathematica. These resources are made available to students and allow everyone to learn on equal footing, regardless of other factors such as socioeconomic status. We will continue to explore new ways to incorporate all of these ideas so as to help increase student learning and success. 66
67 b) Explain the direction and vision of the program and how you plan to achieve it. The primary vision of the CM1 Program is to provide the community with a comprehensive and dynamic mathematics curriculum that will not only strengthen the math skills of our students, but will also bolster their efforts in all STEM courses. This will lead to higher success rates, graduation rates, and transfer rates. We must strive to be a department that will attract students from near or far. The local area population is aging and there are expected to be fewer school-aged children in future. CM1 will respond to this vision by maintaining our high standards, by continuously reviewing our curriculum, and by keeping up with educational trends both at local colleges and nationally. Our vision is a teaching environment that encourages faculty and students to share ideas and explore. Some teachers do this by offering student projects that go beyond course content and allow interested students to learn more than what is in the course outline. The use of Mathematica for projects, for example, allows students the opportunity to investigate mathematical concepts on their own. This also has the added benefit of introducing students to basic computer programming, which may aid them in future courses or introduce them to related fields such as computer science that they may have not considered studying before. Encouraging faculty to share their ideas, student projects, or teaching ideas at Brown Bags, which are talks given by faculty to their peers during the college hour, would foster a more stimulating educational atmosphere. Our vision is that more students get involved in national math associations such as the Mathematics Association of America (MAA) or AMATYC. One way to do this is for math faculty to encourage greater participation in and better preparation for the AMATYC Math Competition. Since such competitions deal largely in problem solving and critical thinking skills, participating in them can foster an interest in math that students may not have found in merely experiencing math in a classroom setting. c) List any related recommendations. 1. Increase the number of sections of all CM1 courses, as student demand dictates 2. Increase support through MESA, Tutoring, Supplemental Instruction and the scheduling of weekly workshops. 3. Invite speakers from universities and industry to give talks on the many opportunities available to someone who majors in a STEM field. 4. Increase the number of full-time faculty that are capable of teaching at all levels in the math department. Increase the part-time faculty pool by having two part-time hiring panels each year. 67
68 10. Prioritized Recommendations a) Provide a single, prioritized list of recommendations and needs for your program/department (drawn from your recommendations in sections 2-8). Include cost estimates and list the college strategic initiative that supports each recommendation (see Appendix A). Use the following chart format to organize your recommendations. b) Explain why the list is prioritized in this way. Recommendations 1. We recommend hiring 5 full-time faculty members over the next two years that are capable of teaching at all levels in the math department. This should be beyond the replacement of retirees, to take the total number of full-time math faculty from 40 to 45. The average cost of hiring a full-time faculty member including the cost of health care and pension is approximately $110,000/year. 2. We recommend that the number of Math 80 sections be increased and sections of Math 67 and 73 be reduced until the percent of students taking Math 80 is back over 75% (it had been 100% in 2008 and dropped to 22% in 2012 and is around 55% now). 3. We recommend that new sections of CM1 courses be added to the evening program. We also recommend that El Camino College dedicate special advertising to make students aware of the growing evening STEM program. 4. We recommend the hiring of a full-time tutoring coordinator in our Math Study Center to plan, develop and coordinate a comprehensive tutoring program to support students and student success in the Mathematical Sciences Division. Depending on education and experience, the annual salary including benefits is approximately $90,000. Cost Strategic Estimate Initiatives $550,000 A, B, C, E No cost for shifting sections, $12000 per section for new sections $7500- $1300 per section A, D A, B, D $90,000 A, B, C, E 5. We recommend that funds be established (perhaps from staff development) for instructors who conduct tutor training and for materials used during training each semester. 6. We recommend that Winter Semester be expanded by four days by starting on a Tuesday instead of a Thursday and ending on a Thursday instead of a Tuesday. Also, move the Spring Flex morning to Friday before the Spring Semester to accommodate this. $4000 per semester, $8000 per year No Cost A, B, C B, D, E 68
69 7. We recommend increasing support for Math 170 and Math 180 with the addition of Supplemental Instruction. 8. We recommend the purchase of four new document scanners for the faculty work rooms, two for each floor. 9. We recommend the purchase of two new HP Printers for the faculty work rooms, one for each floor. 10. We recommend the purchase of five backup document cameras to prepare for the inevitable decline of the current cameras, which are a vital part of the instructional approach of most faculty. 11. We recommend the purchase of two additional copiers for the faculty work rooms, one for each floor. 12. We recommend that the school shorten the turnaround time for documents submitted to the Campus Copy Center from one week to 24 hours. 13. We recommend that additional computer labs be dedicated to STEM students in order to give them adequate hands-on experience and to enhance learning. The computers would be desktops that are connected to the cloud. 14. We recommend an increase in the number of sections of all courses in the CM1 program as indicated by demand and fill rates. 15. We recommend renewing the campus license for Mathematica. 16. We recommend renewing the campus license for Scientific Notebook. 69 $2000 per section $1200 each, $4800 total $600 each, $1200 total $600 each, $3000 total $2000 each, $4000 total unknown $400 per computer terminal $7,500-13,000 per section $8000 per year A, B, C A, F A, F A, F A, F E, F A, B, F A, B, D A, B, F A, B, F 17. We recommend an increase in funding for MESA A, B, C 18. We recommend that Math 80 (Intermediate Algebra for STEM and Business) be moved from Committee D to CM1. No cost B, C, E 19. We recommend that the number of units of Math 170 be increased from three to four so that the course can be exposed to a greater breadth and depth of topics that will make students more successful in later classes. 20. We recommend that two sections of Math 210 (Discrete Math) continue to be offered each Fall and Spring Semester to keep up with the demand from the growing Computer Science program. Also, increase these to three if there is demand. 21. We recommend that funding for student math clubs be established so that we can invite speakers from industry and to fund field trips. $2500 per unit per section $10,500 per additional class $3000 per year A, B A, B B, C, D
70 22. We recommend that the salary of tutors in the Math Study Center be raised from $10 to $12 per hour. 23. We recommend that CM1 be allowed to add topics to Math 210 (Discrete Math) and increase units from four to five so that the course will better match the C- IDs for the course and so that it will earn full credit at all major transfer schools in California. 24. We recommend that faculty be given access to electronic student educational plan data so that classes can be scheduled more effectively. 25. We recommend having two part-time hiring panels each year to increase the part-time pool so that we can keep up with the growing demand for instructors that we will need for all programs in our department. 26. We recommend that additional lecture rooms in MBA be allocated exclusively for the Division of Mathematical Sciences. Allocation of rooms could be based on room usage data that should be made available to faculty. 27. We recommend that more tables and chairs be placed in the common areas inside or outside the MBA building or other accessible areas. 28. We recommend that more whiteboards be installed in some hallways, such as on the wall outside the Math Department Office. 29. It is recommended that we work to increase participation of faculty, both full time and part time, in the administration, reporting and analysis of SLOs. Additionally, we should continue to develop and review the SLO statements and assessments and update relevant course outlines on a regular basis. 30. We recommend the more money be allocated for faculty development, including training on software such as Mathematica and Scientific Notebook. 32. We recommend that faculty computer laptops be replaced by Spring 2019 to keep up with classroom technology. The last time faculty got new laptops was January We recommend the funding of the AMATYC math contest practices and proctoring. $2500 per unit per section No cost No cost No cost $90 per folding table, $25 per chair $200 per whiteboard no cost $1500 per laptop $3000 per semester A, B A, B A, E A, B, C, E A, E B, C B, C B, C A, F A, F B, C 70
71 APPENDIX A COLLEGE MISSION AND STRATEGIC INITIATIVES ECC MISSION STATEMENT: El Camino College makes a positive difference in people s lives. We provide excellent comprehensive educational programs and services that promote student learning and success in collaboration with our diverse communities. STRATEGIC INITIATIVES for A. STUDENT LEARNING Support student learning using a variety of effective instructional methods, educational technologies, and college resources. B. STUDENT SUCCESS & SUPPORT Strengthen quality educational and support services to promote and empower student learning, success, and self-advocacy. C. COLLABORATION Advance an effective process of collaboration and collegial consultation conducted with integrity and respect. D. COMMUNITY RESPONSIVENESS Develop and enhance partnerships with schools, colleges, universities, businesses, and communitybased organizations to respond to the educational, workforce training, and economic development needs of the community. E. INSTITUTIONAL EFFECTIVENESS Strengthen processes, programs, and services through the effective and efficient use of assessment, program review, planning, and resource allocation. F. MODERNIZATION Modernize infrastructure and technological resources to facilitate a positive learning and working environment. 71
72 Appendix B: Demographic and Enrollment Statistics Fall Term ECC Student Population Fall 2014 District Boundary Population 2010 Census Term Headcount 1,382 1,316 1,489 1,587 24, ,400 Gender F 30.1% 29.8% 30.4% 30.2% 51.6% 51.0% M 69.8% 70.1% 69.6% 69.8% 48.4% 49.0% Ethnicity Age/ Age Group Class Load African-American 5.5% 6.0% 5.9% 6.2% 16.1% 15.1% Amer. Ind. or Alask. Native 0.1% 0.0% 0.1% 0.1% 0.1% 0.2% Asian 36.0% 33.4% 32.8% 30.8% 15.1% 13.6% Latino 34.1% 35.4% 39.6% 42.7% 49.5% 34.5% Pacific Islander 0.7% 0.4% 0.3% 0.6% 0.5% 0.5% White 16.6% 17.9% 14.9% 14.9% 13.6% 32.8% Two or More 3.4% 5.2% 5.3% 4.3% 4.4% 2.9% Unknown or Decline 3.8% 1.8% 1.0% 0.5% 0.7% 0.4% <17 0.9% 0.6% 0.4% 0.3% 1.8% % 3.8% 2.7% 3.1% 2.2% 24.2% % 14.1% 12.6% 14.6% 12.4% % 20.7% 19.3% 19.8% 14.0% 2.5% % 18.0% 17.0% 18.8% 12.6% 1.2% % 10.6% 12.7% 11.3% 9.9% 1.2% % 6.7% 6.8% 7.1% 7.5% % 5.3% 5.2% 5.4% 5.6% 3.9% % 4.4% 5.1% 4.0% 4.7% % 9.5% 11.1% 9.9% 13.0% 7.4% % 4.1% 5.7% 4.2% 8.9% 14.9% % 1.5% 1.0% 0.9% 3.8% 15.9% % 0.5% 0.5% 0.4% 3.0% 18.1% % 0.2% 0.0% 0.1% 0.7% 10.6% Full-time 65.1% 63.3% 64.1% 65.3% 34.5% Part-time 34.9% 36.7% 35.9% 34.7% 65.3% Academic Level College degree 7.0% 6.2% 6.9% 5.2% 11.7% HS Grad 90.6% 91.0% 89.0% 90.7% 82.3% Not a HS Grad 0.9% 0.4% 0.3% 0.2% 0.3% K-12 Special Admit 0.8% 0.9% 0.7% 0.8% 2.3% 72
73 Unknown 0.7% 1.5% 3.2% 3.1% 3.4% Educational Goal Intend to Transfer 40.7% 40.8% 40.2% 41.0% 31.5% Degree/Certificate Only 1.2% 1.7% 1.1% 1.3% 3.5% Retrain/recertif. 1.4% 1.8% 1.1% 1.0% 3.2% Basic Skills/GED 7.8% 7.9% 8.9% 7.6% 5.7% Enrichment 4.1% 3.2% 3.4% 2.6% 2.2% Undecided 17.4% 16.7% 17.4% 16.3% 15.8% Unstated 27.4% 27.9% 27.8% 30.3% 38.0% Spring Term ECC Student Population Spring 2015 District Boundary Population 2010 Census Term Headcount 1,359 1,415 1,552 1,611 22, ,400 Gender F 31.1% 30.1% 29.4% 28.9% 51.7% 51.0% M 68.9% 69.9% 70.6% 71.1% 48.3% 49.0% Ethnicity Age/ Age Group African-American 5.9% 6.1% 6.1% 6.3% 15.3% 15.1% Amer. Ind. or Alask. Native 0.0% 0.0% 0.1% 0.0% 0.1% 0.2% Asian 37.8% 33.2% 31.2% 28.8% 15.1% 13.6% Latino 32.6% 38.2% 40.6% 44.8% 50.0% 34.5% Pacific Islander 0.5% 0.4% 0.4% 0.5% 0.5% 0.5% White 16.9% 15.8% 15.7% 14.5% 13.8% 32.8% Two or More 3.5% 4.3% 5.1% 4.8% 4.5% 2.9% Unknown or Decline 2.9% 2.0% 0.8% 0.3% 0.7% 0.4% <17 0.8% 0.8% 0.5% 0.4% 1.0% % 1.3% 0.8% 1.0% 1.0% 24.2% % 14.6% 12.8% 15.0% 4.2% % 20.1% 20.7% 20.9% 8.5% 2.5% % 17.2% 17.5% 16.0% 7.2% 1.2% % 11.4% 12.0% 12.2% 5.2% 1.2% % 7.6% 8.2% 7.4% 3.6% % 5.3% 5.9% 5.8% 2.8% 3.9% % 5.4% 4.8% 4.4% 2.2% 73
74 % 10.2% 10.8% 11.3% 13.6% 7.4% % 4.7% 4.9% 4.3% 8.9% 14.9% % 1.2% 0.9% 0.8% 3.8% 15.9% % 0.3% 0.3% 0.3% 3.0% 18.1% % 0.1% 0.1% 0.1% 0.7% 10.6% Class Load Academic Level Educational Goal Full-time 63.4% 56.8% 63.3% 64.4% 32.6% Part-time 36.6% 41.9% 36.7% 35.6% 66.2% College degree 6.0% 5.3% 6.1% 6.0% 11.6% HS Grad 91.5% 91.2% 90.7% 89.9% 82.3% Not a HS Grad 1.0% 0.4% 0.2% 0.3% 0.3% K-12 Special Admit 0.4% 0.5% 0.6% 0.5% 2.0% Unknown 1.0% 2.7% 2.4% 3.3% 3.7% Intend to Transfer 41.7% 41.1% 40.5% 40.6% 30.8% Degree/Certificate Only 1.0% 1.6% 1.3% 1.3% 3.7% Retrain/recertif. 1.1% 1.6% 1.4% 1.2% 3.3% Basic Skills/GED 7.9% 7.8% 9.1% 8.3% 5.9% Enrichment 4.6% 3.4% 3.2% 2.5% 2.3% Undecided 17.7% 16.5% 15.9% 15.1% 16.6% Unstated 26.0% 27.9% 28.7% 30.9% 38.0% 74

75 Appendix C: Student Survey Results 75
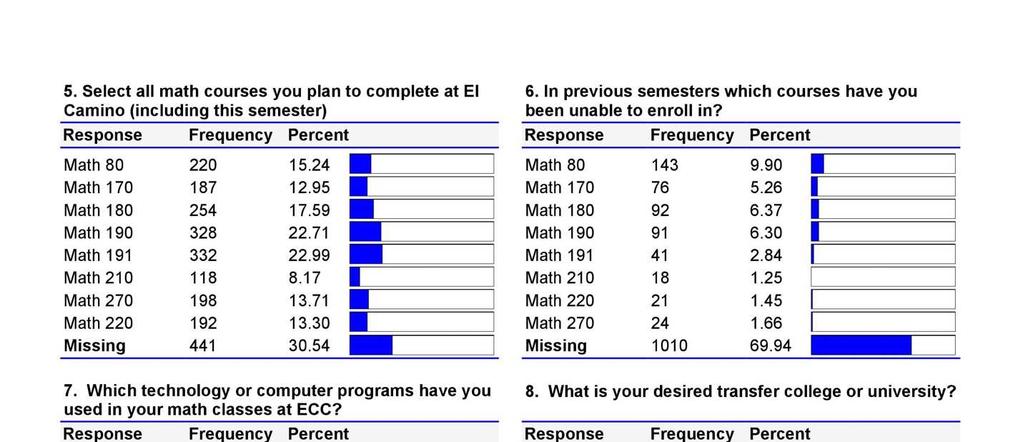
76 76
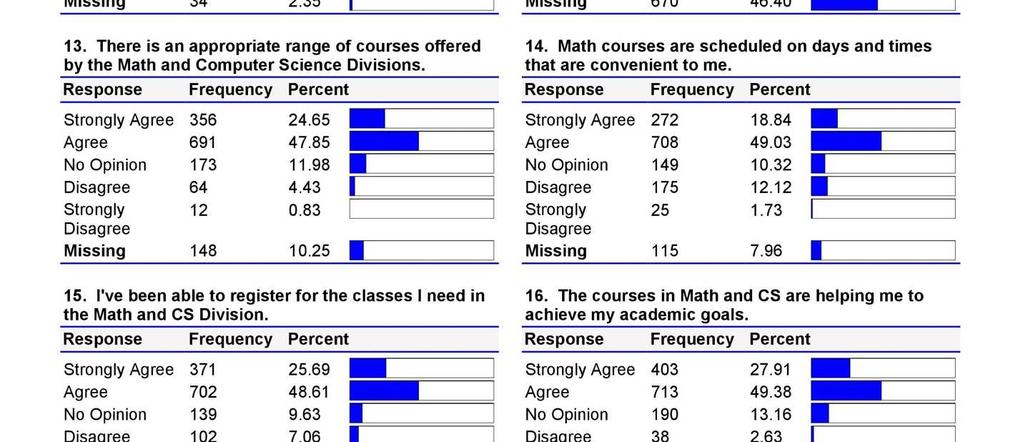
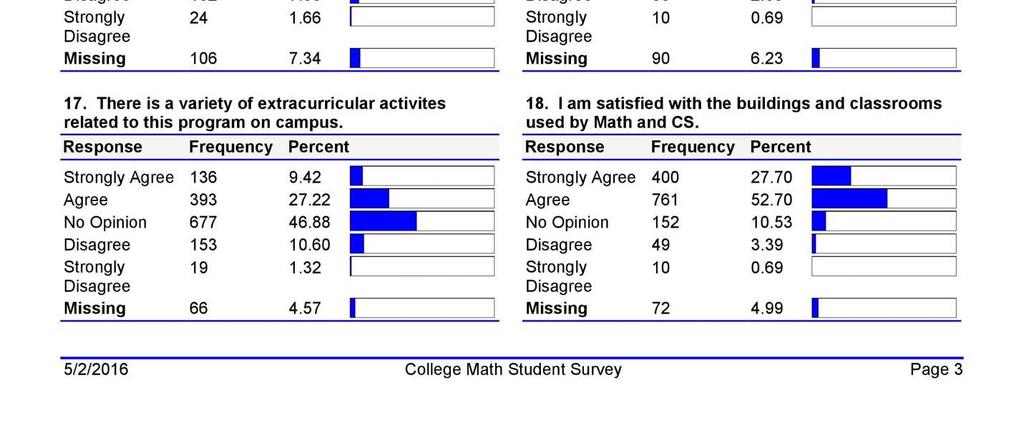
77 77
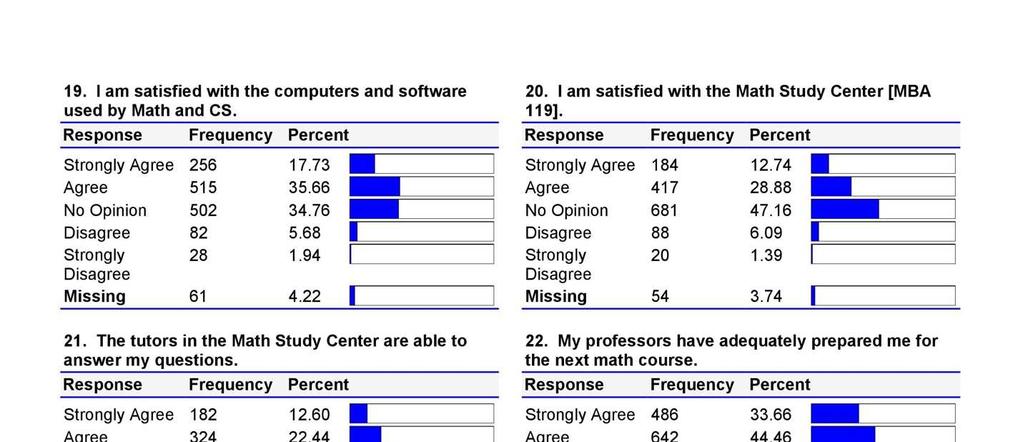
78 78
PROGRAM REVIEW CALCULUS TRACK MATH COURSES (MATH 170, 180, 190, 191, 210, 220, 270) May 1st, 2012
 May 1st, 2012") PROGRAM REVIEW CALCULUS TRACK MATH COURSES (MATH 170, 180, 190, 191, 210, 220, 270) May 1st, 2012 MICHAEL BATEMAN JILL EVENSIZER GREG FRY HAMZA HAMZA LINDA HO ROBERT HORVATH BOB LEWIS ASHOD MINASIAN KRISTINE
PROGRAM REVIEW CALCULUS TRACK MATH COURSES (MATH 170, 180, 190, 191, 210, 220, 270) May 1st, 2012 MICHAEL BATEMAN JILL EVENSIZER GREG FRY HAMZA HAMZA LINDA HO ROBERT HORVATH BOB LEWIS ASHOD MINASIAN KRISTINE
Like much of the country, Detroit suffered significant job losses during the Great Recession.
 36 37 POPULATION TRENDS Economy ECONOMY Like much of the country, suffered significant job losses during the Great Recession. Since bottoming out in the first quarter of 2010, however, the city has seen
EDUCATIONAL ATTAINMENT
 EDUCATIONAL ATTAINMENT By 2030, at least 60 percent of Texans ages 25 to 34 will have a postsecondary credential or degree. Target: Increase the percent of Texans ages 25 to 34 with a postsecondary credential.
Mathematics Program Assessment Plan
 Mathematics Program Assessment Plan Introduction This assessment plan is tentative and will continue to be refined as needed to best fit the requirements of the Board of Regent s and UAS Program Review
Basic Skills Initiative Project Proposal Date Submitted: March 14, Budget Control Number: (if project is continuing)
") Basic Skills Initiative Project Proposal 2016-2017 Date Submitted: March 14, 2016 Check One: New Proposal: Continuing Project: X Budget Control Number: (if project is continuing) Control # 87-413 - EOPS
Basic Skills Initiative Project Proposal 2016-2017 Date Submitted: March 14, 2016 Check One: New Proposal: Continuing Project: X Budget Control Number: (if project is continuing) Control # 87-413 - EOPS
Evaluation of a College Freshman Diversity Research Program
 Evaluation of a College Freshman Diversity Research Program Sarah Garner University of Washington, Seattle, Washington 98195 Michael J. Tremmel University of Washington, Seattle, Washington 98195 Sarah
EDUCATIONAL ATTAINMENT
 EDUCATIONAL ATTAINMENT By 2030, at least 60 percent of Texans ages 25 to 34 will have a postsecondary credential or degree. Target: Increase the percent of Texans ages 25 to 34 with a postsecondary credential.
Physics/Astronomy/Physical Science. Program Review
 Physics/Astronomy/Physical Science Program Review June 2017 Modesto Junior College Instructional Program Review June 2017 Contents Executive Summary... 2 Program Overview... 3 Program Overview... 3 Response
(ALMOST?) BREAKING THE GLASS CEILING: OPEN MERIT ADMISSIONS IN MEDICAL EDUCATION IN PAKISTAN
 BREAKING THE GLASS CEILING: OPEN MERIT ADMISSIONS IN MEDICAL EDUCATION IN PAKISTAN") (ALMOST?) BREAKING THE GLASS CEILING: OPEN MERIT ADMISSIONS IN MEDICAL EDUCATION IN PAKISTAN Tahir Andrabi and Niharika Singh Oct 30, 2015 AALIMS, Princeton University 2 Motivation In Pakistan (and other
(ALMOST?) BREAKING THE GLASS CEILING: OPEN MERIT ADMISSIONS IN MEDICAL EDUCATION IN PAKISTAN Tahir Andrabi and Niharika Singh Oct 30, 2015 AALIMS, Princeton University 2 Motivation In Pakistan (and other
Journalism Department Program Review. Prepared by Professor Lori Medigovich
 Journalism Department 2008-2009 Program Review Prepared by Professor Lori Medigovich Table of Contents I. Overview A. Description of Program B. Degrees/Certificates Offered C. Status of Previous Recommendations
Workload Policy Department of Art and Art History Revised 5/2/2007
 Workload Policy Department of Art and Art History Revised 5/2/2007 Workload expectations for faculty in the Department of Art and Art History, in the areas of teaching, research, and service, must be consistent
State Budget Update February 2016
 State Budget Update February 2016 2016-17 BUDGET TRAILER BILL SUMMARY The Budget Trailer Bill Language is the implementing statute needed to effectuate the proposals in the annual Budget Bill. The Governor
Status of Women of Color in Science, Engineering, and Medicine
 Status of Women of Color in Science, Engineering, and Medicine The figures and tables below are based upon the latest publicly available data from AAMC, NSF, Department of Education and the US Census Bureau.
THE PENNSYLVANIA STATE UNIVERSITY SCHREYER HONORS COLLEGE DEPARTMENT OF MATHEMATICS ASSESSING THE EFFECTIVENESS OF MULTIPLE CHOICE MATH TESTS
 THE PENNSYLVANIA STATE UNIVERSITY SCHREYER HONORS COLLEGE DEPARTMENT OF MATHEMATICS ASSESSING THE EFFECTIVENESS OF MULTIPLE CHOICE MATH TESTS ELIZABETH ANNE SOMERS Spring 2011 A thesis submitted in partial
Shelters Elementary School
 Shelters Elementary School August 2, 24 Dear Parents and Community Members: We are pleased to present you with the (AER) which provides key information on the 23-24 educational progress for the Shelters
Principal vacancies and appointments
 Principal vacancies and appointments 2009 10 Sally Robertson New Zealand Council for Educational Research NEW ZEALAND COUNCIL FOR EDUCATIONAL RESEARCH TE RŪNANGA O AOTEAROA MŌ TE RANGAHAU I TE MĀTAURANGA
Trends & Issues Report
 Trends & Issues Report prepared by David Piercy & Marilyn Clotz Key Enrollment & Demographic Trends Options Identified by the Eight Focus Groups General Themes 4J Eugene School District 4J Eugene, Oregon
The Condition of College & Career Readiness 2016
 The Condition of College and Career Readiness This report looks at the progress of the 16 ACT -tested graduating class relative to college and career readiness. This year s report shows that 64% of students
Colorado State University Department of Construction Management. Assessment Results and Action Plans
 Colorado State University Department of Construction Management Assessment Results and Action Plans Updated: Spring 2015 Table of Contents Table of Contents... 2 List of Tables... 3 Table of Figures...
Los Angeles City College Student Equity Plan. Signature Page
 Los Angeles City College Student Equity Plan Signature Page Los Angeles Community College Los Angeles City College President, Board of Trustees Date District Chancellor: College President: Academic Senate
Promotion and Tenure Guidelines. School of Social Work
 Promotion and Tenure Guidelines School of Social Work Spring 2015 Approved 10.19.15 Table of Contents 1.0 Introduction..3 1.1 Professional Model of the School of Social Work...3 2.0 Guiding Principles....3
Math Pathways Task Force Recommendations February Background
 Math Pathways Task Force Recommendations February 2017 Background In October 2011, Oklahoma joined Complete College America (CCA) to increase the number of degrees and certificates earned in Oklahoma.
Educational Attainment
 A Demographic and Socio-Economic Profile of Allen County, Indiana based on the 2010 Census and the American Community Survey Educational Attainment A Review of Census Data Related to the Educational Attainment
Executive Summary. Laurel County School District. Dr. Doug Bennett, Superintendent 718 N Main St London, KY
 Dr. Doug Bennett, Superintendent 718 N Main St London, KY 40741-1222 Document Generated On January 13, 2014 TABLE OF CONTENTS Introduction 1 Description of the School System 2 System's Purpose 4 Notable
Moving the Needle: Creating Better Career Opportunities and Workforce Readiness. Austin ISD Progress Report
 Moving the Needle: Creating Better Career Opportunities and Workforce Readiness Austin ISD Progress Report 2013 A Letter to the Community Central Texas Job Openings More than 150 people move to the Austin
ILLINOIS DISTRICT REPORT CARD
 -6-525-2- HAZEL CREST SD 52-5 HAZEL CREST SD 52-5 HAZEL CREST, ILLINOIS and federal laws require public school districts to release report cards to the public each year. 2 7 ILLINOIS DISTRICT REPORT CARD
ILLINOIS DISTRICT REPORT CARD
 -6-525-2- Hazel Crest SD 52-5 Hazel Crest SD 52-5 Hazel Crest, ILLINOIS 2 8 ILLINOIS DISTRICT REPORT CARD and federal laws require public school districts to release report cards to the public each year.
STEM Academy Workshops Evaluation
 OFFICE OF INSTITUTIONAL RESEARCH RESEARCH BRIEF #882 August 2015 STEM Academy Workshops Evaluation By Daniel Berumen, MPA Introduction The current report summarizes the results of the research activities
RAISING ACHIEVEMENT BY RAISING STANDARDS. Presenter: Erin Jones Assistant Superintendent for Student Achievement, OSPI
 RAISING ACHIEVEMENT BY RAISING STANDARDS Presenter: Erin Jones Assistant Superintendent for Student Achievement, OSPI Agenda Introductions Definitions History of the work Strategies Next steps Debrief
We are strong in research and particularly noted in software engineering, information security and privacy, and humane gaming.
 Computer Science 1 COMPUTER SCIENCE Office: Department of Computer Science, ECS, Suite 379 Mail Code: 2155 E Wesley Avenue, Denver, CO 80208 Phone: 303-871-2458 Email: info@cs.du.edu Web Site: Computer
Multiple Measures Assessment Project - FAQs
 Multiple Measures Assessment Project - FAQs (This is a working document which will be expanded as additional questions arise.) Common Assessment Initiative How is MMAP research related to the Common Assessment
Class Meeting Time and Place: Section 3: MTWF10:00-10:50 TILT 221
 Math 155. Calculus for Biological Scientists Fall 2017 Website https://csumath155.wordpress.com Please review the course website for details on the schedule, extra resources, alternate exam request forms,
08-09 DATA REVIEW AND ACTION PLANS Candidate Reports
 08-09 DATA REVIEW AND ACTION PLANS Candidate Reports Data Observations Implications for Change Action for Change Admitted to TEP Only ~24% of students Recruit more secondary majors Develop recruitment
Transportation Equity Analysis
 2015-16 Transportation Equity Analysis Each year the Seattle Public Schools updates the Transportation Service Standards and bus walk zone boundaries for use in the upcoming school year. For the 2014-15
Orleans Central Supervisory Union
 Orleans Central Supervisory Union Vermont Superintendent: Ron Paquette Primary contact: Ron Paquette* 1,142 students, prek-12, rural District Description Orleans Central Supervisory Union (OCSU) is the
OFFICE OF ENROLLMENT MANAGEMENT. Annual Report
 2014-2015 OFFICE OF ENROLLMENT MANAGEMENT Annual Report Table of Contents 2014 2015 MESSAGE FROM THE VICE PROVOST A YEAR OF RECORDS 3 Undergraduate Enrollment 6 First-Year Students MOVING FORWARD THROUGH
READY OR NOT? CALIFORNIA'S EARLY ASSESSMENT PROGRAM AND THE TRANSITION TO COLLEGE
 READY OR NOT? CALIFORNIA'S EARLY ASSESSMENT PROGRAM AND THE TRANSITION TO COLLEGE Michal Kurlaender University of California, Davis Policy Analysis for California Education March 16, 2012 This research
MTH 141 Calculus 1 Syllabus Spring 2017
 Instructor: Section/Meets Office Hrs: Textbook: Calculus: Single Variable, by Hughes-Hallet et al, 6th ed., Wiley. Also needed: access code to WileyPlus (included in new books) Calculator: Not required,
Mathematics. Mathematics
 Mathematics Program Description Successful completion of this major will assure competence in mathematics through differential and integral calculus, providing an adequate background for employment in
JOB OUTLOOK 2018 NOVEMBER 2017 FREE TO NACE MEMBERS $52.00 NONMEMBER PRICE NATIONAL ASSOCIATION OF COLLEGES AND EMPLOYERS
 NOVEMBER 2017 FREE TO NACE MEMBERS $52.00 NONMEMBER PRICE JOB OUTLOOK 2018 NATIONAL ASSOCIATION OF COLLEGES AND EMPLOYERS 62 Highland Avenue, Bethlehem, PA 18017 www.naceweb.org 610,868.1421 TABLE OF CONTENTS
EXECUTIVE SUMMARY. Online courses for credit recovery in high schools: Effectiveness and promising practices. April 2017
 EXECUTIVE SUMMARY Online courses for credit recovery in high schools: Effectiveness and promising practices April 2017 Prepared for the Nellie Mae Education Foundation by the UMass Donahue Institute 1
Final. Developing Minority Biomedical Research Talent in Psychology: The APA/NIGMS Project
 Final Report Developing Minority Biomedical Research Talent in Psychology: A Collaborative and Systemic Approach for Strengthening Institutional Capacity for Recruitment, Retention, Training, and Research
Graduate Division Annual Report Key Findings
 Graduate Division 2010 2011 Annual Report Key Findings Trends in Admissions and Enrollment 1 Size, selectivity, yield UCLA s graduate programs are increasingly attractive and selective. Between Fall 2001
Student Support Services Evaluation Readiness Report. By Mandalyn R. Swanson, Ph.D., Program Evaluation Specialist. and Evaluation
 Student Support Services Evaluation Readiness Report By Mandalyn R. Swanson, Ph.D., Program Evaluation Specialist and Bethany L. McCaffrey, Ph.D., Interim Director of Research and Evaluation Evaluation
Hawai i Pacific University Sees Stellar Response Rates for Course Evaluations
 Improvement at heart. CASE STUDY Hawai i Pacific University Sees Stellar Response Rates for Course Evaluations From my perspective, the company has been incredible. Without Blue, we wouldn t be able to
Omak School District WAVA K-5 Learning Improvement Plan
 Omak School District WAVA K-5 Learning Improvement Plan 2015-2016 Vision Omak School District is committed to success for all students and provides a wide range of high quality instructional programs and
Iowa School District Profiles. Le Mars
 Iowa School District Profiles Overview This profile describes enrollment trends, student performance, income levels, population, and other characteristics of the public school district. The report utilizes
ACADEMIC AFFAIRS GUIDELINES
 ACADEMIC AFFAIRS GUIDELINES Section 8: General Education Title: General Education Assessment Guidelines Number (Current Format) Number (Prior Format) Date Last Revised 8.7 XIV 09/2017 Reference: BOR Policy
Miami-Dade County Public Schools
 ENGLISH LANGUAGE LEARNERS AND THEIR ACADEMIC PROGRESS: 2010-2011 Author: Aleksandr Shneyderman, Ed.D. January 2012 Research Services Office of Assessment, Research, and Data Analysis 1450 NE Second Avenue,
What is related to student retention in STEM for STEM majors? Abstract:
 What is related to student retention in STEM for STEM majors? Abstract: The purpose of this study was look at the impact of English and math courses and grades on retention in the STEM major after one
BENCHMARK TREND COMPARISON REPORT:
 National Survey of Student Engagement (NSSE) BENCHMARK TREND COMPARISON REPORT: CARNEGIE PEER INSTITUTIONS, 2003-2011 PREPARED BY: ANGEL A. SANCHEZ, DIRECTOR KELLI PAYNE, ADMINISTRATIVE ANALYST/ SPECIALIST
Teacher Supply and Demand in the State of Wyoming
 Teacher Supply and Demand in the State of Wyoming Supply Demand Prepared by Robert Reichardt 2002 McREL To order copies of Teacher Supply and Demand in the State of Wyoming, contact McREL: Mid-continent
Psychometric Research Brief Office of Shared Accountability
 August 2012 Psychometric Research Brief Office of Shared Accountability Linking Measures of Academic Progress in Mathematics and Maryland School Assessment in Mathematics Huafang Zhao, Ph.D. This brief
Results In. Planning Questions. Tony Frontier Five Levers to Improve Learning 1
 Key Tables and Concepts: Five Levers to Improve Learning by Frontier & Rickabaugh 2014 Anticipated Results of Three Magnitudes of Change Characteristics of Three Magnitudes of Change Examples Results In.
U VA THE CHANGING FACE OF UVA STUDENTS: SSESSMENT. About The Study
 About The Study U VA SSESSMENT In 6, the University of Virginia Office of Institutional Assessment and Studies undertook a study to describe how first-year students have changed over the past four decades.
The following resolution is presented for approval to the Board of Trustees. RESOLUTION 16-
 1. Adoption of Wright State 2016 Campus Completion Plan The following resolution is presented for approval to the Board of Trustees. RESOLUTION 16- WHEREAS, Section 3345.81 of the Ohio Revised Code requires
Syllabus ENGR 190 Introductory Calculus (QR)
") Syllabus ENGR 190 Introductory Calculus (QR) Catalog Data: ENGR 190 Introductory Calculus (4 credit hours). Note: This course may not be used for credit toward the J.B. Speed School of Engineering B. S.
Syllabus ENGR 190 Introductory Calculus (QR) Catalog Data: ENGR 190 Introductory Calculus (4 credit hours). Note: This course may not be used for credit toward the J.B. Speed School of Engineering B. S.
ECON 365 fall papers GEOS 330Z fall papers HUMN 300Z fall papers PHIL 370 fall papers
 Assessing Critical Thinking in GE In Spring 2016 semester, the GE Curriculum Advisory Board (CAB) engaged in assessment of Critical Thinking (CT) across the General Education program. The assessment was
School Leadership Rubrics
 School Leadership Rubrics The School Leadership Rubrics define a range of observable leadership and instructional practices that characterize more and less effective schools. These rubrics provide a metric
Enrollment Trends. Past, Present, and. Future. Presentation Topics. NCCC enrollment down from peak levels
 Presentation Topics 1. Enrollment Trends 2. Attainment Trends Past, Present, and Future Challenges & Opportunities for NC Community Colleges August 17, 217 Rebecca Tippett Director, Carolina Demography
World s Best Workforce Plan
 2017-18 World s Best Workforce Plan District or Charter Name: PiM Arts High School, 4110-07 Contact Person Name and Position Matt McFarlane, Executive Director In accordance with Minnesota Statutes, section
Kahului Elementary School
 Kahului Elementary Code: 405 Status and Improvement Report Year 2014-15 Focus On Standards Grades K-5 Focus on Standards Description Contents Setting Student Profile Community Profile Improvement Summary
Undergraduates Views of K-12 Teaching as a Career Choice
 Undergraduates Views of K-12 Teaching as a Career Choice A Report Prepared for The Professional Educator Standards Board Prepared by: Ana M. Elfers Margaret L. Plecki Elise St. John Rebecca Wedel University
Chaffey College Program Review Report
 Program Review Title: Program Code: Review Type: Type: Chaffey College Program Review Report Accounting, Financial Services, and Real Estate 502 - ACCOUNTING AND FINANCIAL SERVICES Instructional SLO's
Volunteer State Community College Strategic Plan,
 Volunteer State Community College Strategic Plan, 2005-2010 Mission: Volunteer State Community College is a public, comprehensive community college offering associate degrees, certificates, continuing
BASIC EDUCATION IN GHANA IN THE POST-REFORM PERIOD
 BASIC EDUCATION IN GHANA IN THE POST-REFORM PERIOD By Abena D. Oduro Centre for Policy Analysis Accra November, 2000 Please do not Quote, Comments Welcome. ABSTRACT This paper reviews the first stage of
A Diverse Student Body
 A Diverse Student Body No two diversity plans are alike, even when expressing the importance of having students from diverse backgrounds. A top-tier school that attracts outstanding students uses this
For the Ohio Board of Regents Second Report on the Condition of Higher Education in Ohio
 Facilities and Technology Infrastructure Report For the Ohio Board of Regents Second Report on the Condition of Higher Education in Ohio Introduction. As Ohio s national research university, Ohio State
Foothill College Summer 2016
 Foothill College Summer 2016 Intermediate Algebra Math 105.04W CRN# 10135 5.0 units Instructor: Yvette Butterworth Text: None; Beoga.net material used Hours: Online Except Final Thurs, 8/4 3:30pm Phone:
Intermediate Algebra
 Intermediate Algebra An Individualized Approach Robert D. Hackworth Robert H. Alwin Parent s Manual 1 2005 H&H Publishing Company, Inc. 1231 Kapp Drive Clearwater, FL 33765 (727) 442-7760 (800) 366-4079
Math 181, Calculus I
 Math 181, Calculus I [Semester] [Class meeting days/times] [Location] INSTRUCTOR INFORMATION: Name: Office location: Office hours: Mailbox: Phone: Email: Required Material and Access: Textbook: Stewart,
Effective practices of peer mentors in an undergraduate writing intensive course
 Effective practices of peer mentors in an undergraduate writing intensive course April G. Douglass and Dennie L. Smith * Department of Teaching, Learning, and Culture, Texas A&M University This article
Introduction: SOCIOLOGY AND PHILOSOPHY
 Introduction: SOCIOLOGY AND PHILOSOPHY I. Unit Information UNIT SOCIOLOGY AND PHILOSOPHY YEAR 1 Current Year YEAR 3 YEAR 4 Contact Person MARLENE GALLARDE 2014-15 2015-16 2016-17 2017-18 E-mail / Extension
UDW+ Student Data Dictionary Version 1.7 Program Services Office & Decision Support Group
 UDW+ Student Data Dictionary Version 1.7 Program Services Office & Decision Support Group 1 Table of Contents Subject Areas... 3 SIS - Term Registration... 5 SIS - Class Enrollment... 12 SIS - Degrees...
EFFECTS OF MATHEMATICS ACCELERATION ON ACHIEVEMENT, PERCEPTION, AND BEHAVIOR IN LOW- PERFORMING SECONDARY STUDENTS
 EFFECTS OF MATHEMATICS ACCELERATION ON ACHIEVEMENT, PERCEPTION, AND BEHAVIOR IN LOW- PERFORMING SECONDARY STUDENTS Jennifer Head, Ed.S Math and Least Restrictive Environment Instructional Coach Department
ACADEMIC AFFAIRS CALENDAR
 ACADEMIC AFFAIRS CALENDAR 2017-2018 DUE DATE FALL 2017 TASKS RESPONSIBLE Friday, August 11 IELM Deadline for Deans to rank IELM cluster requests. Monday, August 14 Deadline for Faculty to Accept Temporary
Financing Education In Minnesota
 Financing Education In Minnesota 2016-2017 Created with Tagul.com A Publication of the Minnesota House of Representatives Fiscal Analysis Department August 2016 Financing Education in Minnesota 2016-17
Delaware Performance Appraisal System Building greater skills and knowledge for educators
 Delaware Performance Appraisal System Building greater skills and knowledge for educators DPAS-II Guide for Administrators (Assistant Principals) Guide for Evaluating Assistant Principals Revised August
Cuero Independent School District
 Cuero Independent School District Texas Superintendent: Henry Lind Primary contact: Debra Baros, assistant superintendent* 1,985 students, prek-12, rural District Description Cuero Independent School District
Comprehensive Program Review Report (Narrative) College of the Sequoias
 College of the Sequoias") Program Review - Child Development Comprehensive Program Review Report (Narrative) College of the Sequoias Program Review - Child Development Prepared by: San Dee Hodges, Rebecca Griffith, Gwenette Aytman
Program Review - Child Development Comprehensive Program Review Report (Narrative) College of the Sequoias Program Review - Child Development Prepared by: San Dee Hodges, Rebecca Griffith, Gwenette Aytman
The University of North Carolina Strategic Plan Online Survey and Public Forums Executive Summary
 The University of North Carolina Strategic Plan Online Survey and Public Forums Executive Summary The University of North Carolina General Administration January 5, 2017 Introduction The University of
New Jersey Institute of Technology Newark College of Engineering
 New Jersey Institute of Technology Newark College of Engineering AND IN ELECTRICAL AND COMPUTER ENGINEERING Program Review Last Update: Nov. 23, 2005 MISSION STATEMENTS DOCTOR OF PHILOSOPHY IN ELECTRICAL
Lesson M4. page 1 of 2
 Lesson M4 page 1 of 2 Miniature Gulf Coast Project Math TEKS Objectives 111.22 6b.1 (A) apply mathematics to problems arising in everyday life, society, and the workplace; 6b.1 (C) select tools, including
South Carolina English Language Arts
 South Carolina English Language Arts A S O F J U N E 2 0, 2 0 1 0, T H I S S TAT E H A D A D O P T E D T H E CO M M O N CO R E S TAT E S TA N DA R D S. DOCUMENTS REVIEWED South Carolina Academic Content
ARTICLE XVII WORKLOAD
 ARTICLE XVII WORKLOAD 17.1 The normal college workload for unit based instructors per academic semester shall be the equivalent of fifteen (15) semester units of undergraduate instruction. The normal college
Alpha provides an overall measure of the internal reliability of the test. The Coefficient Alphas for the STEP are:
 Every individual is unique. From the way we look to how we behave, speak, and act, we all do it differently. We also have our own unique methods of learning. Once those methods are identified, it can make
GUIDE TO EVALUATING DISTANCE EDUCATION AND CORRESPONDENCE EDUCATION
 GUIDE TO EVALUATING DISTANCE EDUCATION AND CORRESPONDENCE EDUCATION A Publication of the Accrediting Commission For Community and Junior Colleges Western Association of Schools and Colleges For use in
CALCULUS III MATH
 CALCULUS III MATH 01230-1 1. Instructor: Dr. Evelyn Weinstock Mathematics Department, Robinson, Second Floor, 228E 856-256-4500, ext. 3862, email: weinstock@rowan.edu Days/Times: Monday & Thursday 2:00-3:15,
Executive Summary. Belle Terre Elementary School
 Flagler County School District Dr. TC Culver, Principal 5545 Belle Terre Pkwy Palm Coast, FL 32137-3847 Document Generated On February 6, 2013 TABLE OF CONTENTS Introduction 1 Description of the School
SOUTHERN MAINE COMMUNITY COLLEGE South Portland, Maine 04106
 SOUTHERN MAINE COMMUNITY COLLEGE South Portland, Maine 04106 Title: Precalculus Catalog Number: MATH 190 Credit Hours: 3 Total Contact Hours: 45 Instructor: Gwendolyn Blake Email: gblake@smccme.edu Website:
Coming in. Coming in. Coming in
 212-213 Report Card for Glenville High School SCHOOL DISTRICT District results under review by the Ohio Department of Education based upon 211 findings by the Auditor of State. Achievement This grade combines
National Survey of Student Engagement Spring University of Kansas. Executive Summary
 National Survey of Student Engagement Spring 2010 University of Kansas Executive Summary Overview One thousand six hundred and twenty-one (1,621) students from the University of Kansas completed the web-based
GRANT WOOD ELEMENTARY School Improvement Plan
 GRANT WOOD ELEMENTARY 2014-15 School Improvement Plan Building Leadership Team Cindy Stock and Nicole Shaw, BLT Co-Chairs Lisa Johnson, Kindergarten Liz Altemeier, First Grade Megan Goldensoph, Third Grade
African American Male Achievement Update
 Report from the Department of Research, Evaluation, and Assessment Number 8 January 16, 2009 African American Male Achievement Update AUTHOR: Hope E. White, Ph.D., Program Evaluation Specialist Department
SPORTS POLICIES AND GUIDELINES
 April 27, 2010 SPORTS POLICIES AND GUIDELINES I. POLICY AND INTENT A. Eligibility Residents of Scarsdale and the Mamaroneck Strip ( residents of Scarsdale ) and students who attend the Scarsdale Public
Governors and State Legislatures Plan to Reauthorize the Elementary and Secondary Education Act
 Governors and State Legislatures Plan to Reauthorize the Elementary and Secondary Education Act Summary In today s competitive global economy, our education system must prepare every student to be successful
Math 96: Intermediate Algebra in Context
 : Intermediate Algebra in Context Syllabus Spring Quarter 2016 Daily, 9:20 10:30am Instructor: Lauri Lindberg Office Hours@ tutoring: Tutoring Center (CAS-504) 8 9am & 1 2pm daily STEM (Math) Center (RAI-338)
JFK Middle College. Summer & Fall 2014
 J F K M I D D L E C O L L E G E H I G H S C H O O L I M P O R T A N T D A T E S JFK Middle College May 20: 10th Grade Awards Assembly May 21: 11th Grade Awards Assembly; 12th Grade Awards Ceremony, 6pm
Program Change Proposal:
 Program Change Proposal: Provided to Faculty in the following affected units: Department of Management Department of Marketing School of Allied Health 1 Department of Kinesiology 2 Department of Animal
HIGHLAND HIGH SCHOOL CREDIT FLEXIBILITY PLAN
 HIGHLAND HIGH SCHOOL CREDIT FLEXIBILITY PLAN TABLE OF CONTENTS Overview 1 Eligible Credit Flexibility Plans 2 Earned Credit from Credit Flexibility Plans 2 Student Athletes 3 Application Process 3 Final