How Do Rurality and Poverty Moderate the Relationship Between School Size and Student Achievement?
|
|
|
- Colin Bond
- 6 years ago
- Views:
Transcription
1 How Do Rurality and Poverty Moderate the Relationship Between School Size and Student Achievement? The Harvard community has made this article openly available. Please share how this access benefits you. Your story matters. Citation Accessed Citable Link Terms of Use Orzech, Aaron How Do Rurality and Poverty Moderate the Relationship Between School Size and Student Achievement?. Doctoral dissertation, Harvard Graduate School of Education. December 20, :34:21 PM EST This article was downloaded from Harvard University's DASH repository, and is made available under the terms and conditions applicable to Other Posted Material, as set forth at (Article begins on next page)
2 How Do Rurality and Poverty Moderate the Relationship Between School Size and Student Achievement? Qualifying Paper Submitted by Aaron Orzech Harvard Graduate School of Education October 14, 2016
3 DRAFT DO NOT CITE OR CIRCULATE Acknowledgements I am indebted to the following people for their help with this paper: Meg Nipson and Jon Fullerton at the Center for Education Policy Research, for assistance in obtaining the data and the necessary approvals to undertake this project. My Qualifying Paper committee chair, Daniel Koretz, and readers, Martin West and Joshua Goodman, for reviewing and offering helpful comments on multiple drafts of this paper. My parents, my wife, and classmates at the Harvard Graduate School of Education, Bonnie Mackintosh and Maleka Donaldson Gramling, also for reading and offering helpful comments on drafts of this paper. All mistakes are my own. 1
4 DRAFT DO NOT CITE OR CIRCULATE Contents Abstract... 3 Introduction... 3 Background... 4 Theoretical Background on School Size... 4 Inconsistent Empirical Findings on School Size and Achievement... 6 Data and Research Design Data and Sample Measures and Summary Statistics Outcome variables Predictors Data Analytic Plan Models Sensitivity tests Results Descriptive Statistics and Pairwise Correlations Regression Analyses Math gains English gains Sensitivity Tests Discussion Math Gains: How Rurality and FRPL Percentage Moderate the Effect of School Size34 English Gains: Findings on the Effect of School Size may not Generalize Across Subjects Consequences of Substituting the EXPLORE test for the KCCT Limitations Conclusions and Policy Implications References
5 DRAFT DO NOT CITE OR CIRCULATE Abstract Many have proposed that school size has an important role in improving student outcomes, but empirical findings about the shape and direction of the relationship between school size and achievement have been inconsistent. I propose that inconsistent findings from past studies may be partly explained by the failure of those studies to allow a three-way interaction of school size, poverty, and rurality. Specifically, I hypothesize that the most negative relationship between school size and achievement is in schools that are both poor and rural, and test this hypothesis using longitudinal data on math and English achievement for three cohorts of Kentucky high school students. Consistent with my hypothesis, I find the association between school size and math learning to be most negative in higher poverty rural schools. I also find that a misleading picture of the overall relationship emerges when these are pooled with other schools. While this finding bears on discussion of rural school consolidations, and may explain some inconsistencies in past literature, it also suggests that the importance of school size is highly context dependent. Further, my results for English do not support my hypothesis, suggesting that the importance of size may differ by subject area. Therefore, a general answer to how school size associates with student achievement remains elusive. Introduction There are reasons to believe that changing the size of schools holds promise as a strategy for educational improvement, and many attempts have been made to use school size as a policy lever. A number of urban districts have recently broken up large high schools into smaller ones, while the historical trend in rural areas has been toward 3
6 DRAFT DO NOT CITE OR CIRCULATE consolidation. The relationship between school size and student achievement, however, remains unclear. First, there is disagreement about the direction of association between achievement and school size. Some studies find a positive association between school size and average student outcomes, while others find exactly the opposite. Still other studies find a parabola-shaped relationship, and these studies disagree on the fundamental question of whether medium sized schools are minimally or maximally effective. Review of studies finding that geographic and socio-economic factors moderate the association of school size with achievement suggests that inconsistent findings may be partly due to compositional differences between samples in these moderating variables or to the failure of some studies to consider them. However, the extant research is inadequate to fully resolve these inconsistencies. I conduct a series of analyses investigating how rurality and school Free-and- Reduced Price Lunch eligibility (FRPL) percentage moderate the relationship of school size with score gains. In so doing, I attempt to reconcile inconsistent findings about the association between school size and learning outcomes. Background Theoretical Background on School Size Theoretical literature on school size offers cases both for making schools larger, and for making schools smaller. The general terms of the contemporary debate on school 4
7 DRAFT DO NOT CITE OR CIRCULATE size trace back to two seminal arguments. First, Conant and Gardner s (1959) argument that larger comprehensive schools can offer more diverse curricula, and also economies of scale. Following Conant and Gardner (1959), others have argued for consolidating schools, especially rural schools, in order to realize both economic and academic benefits similar to those that Conant and Gardner (1959) proposed (e.g. Adams & Foster, 2002; Andrews, Duncombe & Yinger, 2002; Blaukamp, Longo & Anderson, 2011). Barker and Gump (1964) offered a countervailing line of argument advocating for smaller schools on the basis that they promote broader and deeper student engagement. Recent variations on this argument have included Meier s (2002) advocacy for smaller urban schools and Tieken s (2014) advocacy for smaller rural schools, as being better able to nurture both scholars and citizens. Although contradictory, this literature is unified in making clear that school size is thought to matter not for its own sake, but because of other school characteristics that it can enable or impair. The literature also suggests that the effect of school size may be context dependent. Meier s (2002) and Tieken s (2014) works suggest that school size may matter in urban or rural settings for reasons that are specific to those contexts. Friedkin and Necochea (1988) proposed that the effect of school size could depend on schools socio-economic levels, because wealthier schools may be more able to take advantage of the benefits of larger size. Both a broader literature review, and a consideration of the characteristics of rural areas, offer a rationale for hypothesizing a three-way interaction between poverty, size, and rurality, and specifically that size may have its strongest 5
8 DRAFT DO NOT CITE OR CIRCULATE negative association with learning outcomes in schools that are both poor and rural. I am aware of no prior work that explicitly proposes this hypothesis. One strand of research suggests that small size may promote learning more in rural than in non-rural areas because it is more important for school community integration in rural areas. Tieken (2014) illustrates the important role that small size plays in strengthening within-school communities in rural schools, and Isserman (2005) points out that a key feature of rural areas is low population density, meaning that larger size weakens community ties more in rural schools because the populations being served are more geographically dispersed than those in more densely settled locales. A second strand of research has found that measures of school community strength associate more strongly with measures of academic engagement in higher FRPL schools (Battistich, Solomon, Kim, Watson & Schaps, 1995). Taken together, these two strands suggest an interaction of rurality and poverty in exacerbating negative effects of larger size. A further disadvantage specific to large schools in sparsely populated areas is longer travel time, which results in less time for sleeping, studying, and taking part in extracurricular activities. These negative effects of larger size could be stronger for rural schools with higher percentages of students who are already disadvantaged by factors associated with poverty (e.g. Nelson & Sheridan, 2011). Inconsistent Empirical Findings on School Size and Achievement Findings about the relationship between school size and learning outcomes are inconsistent and contradictory, and this inconsistency is present across studies that use 6
9 DRAFT DO NOT CITE OR CIRCULATE score levels and studies that use score gains or covariate adjusted levels as outcomes (Appendix A). Studies find, variously, positive and negative unidirectional relationships, and U-shaped and inverted-u-shaped relationships. Monotonically positive effects of size on average achievement levels were found in several studies (e.g. Huang & Howley, 1993; McMillen, 2004; Schreiber, 2002), while other studies have found monotonically negative effects of size on average achievement levels (e.g. Coladarci, 2006; Fowler & Walberg, 1991). Lee and Smith (1997) examined learning gains using the NELS:88 data, observing an inverted-u-shaped relationship between 8 th -12 th grade achievement gains and school size, such that the largest average gains were observed in medium sized schools. Werblow and Duesbery (2009) also analyzed gains using the ELS:2002 data, but contrary to Lee and Smith (1997) found a U-shaped relationship between 10 th -12 th grade achievement gains and school size, with the smallest gains in medium sized schools. There are two general types of discrepancies to be explained: first, those between studies finding positive and negative monotonic associations of size with outcomes, and second, those between studies finding U and inverted-u shaped associations. The first could be due to failure to use a specification that would allow for a reversal of sign. Of the studies with monotonic findings cited above, only McMillen (2004) explicitly tested and rejected a quadratic term. Huang and Howley (1993) used a three-level categorical variable that theoretically could detect a reversal of sign, although their largest category included any school with more than 60 students per grade. Sign discrepancies across monotonic findings could also be due to sample differences if the relationship were truly monotonic within particular samples even though the general relationship was not. 7
10 DRAFT DO NOT CITE OR CIRCULATE Furthermore, these discrepancies could also occur if unobserved moderators of the relationship between size and outcomes are differentially present in different samples. Such moderators may also help to explain the second type of discrepancy, between U- and inverted-u-shaped findings. Recent research suggests that discrepancies between U and inverted-u shaped findings may reflect moderation by type of locale. Crispin (2015) subdivided the NELS:88 data into rural, urban, and suburban subsamples, and found a U-shaped relationship between size and gains in the rural and urban groups, but an inverted-ushaped relationship in the suburban group 1. The relationship between size and learning gains in the pooled sample had an inverted-u-shape, corresponding with Lee and Smith s (1997) findings using the same data, but suggesting that Lee and Smith s specification was overly restrictive in not allowing the effect of size to vary by locale. Other literature, which has found linear relationships between school size and achievement, suggests that school socio-economic characteristics moderate the effect of school size (e.g. Howley, 1996; McMillen, 2004; Howley & Bickel, 1999; Johnson, Howley & Howley, 2002). A large group of studies using school-level data has documented an interaction between school socio-economic measures and size in predicting average school score levels, with school FRPL eligibility percentage the most common socio-economic (or economic) measure used in these studies (Appendix A). 1 A further difference is that rural schools exhibited the smallest gains around 1,100 students, and urban schools around 2,100 students, while suburban schools exhibited maximal gains around 2,000 students. 8
11 DRAFT DO NOT CITE OR CIRCULATE Although these studies came to inconsistent conclusions about the sign of the main effect of school size on achievement, they were consistent in finding a negative interaction between socio-economic disadvantage and school size in predicting achievement: Many of these studies found a positive relationship between size and outcomes for more affluent schools, and a negative relationship for less affluent schools. Those that found a positive association for all schools found it to be more positive for more affluent schools, and those that found a negative association found it to be more negative for poorer schools. This moderating effect could cause socio-economic differences across samples to lead to differences in the sign of the observed effect of school size. A final question, not yet addressed in the literature, is whether the interaction of size and socio-economic factors operates differently in rural and non-rural areas. Although Crispin s (2015) location-specific models included controls for school characteristics, she separately tested only the main effects of school size and FRPL percentage in rural and non-rural settings. She did not offer an explicit comparison between the coefficients for FRPL in rural and non-rural settings 2. She also did not test an interaction of school size and FRPL percentage in either setting. This paper contributes to the empirical literature by replicating the portion of Crispin s (2015) analysis distinguishing rural from non-rural schools, and in doing so extending and improving upon that study and earlier research in three ways. 2 The range of the outcome score is from 16 to 73. Crispin s production function coefficient for %FRPL was (se=1.523) for urban, and (se=1.143) for rural schools. It was not reported whether the difference between these coefficients was statistically significant. 9
12 DRAFT DO NOT CITE OR CIRCULATE First, Crispin s (2015) NELS:88 data are over twenty-five years old, with farreaching reform and change in the intervening period, which may make her results less externally valid. I use data on students who graduated between 2011 and Second, Crispin (2015) did not integrate findings on locale as a moderator of school size with findings on FRPL concentration as a moderator of school size. To develop a more complete understanding of what moderates the school size-learning relationship, I allow a three-way interaction of school size with FRPL percentage and rurality, thus investigating whether the main effect of FRPL percentage and its interaction with school size operate differently in rural and non-rural settings 3. Third, by using 8 th -11 th grade score gains (in math and English) as my outcome, I avoid two problems that may be present in some earlier studies. The first is that studies using high school scores as an outcome without any adjustment for prior performance cannot associate high school size with effectiveness. A second problem is with studies that use prior scores as covariates and later scores as outcomes. Lord (1969) demonstrated that when an outcome correlates imperfectly with a lagged measure, such models can produce biased and misleading estimates of group differences in change. 3 My geographic analysis is more limited than Crispin s (2015), dividing my sample only into rural and non-rural categories, rather than rural, urban, and intermediate categories. Changes in how locale is coded since the NELS:88 data were collected (Isserman, 2005) create challenges to reproducing earlier categories that are beyond the scope of this paper. 10
13 DRAFT DO NOT CITE OR CIRCULATE Lord s Paradox, as it is known, results from regression to the mean, whereby outcomes for groups with lower observed scores regress upward toward the grand mean, while those for groups with higher observed scores regress downward. Further, such covariate adjusted models support inferences about conditional status, rather than about gains (Castellano & Ho, 2012), which are the object of this study. Thus, in this paper, I address four research questions: 1: In my sample, how does high school size predict score gains in math and English when its effect is not allowed to vary with school characteristics? Is the relationship linear or curvilinear, and if curvilinear is it monotonic? 2: Does high school size predict score gains in math and English differently depending on whether schools are located in rural or non-rural areas? 3: Does high school size predict score gains in math and English differently depending on school FRPL eligibility concentration? 4: Is there a difference between rural and non-rural schools in how FRPL eligibility concentration moderates the relationship between school size, and score gains in math and English? 11
14 DRAFT DO NOT CITE OR CIRCULATE The fourth question addresses my hypothesis that the relationship between school size and learning is most negative in schools that are both poor and rural. I ask the first three questions to provide a basis for ascertaining whether and how inconsistent results could arise between investigations that constrain the relationship between school size and learning to be the same for all schools (Question 1), for all schools regardless of poverty concentration (Question 2), or for all schools regardless of locale (Question 3). I expect these three questions to yield results similar to those obtained by earlier studies that asked them: The inconsistency of previous literature offers little guidance with regard to the first question. For the second question, Crispin s (2015) results suggest that I will find a relatively strong U-shaped relationship for rural schools. For the third question, earlier studies (e.g. Howley & Bickel, 1999) suggest that I will find a relatively negative relationship for poorer schools and a relatively positive relationship for less poor schools. My more general expectation is that my first three questions will yield inconsistent pictures of how school size relates to learning, and that allowing a three-way interaction of school size, poverty, and rurality will help to resolve this inconsistency. I also expect this to suggest reasons why past studies may have had inconsistent findings. Data and Research Design Data and Sample I use longitudinal data on three cohorts of Kentucky high school students who started ninth grade between 2008 and Kentucky is an ideal state in which to study the relationship between school size, poverty, and rurality, because it has large rural and non-rural sectors, and both exhibit wide variation in the size and poverty level of their 12
15 DRAFT DO NOT CITE OR CIRCULATE schools. My dataset contains 122,833 students who attended 230 high schools. This represents a 9% sample reduction after eliminating schools serving special populations (such as schools located in detention centers and hospitals, and transfer schools), and schools to which no students could be matched for both ninth and twelfth grade because they opened during the period of data collection. In my main models I also exclude the outcomes of the 10% of students whose first and last high school differ. I perform a sensitivity check, which I describe below, to evaluate the effect of excluding these students. An additional 14% of the remaining sample is excluded from my models because of missing scores in 8 th grade scores, 11 th grade scores, or both. Final models for math gains use 94,518 students with non-missing 8 th and 11 th grade scores, and models for English gains use 94,521 students with non-missing 8 th and 11 th grade test scores. In my analyses presented below all variables are school characteristics, such as rurality, or school means of student characteristics, such as FRPL eligibility percentage. Descriptive statistics for variables at the student level, prior to being aggregated to the school level, are provided in Appendix Table C1, and correlations in Appendix Table C2. Measures and Summary Statistics Outcome variables. My outcome variables are the school means of two difference scores constructed by subtracting each student s eighth grade KCCT score from eleventh grade ACT component score for math and for English, with all scores standardized within grade and year prior to differencing to have mean zero and unit variance. All eleventh grade students in Kentucky are required to take the ACT. For eighth grade two tests are 13
16 DRAFT DO NOT CITE OR CIRCULATE available for each of math and English: the KCCT tests, which are used for official accountability purposes, and the EXPLORE tests, which are not. I use the KCCT in my main analyses because they are of greater interest to policy makers, and conduct sensitivity checks using alternate difference scores constructed using the EXPLORE math and English tests. Although, for convenience, I refer to these difference scores as measuring score gains, I note that differences between standardized scores do not measure absolute growth, but rather gains or losses in students relative positions in the score distribution. Distributions of the difference scores for math and English are provided in Appendix B at the student level (Figures B1 and B2) and at the school level (Figures B3 and B4). While the distributions of difference scores have effectively symmetrical bellshapes, the KCCT math and reading distributions exhibit considerable ceiling and floor effects, leading to censoring of scores for the highest and lowest performing students (Appendix Figures B9 and B12). I choose to include them in my main analyses in spite of lacking information about their exact position in their respective tails of the distributions. I conduct a sensitivity test, described below, to evaluate the consequences of including these students. I also note that excluding these students would have little observable effect on the distributions of the difference scores that serve as my outcomes, which can be seen by comparing Appendix Figures B3 and B15 for math, and Appendix Figures B4 and B16 for English. 14
17 DRAFT DO NOT CITE OR CIRCULATE Predictors. Enrollment. My main question predictor, and my measure of school size, is each school s estimated average annual enrollment during the period that the ninth grade cohorts of 2008 to 2010 were enrolled. I have to estimate school enrollment because I only have good information about where students start ninth grade and where they graduate from 4 (if they graduate from high school in Kentucky). I estimate total enrollment as follows: For each school I estimate the size of the freshman and senior classes by averaging over the three cohorts, respectively, the number of students who started ninth grade in that school, and the number who graduated from that school. I then interpolate values for tenth and eleventh grade enrollments assuming a linear rate of change in enrollment over the four years of high school; all of the high schools in my sample are grade 9-12 schools. I scale school enrollment so that a difference of one unit corresponds to a substantively meaningful difference of 100 students. Rurality. To measure rurality, I construct a 0/1 indicator using the NCES fourpart locale classification system adopted in 2000 that classifies schools as rural, town, suburban, or urban, classifying schools as rural if they are in the first of these categories. FRPL percentage. I code students as FRPL eligible if they were ever eligible for free or reduced price lunch during high school. I do this to capture more students who may be near the cutoff, qualifying in some years and not others. School FRPL eligibility 4 For students who do not graduate from high school in Kentucky I observe the last high school in which they were enrolled, but I have almost no information about when they were last enrolled. Eleventh grade test scores are missing for the large majority of these students. 15
18 DRAFT DO NOT CITE OR CIRCULATE percentage is the average of the 0/1 FRPL indicators for all students observed in the three ninth grade cohorts and all students observed in the three twelfth grade cohorts. Students who appear in both are therefore counted twice and given more weight. This estimates the FRPL eligibility rate for the entire school based on the assumption that the numbers of FRPL and non-frpl eligible students both change at a linear rate over the four years of high school. Limited English Proficiency. I code students as Limited English Proficient (LEP) if they were ever categorized this way during high school. School LEP percentage is calculated in the same manner as school FRPL percentage, by averaging the 0/1 LEP indicators for all students observed in the three ninth grade cohorts and all students observed in the three twelfth grade cohorts. Data Analytic Plan Models. I address my research questions using a series of increasingly flexible OLS models. Before specifying each of these models I examine LOWESS plots of the relationship between school size and score gains for schools at different levels of the hypothesized moderators. I use these to develop a sense of whether and how the relationship of size and gains varies across levels of the moderator, and what specification is most appropriate to model the relationship. In making the LOWESS plots I partition the sample into rural and non-rural subsets, at the median of FRPL percentage, or both, depending on which research question I am addressing. The models described 16
19 DRAFT DO NOT CITE OR CIRCULATE below are fit on the entire sample, with FRPL eligibility percentage treated as a continuous variable 5. To address my first question about the relationship between gains and size when no moderating variables are considered, and to test whether this relationship is curvilinear, I fit the following model for school j: with, (1) = ~ (0, ) I estimate the average association of size with learning gains using coefficients of interest and, and I report results both with and without controls for FRPL and rurality. For simplicity I present only linear specifications of my subsequent models, although I test a quadratic term in school size and its interactions with other variables as appropriate to model the observed relationships. 5 In Appendix D I also provide results from alternative OLS models fit on the partitioned subsets of the data, presented in the LOWESS plots, for cases in which I divide the sample at the median of FRPL percentage. Results from these models, which are consistent with those from the models described below, are provided in Appendix Tables D1 and D2 along with a brief discussion. 17
20 DRAFT DO NOT CITE OR CIRCULATE To address my second research question, investigating rurality as a moderator of the relationship between school size and score gains, I fit a model that allows the coefficient for school size to differ between rural and non-rural schools: with, (2) = ~ (0, ) The interaction coefficient directly addresses my question of how the effect of school size differs between rural and non-rural schools. To further understand its substantive consequences, I estimate the effect of school size on score gains for non-rural schools using coefficient, and I calculate and report the estimated effect of school size for rural schools as: + For all such linear combinations of coefficients I conduct t-tests of statistical significance using Stata s lincom function (StataCorp, 2013). To address my third research question I fit a model for school j in which the coefficient for size is allowed to vary with school mean FRPL eligibility: (3) =
21 DRAFT DO NOT CITE OR CIRCULATE with, ~ (0, ) and estimate how the slope of score gains on size varies with FRPL percentage using coefficient of interest. I calculate and report the estimated effects of school size at the first and third quartiles (q) of FRPL percentage as: + % _ and the difference between the effects at the first and third quartiles as: (% % ) again using Stata s lincom function to test this estimate for statistical significance (StataCorp, 2013). Finally, to address my fourth research question, I fit a model that allows both the effect of school size and its interaction with school FRPL percentage to differ between rural and non-rural schools: (4) = with, 19
22 DRAFT DO NOT CITE OR CIRCULATE ~ (0, ) and estimate how the interaction of school size and FRPL percentage differs between rural and non-rural areas using the interaction coefficient. To understand the consequences of this I also calculate estimated effects of school size for non-rural and rural schools at the first and third quartiles (q) of FRPL percentage as, respectively: and + % _ ( + ) + ( + ) % _ I also calculate and test the differences in these effects between rural and non-rural schools, and between the first and third quartile for each locale. For English, I also fit a version of this final model that includes LEP percentage as a control variable. Sensitivity tests. I conduct four sensitivity tests: Two concerning test scores, one concerning potential bias, and one concerning the construction of my sample. In each test I make an adjustment to a variable, to my sample, or to my model and re-estimate my final fully interacted specification. I describe the tests below and describe results from these tests at 20
23 DRAFT DO NOT CITE OR CIRCULATE the end of the results section. Detailed results from sensitivity tests, as well as regression diagnostics for my final models, are presented in Appendix E. The first sensitivity test evaluates the sensitivity of my results to my choice of baseline tests by constructing an alternate set of difference scores, substituting eighth grade EXPLORE math and English scores for eighth grade KCCT scores. My second test evaluates the impact of including students whose KCCT scores were distorted by censoring at the bottom and top of the score scales. In this test I delete all scores equal to the highest and lowest obtainable scale scores, and refit the final model for each subject area. My third sensitivity test evaluates possible bias due to non-random attrition of students across schools. Because lower performing students are more likely to drop out, there is likely to be positive selection on outcomes, accompanied by relatively lower enrollment numbers for schools that lose more students. This could lead to smaller schools exhibiting larger learning gains not because of any positive effect associated with size per se, but because schools that lose more low performing students also have lower enrollments. Although my research design cannot support causal claims, ruling out this mechanism still strengthens any conclusion that there is a meaningful relationship between school size and learning. I conduct this test by making two changes to my final model. First, I substitute freshman cohort size for total enrollment in order to remove the effect of attrition from the enrollment counts. Second, I add school retention rate as a 21
24 DRAFT DO NOT CITE OR CIRCULATE continuous predictor variable in order to account for the possibility that attrition rate is correlated with school size. My fourth sensitivity test evaluates the effect of excluding the outcomes of students who transfer between schools (these students are included in head counts for purposes of calculating enrollment, and FRPL and LEP percentages). To do this I refit my final models twice, including all students for whom eighth and eleventh grade scores are available, associating them with, alternately, the first and last high school in which I observe them. Results Descriptive Statistics and Pairwise Correlations Here I describe the distributions of my predictor variables, and their correlations with math and English gains, and with each other. While this provides no information about moderating relationships, it does indicate that there is substantial variation in my predictor variables, and that the predictors are weakly correlated with each other, which are important considerations in undertaking further analysis. Descriptive statistics are provided in Table 1, a correlation matrix in Table 2, and bivariate scatterplots in Appendix Figure C1. I note that in the remainder of this paper all variables are school level means (mean score gains, FRPL, and LEP percentage), or school characteristics 22
25 DRAFT DO NOT CITE OR CIRCULATE (enrollment and rurality). Therefore, terms such as score gains should be understood to refer to school mean score gains. Enrollment. School enrollment has a mean of 828 and a standard deviation of 510 (Table 1). Non-rural schools are, on average, larger than rural schools. The mean nonrural school has 979 students and the mean rural school 674 (Table 1). Comparing the enrollment distributions for rural and non-rural schools, however, indicates that the range is generally similar across both locales (Appendix Figure C2). The only exception is in the right tail of the distribution, where the large majority of schools with enrollments above 1,500 are non-rural. School enrollments range from 36 to 2,293. Enrollment has very weak positive correlations with math gains (r=0.203, p=0.002) and with English gains (r=0.139, p=0.035) (Table 2). FRPL percentage. The overall mean of FRPL percentage is 61% and the standard deviation is 18%, with the mean for rural schools six percentage points higher than for non-rural (Table 1). The range of values is quite similar in rural and non-rural schools (Appendix Figure C3). Higher FRPL schools also tend to be somewhat smaller, as indicated by the negative correlation between FRPL percentage and enrollment (r= , p<0.001) (Table 2). FRPL percentage has moderate negative correlations with math gains (r= , p<0.001) and English gains (r= , p<0.001) (Table 2). 23
26 DRAFT DO NOT CITE OR CIRCULATE The median of FRPL percentage, which I use to partition my sample in my exploratory analyses, is 60.9%. The first quartile of FRPL percentage is 50.5%, and the third quartile is 74.6%. I use these quartiles as representative values in calculating and reporting fitted regression slopes for models testing FRPL as a moderator. Schools below the median of FRPL percentage are 41% rural, while those above the median are 59% rural. Rurality. The indicator for rurality divides the sample almost equally, with 116 non-rural schools and 114 rural schools (Table 1). Rurality has moderate to weak negative correlations with math gains (r= , p<0.001) and English gains (r= , p<0.001) (Table 2). Distributions of difference scores by locale are provided in Appendix Figures B3 and B4. Because school size, FRPL concentration, and rurality are correlated with each other, I add FRPL and rurality as controls even in models where they are not being considered as moderators. I do this both to improve the precision of my estimates, and to estimate the effect of my predictors of interest net of the effect of other observed school characteristics. The distributions of LEP percentage for rural and non-rural schools are provided in Appendix Figure C4. I use this variable only once, to test a hypothesis concerning the results for my final model in English. 24
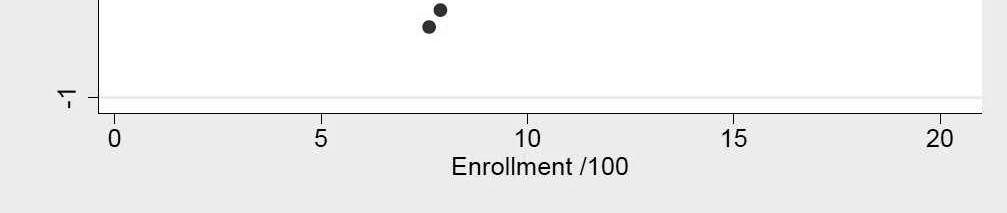
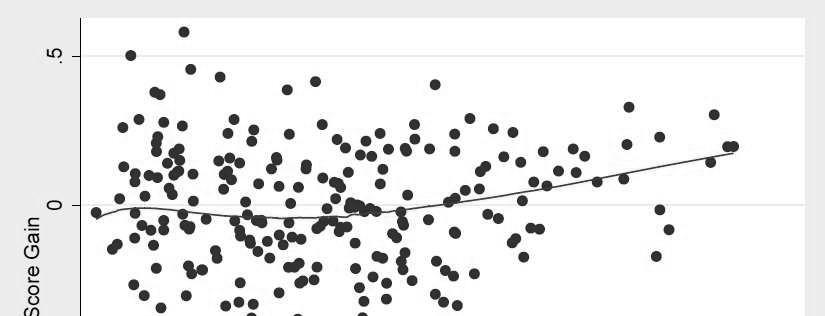
27 DRAFT DO NOT CITE OR CIRCULATE Regression Analyses Math gains. How does high school size predict score gains in math when its effect is not allowed to vary with school characteristics? Is the relationship linear or curvilinear, and if curvilinear is it monotonic? A LOWESS plot of the association between school size and math gains suggests a U-shaped relationship (Figure 1), and regression results corroborate this. A linear specification indicates a slight zero-order relationship (Table 3, column 1), but no relationship after controlling for rurality and FRPL (Table 3, column 2). Results from a quadratic specification find a curvilinear relationship that is robust to controlling for rurality and FRPL percentage (Table 3, columns 3 and 4). A fitted curve from this model indicates that the average relationship for the entire sample slopes upward for schools larger than 1,000 students. For smaller schools, however, the negative slope is effectively negligible, predicting a trivial difference of 0.03sd between schools at the first quartile of enrollment (418 students) and those at the vertex of the parabola 6 (932 students) (Figure 2). Does high school size predict score gains in math differently depending on whether schools are located in rural or non-rural areas? 6 Using the linear and quadratic coefficients reported in Table 3, column 4, and the appropriate school enrollments divided by 100, the calculation is: *( ) *( ) =
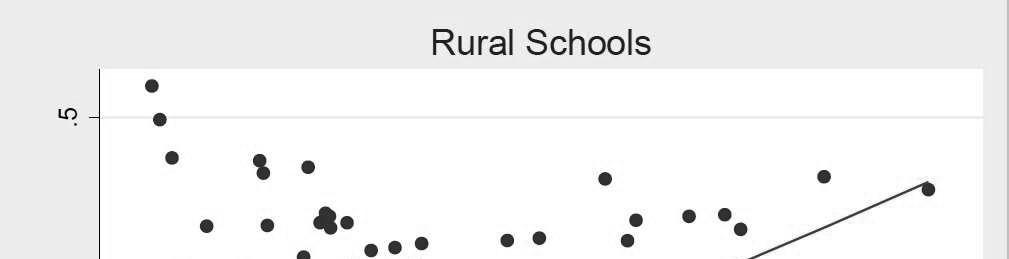
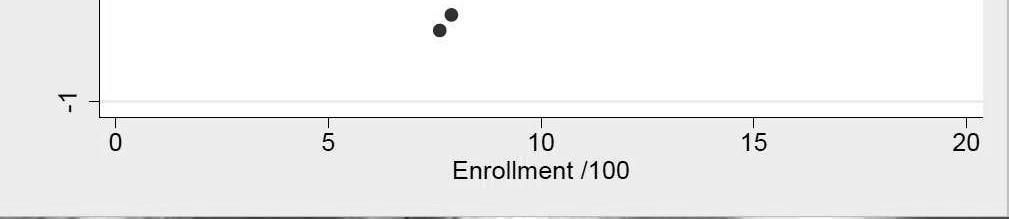
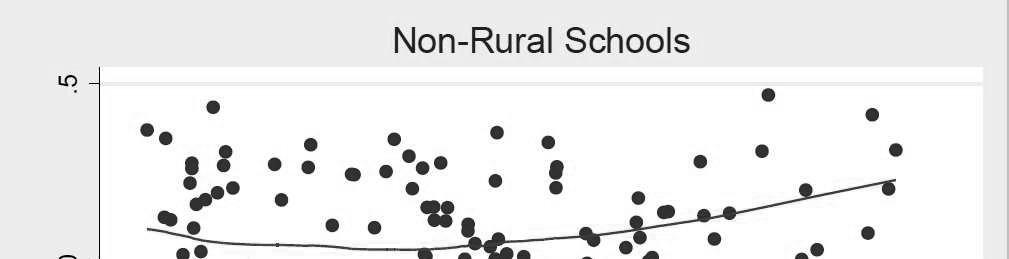
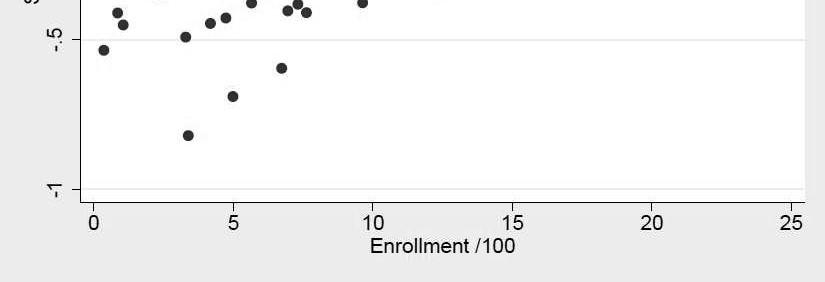
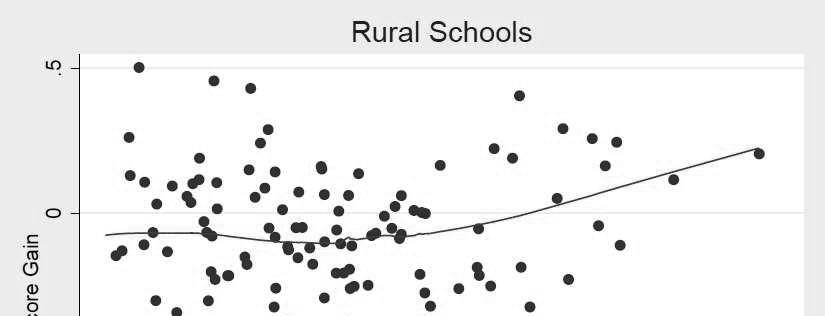
28 DRAFT DO NOT CITE OR CIRCULATE Examining separate LOWESS plots, for rural and non-rural schools, of the relationship between math gains and size suggests that there is a U-shaped relationship in rural schools, and a much weaker relationship in non-rural schools (Figure 3). Based on these plots I select a quadratic specification of a model that allows both linear and quadratic terms for size to differ between rural and non-rural schools 7. As expected based on the LOWESS plots, regression results find substantive interactions between rurality and the linear and quadratic terms for school size (Table 3, columns 5 and 6). After controlling for FRPL percentage the linear interaction is marginally significant (p=0.060), and the quadratic interaction significant (p=0.035) (Table 3, column 6). In substantive terms, there is no appreciable relationship between size and math gains in non-rural schools (Table 4, column 1), while for rural schools there is a U-shaped relationship that slopes downward for rural schools with fewer than 750 students (Figure 4). The linear and quadratic coefficients for rural schools are both statistically significant after controlling for FRPL percentage (p=0.003 for both linear and quadratic rural coefficients) (Table 4, column 2), and predict a small difference of 0.08sd between the predicted score gains in rural schools at the first quartile of rural enrollment (355 students) and at the vertex of the parabola 8 (866 students) (cf. Figure 2). 7 I test and reject a linear specification, which I present in Appendix Table D3, column 1. 8 Using the linear and quadratic coefficients reported in Table 4, column 2, and the appropriate school enrollments divided by 100, the calculation is: *( ) *( ) =
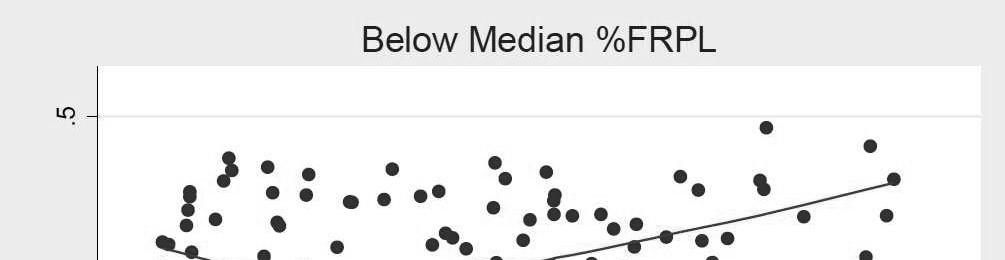
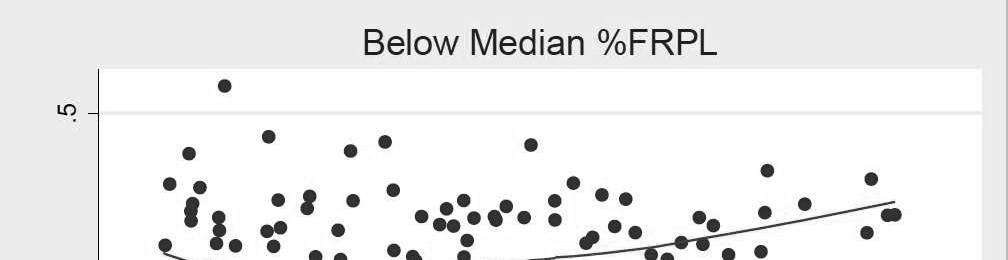
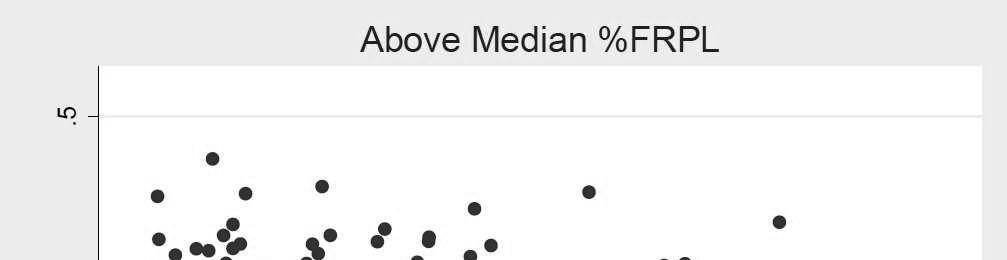
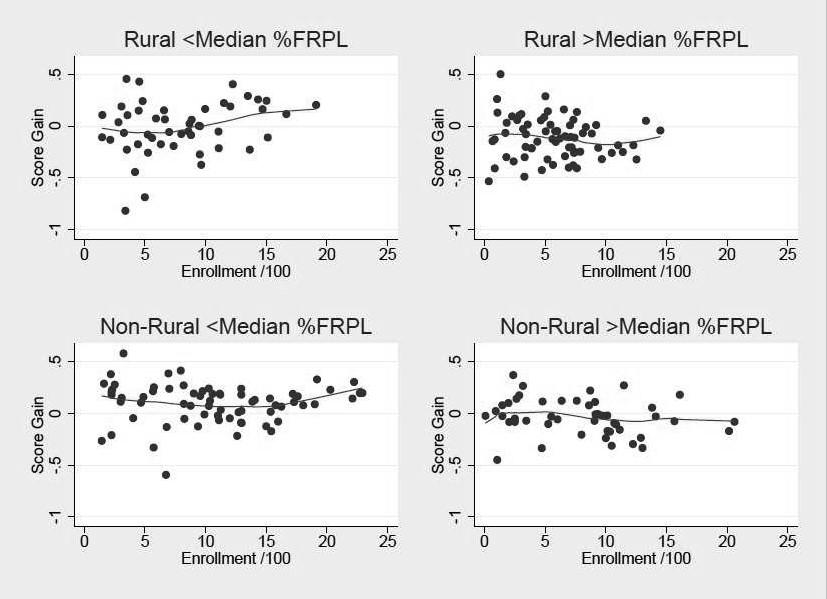
29 DRAFT DO NOT CITE OR CIRCULATE Does high school size predict score gains in math differently depending on school FRPL eligibility concentration? LOWESS plots of the relationship between school size and math gains, for schools below and above the median of FRPL percentage, suggest a weak positive relationship for schools below the median, and no relationship for schools above (Figure 5). Regression results corroborate this inasmuch as they find a negative interaction of school size and FRPL percentage that is stronger after controlling for rurality (-0.041sd, p=0.008) (Table 3, columns 7 and 8). After controlling for rurality, slope estimates at the first and third quartile differ slightly from what the LOWESS plots suggest: I find no appreciable relationship for schools at the first quartile of FRPL percentage, and a trivial (but marginally significant) negative relationship of sd at the third quartile (p=0.075) (Table 5, column 1). Is there a difference between rural and non-rural schools in how FRPL eligibility concentration moderates the relationship between school size and score gains in math? I begin by examining separate LOWESS plots of the relationship between math gains and size for rural and non-rural schools, with each locale partitioned at the overall median of FRPL percentage. The only plot that suggests a substantial relationship is that for the set of 66 rural schools above the median, for which the slope is predominantly 27
30 DRAFT DO NOT CITE OR CIRCULATE negative 9 (Figure 6). I select a linear specification allowing a three-way interaction of school size, FRPL percentage to model this relationship, and reject a quadratic specification that does not offer improved model fit (Appendix Table D3, column 2). Regression results find a negative three-way interaction of school size, FRPL percentage, and rurality (-0.063sd), although it is only marginally significant (p=0.055) (Table 3, column 9). Fitting slopes at the first and third quartile of FRPL percentage for rural and non-rural schools, however, indicates a modest and statistically significant negative association between school size and math gains for rural schools at the third quartile of FRPL, while for lower-frpl rural schools and non-rural schools the slopes are negligible and statistically insignificant. In rural schools at the third quartile of FRPL percentage (74.6%) a 100 student difference in enrollment is associated with a statistically significant sd difference in math gains (p=0.005) (Table 6, column 2). This is two and a half times the magnitude of the slope found when the relationship was not allowed to vary with rurality (cf. Table 5, column 2). Substantively, this predicts a difference in score gains of 0.11sd between schools at the first and third quartiles of rural 9 The LOWESS plot for rural schools with above-median FRPL percentage (Figure 6, upper right cell) indicates a negative slope, but also suggests two considerations: First, four of the five smallest schools have extreme values on the outcome, and second, the two to four largest schools appear to exert an upward influence on the LOWESS line. I find that my results are robust to the removal of these schools from the sample: To investigate their influence I re-fit my main model, and my subgroup model (Appendix Table D1, column 6), after trimming the five largest and smallest above median-frpl rural schools from the sample, and also with one and two additional pairs of the largest and smallest schools removed. Slope estimates from these three restricted-sample models are substantively identical to those from my models fit on the full sample. This indicates that my results accurately represent the overall pattern for above-median FRPL rural schools, and are not driven simply by a small number of schools in the tails of the size distribution. 28
31 DRAFT DO NOT CITE OR CIRCULATE school size 10. The difference between this slope and the fitted slope for rural schools at the first quartile is highly significant (p=0.001) (Table 6, column 2), and its difference from the fitted slope for non-rural schools at the third quartile of FRPL percentage is marginally significant (p=0.055) (Table 6, column 3). I illustrate this results with a plot of fitted lines from this model, contrasting the negative slope for higher-frpl rural schools with the much weaker and statistically insignificant slopes (indicated by dashed lines) for other types of schools (Figure 7). English gains. How does high school size predict score gains in English when its effect is not allowed to vary with school characteristics? Is the relationship linear or curvilinear, and if curvilinear is it monotonic? Examination of a LOWESS plot of English gains on school size suggests little or no association between school size and gains (Figure 8). A slight upward slope of the LOWESS line for larger schools appears to be due only to a small number of very large schools. Regression results find the average association in the entire sample to be effectively zero after controlling for rurality and FRPL percentage (Table 7, columns 1 and 2). I reject a quadratic term for school size, which is not statistically significant, and does not improve model fit (Appendix Table D4, column 1). 10 Using the slope coefficient reported in Table 6, column 2, and the first and third quartiles of rural school enrollment (355 students and 885 students) divided by 100, the calculation is: 0.02*( ) =
32 DRAFT DO NOT CITE OR CIRCULATE Does high school size predict score gains in English differently depending on whether schools are located in rural or non-rural areas? Examining separate LOWESS plots of the relationship between English gains and school size in rural and non-rural schools suggests little or no relationship between school size and English gains in either locale (Figure 9). An upward bend in the LOWESS line for larger rural schools appears to be due only to the one or two largest schools 11. Regression estimates from a model allowing the relationship of size and gains to vary with rurality find no interaction of school size and rurality before or after controlling for FRPL percentage (Table 7, columns 3 and 4), and that the coefficients for school size are effectively zero in both non-rural and rural schools (Table 8, columns 1 and 2). Does high school size predict score gains in English differently depending on school FRPL eligibility concentration? Examining LOWESS plots of the relationship between school size and English gains for schools below and above the median of FRPL percentage suggests little or no relationship for schools below the median, and no relationship at all for schools above the median. Similar to the math results for my third research question, regression results after controlling for rurality estimate a small negative interaction between school size and English gains that is statistically significant after controlling for rurality (-0.030sd, p=0.045) (Table 7, columns 5 and 6). The fitted slope of English gains on school size for 11 I test and reject a quadratic specification (Appendix Table D4, column 2). 30
33 DRAFT DO NOT CITE OR CIRCULATE schools at the third quartile of FRPL percentage is trivial but statistically significant (-0.008sd, p=0.046), and there is no appreciable relationship at the first quartile (Table 9). Is there a difference between rural and non-rural schools in how FRPL eligibility concentration moderates the relationship between school size and score gains in English? I find, at most, weak evidence that the relationship between school size and English score gains is small and negative for higher-poverty non-rural schools, and the association is effectively zero for rural schools and lower FRPL non-rural schools. This stands in contrast with my findings for math. Separate LOWESS plots of the relationship between English gains and size for rural and non-rural schools, partitioned at the overall median of FRPL percentage, suggest a small negative relationship for non-rural schools above the median (Figure 11). Regression results find the coefficient for the three-way interaction between school size, FRPL percentage, and rurality to be effectively zero (Table 7, column 7). The fitted slope for non-rural schools at the third quartile of FRPL percentage is small and statistically significant (-0.012sd, p=0.034) (Table 10, column 1), but it is not statistically different from the fitted slope for non-rural schools at the first quartile of FRPL percentage (p=0.071) (Table 10, column 1), or that for rural schools at the third quartile of FRPL percentage (p=0.435) (Table 10, column 3). I fit a version of this model controlling for LEP percentage to test the hypothesis that this can explain the small effect observed for high poverty non-rural schools. Results 31
34 DRAFT DO NOT CITE OR CIRCULATE from this model are identical to those described above, and adding LEP percentage offers no improvement in model fit, leading me to reject this hypothesis (Appendix Table D4 column 3, and Appendix Table D5). Sensitivity Tests I first report results from two sensitivity tests related to the test scores I use. I then report results from a test for potential bias from differential attrition of students across schools, and from a test evaluating the effect of excluding students who change schools. My conclusion from these tests is that the general patterns described above are robust to inclusion of students with the highest and lowest obtainable scale scores on the math KCCT, to differential attrition across schools, and to my exclusion of students who transfer. Results of each test for my final school models are presented in Appendix E. The only findings that differ appreciably from those reported above are from the test in which I substitute EXPLORE scores for KCCT scores. After making this substitution the negative slope of math gains on size for higher-frpl rural schools is about two-thirds as strong, and all of the slopes for English gains are unambiguously negligible (Appendix Tables E1 and E2). The relative weakness of effects for this alternate outcome appears to be due at least partly to there simply being less variation in the outcome when EXPLORE scores are used. This can be seen by comparing Appendix Figures B3 and B7 for math, and B4 and B8 for English. I consider the significance and interpretive consequences of these results in the discussion. 32
35 DRAFT DO NOT CITE OR CIRCULATE My second sensitivity test, in which I exclude the scores of students who obtained the highest and lowest obtainable scale scores on their eighth grade math and English KCCT tests, finds no appreciable effect on any of my conclusions (Appendix Tables E3 and E4). Substituting freshman cohort size for total enrollment also leaves my results substantially unchanged, indicating that the negative relationships I find between school size and learning gains are not attributable to selection bias resulting from differential attrition of low performing students across schools. Because the scale of the predictor variable in this test differs from that in my main analysis I present estimated slopes from the original and the alternate model with both school size and score gains standardized to have mean zero and unit variance. Results for math are presented in Appendix Tables E5 and E6, and results for English in Appendix Tables E7 and E8. My final sensitivity test, in which I include students who changed schools, associating them first with the school in which they started ninth grade, and then with the school in which they enrolled in twelfth grade, finds that in neither case does the inclusion of these students lead to any appreciable difference in my results (Appendix Tables E9 and E10 for math, and E11 and E12 for English). Discussion In this study I asked how school size predicts student achievement, and proposed that the relationship between school size and learning is most negative in schools that are 33
36 DRAFT DO NOT CITE OR CIRCULATE both poor and rural. In testing this hypothesis, I also aimed to investigate whether inconsistency across earlier studies could have been due to their not having allowed a three-way interaction of school size, school poverty, and rurality. I offer three brief discussions of my findings: I begin by discussing my math findings, and how they illustrate that inconsistent findings can result from not allowing my proposed three-way interaction. I then discuss my findings for English, and what additional light they shed on the relationship between school size and learning. I then discuss the meaning of the results from my sensitivity test substituting EXPLORE scores for KCCT scores. I conclude by noting several limitations of the current study, and summarizing what my results suggest about the general relationship between school size and achievement, and about school size policies. Math Gains: How Rurality and FRPL Percentage Moderate the Effect of School Size My math results were generally consistent with my hypothesis: I found that school size has a modest negative association with math score gains in rural schools with relatively high rates of FRPL eligibility, with the caveat that the three-way interaction of school size, FRPL percentage, and rurality, was only marginally significant. These results illustrate two reasons why it was important to consider the relationship between size and math learning separately for rural and non-rural schools at different levels of poverty: First, when my model did not distinguish the poorest rural schools from other types of schools, the estimated negative associations between school size and learning were 34
37 DRAFT DO NOT CITE OR CIRCULATE trivially small, and offered no cause for concern. Second, when I did not allow the relationship to vary with school poverty, I estimated substantial positive relationships between size and gains for larger schools, which were not evident in results from my final model. I now consider what new insight my results can offer into possible sources of inconsistency in past literature. My results mirrored those of earlier studies that found rurality (Crispin, 2015), and school poverty (Howley & Bickel, 1999) to moderate the relationship between school size and learning. The findings from those two papers, however, were inconsistent with each other: the former found U-shaped relationships, and the latter linear relationships. Therefore, my findings also mirrored the inconsistency between those studies, by offering conflicting pictures of the relationship between school size and math gains when only rurality, or only FRPL, were allowed to moderate the relationship. These conflicting pictures were resolved, for my sample, by finding that not only rurality and poverty, but also their coincidence, moderated the relationship. This is the first result I am aware of that directly addresses the discrepancy between findings of linear relationships and of U-shaped relationships. In my results, conflicting pictures of the relationship arose because the coincidence of rurality and higher levels of poverty was concentrated in smaller schools. When my estimation procedure did not distinguish higher poverty rural schools from lower poverty schools, which also tended to be larger, there appeared to be a positive relationship for larger schools, and a U-shaped relationship overall (Figures 2 and 4). 35
38 DRAFT DO NOT CITE OR CIRCULATE When I allowed a three-way interaction of size, poverty, and rurality in predicting math gains, no statistically significant positive relationships between size and learning were evident (Figure 7). I also did not find evidence that a linear specification in size was too restrictive to model the relationship after allowing a three-way interaction. The noted correspondence between my findings and those from earlier studies suggests that reanalysis of their data, allowing an interaction of school size, socioeconomic factors, and rurality, could prove fruitful in resolving the inconsistency between their findings. I observed neither inverted-u-shaped relationships, nor linear relationships with substantial positive slopes, in any part of my sample. Therefore, I can offer less insight into how past findings of those types might be reconciled with the broader literature. English Gains: Findings on the Effect of School Size may not Generalize Across Subjects My results for English contradict my hypothesis. To the contrary, they suggest a null relationship between school size and English gains, or possibly a slight negative relationship in poor non-rural schools. Having controlled for LEP percentage, I reject the hypothesis that this explains any observable effect of size on English gains. A more likely explanation for the weak to null results in English is that school effects are less important than in math because language skills are subject to more influences beyond the school. 36
39 DRAFT DO NOT CITE OR CIRCULATE In any case, it is important to note is that in this sample the relationship between school size and learning does not generalize across subject areas. Previous studies that examined both math and English (e.g. Lee and Smith, 1997; McMillen, 2004) generally found two things: that math outcomes were more sensitive to school size, and that the overall pattern of results was similar for the two subject areas. My results were consistent with the first of these, but my final model offered evidence against the second. Consequences of Substituting the EXPLORE test for the KCCT For high-poverty rural schools the magnitude of schools changes in relative position for math at a given level of school size is only about two-thirds as large when the EXPLORE test is substituted for the KCCT. This raises two questions: First, what factors that drive changes in relative position would be detected by the substitution of a different baseline test? Second, what does this imply for the interpretation of my results? Before attempting to answer these questions two features of the tests are important to note: First, the ACT is more similar to the EXPLORE test than to the KCCT test, because they are produced by the same company. Second, unlike the EXPLORE test, the KCCT is used for high-stakes accountability purposes. One possible explanation is that rural areas with large high schools have especially weak articulation between middle school and high school, making students performance more sensitive to the dissimilarity between eighth grade and high school 37
40 DRAFT DO NOT CITE OR CIRCULATE assessments. This dis-articulation could plausibly be more severe when students leave small, far-flung, rural middle schools to attend large, centralized, rural high schools. Another possibility is that KCCT scores are more inflated in the middle schools whose students go on to large, high-poverty, rural high schools. Score inflation occurs when teachers offer test-specific instruction that neglects more generalizable knowledge about the domain of interest, and tends to occur when tests are used for high stakes purposes (Koretz & Barron, 1998). Score inflation can be evinced by greater difficulty on a later assessment that is more dissimilar from the earlier one targeted by test-specific instruction. Research has found that score inflation on the math KCCT is more prevalent in high poverty schools in Kentucky, but not that it is more prevalent in (predominantly rural) Appalachia (Koretz, Waldman, Yu, Langi & Orzech, 2016), offering only mixed support for this hypothesis. It is beyond the scope of this paper to test these hypotheses. They both suggest, however, that a substantial portion of the effect observed in high-poverty rural schools may result from characteristics of the middle schools that send students to those high schools, or of the overall context in which the schools operate. Limitations A major limitation of this paper, and of much of the research on the relationship between school size and outcomes, is that it is unable to support claims about what causes 38
41 DRAFT DO NOT CITE OR CIRCULATE the observed effects, or about the mechanisms involved. The best that such research can hope to do is illustrate patterns that will inform the more difficult work of uncovering and describing mechanisms. A second limitation is that, because the large majority of students who are not observed graduating high school are missing test scores, I am unable to say anything about the relationship between school size and outcomes for students who do not take high school exit exams. This limitation speaks to the need for research on how school size relates to outcomes and risk factors that may be more relevant for students at risk of academic failure and dropping out. A third limitation is that my sample is not large enough, nor my measure of economic disadvantage of high enough quality, to support ideal analyses. A larger sample would provide the statistical power to fit local regressions within narrow ranges of FRPL percentage. Without this, I am forced to assume that the relationship between school size and score gains varies linearly with FRPL percentage, an assumption that the models presented in Appendix Tables D1 and D2 call into question. I note, however, that my most important finding, regarding high-poverty rural schools, is quite robust in the local model presented in Appendix Table D1. Regarding the quality of my variables, FRPL percentage is an extremely crude measure of school socio-economic conditions. Although my results are generally consistent with those from analyses that used more sophisticated measures, a richer description of student characteristics would enable a more nuanced 39
42 DRAFT DO NOT CITE OR CIRCULATE understanding of why and how school composition moderates the effect of size on learning. Conclusions and Policy Implications Although my findings offer some insight into the sources of inconsistency in past literature, they do not bring the literature closer to a general understanding of how school size relates to student achievement. Rather, they offer more evidence that the relationship between school size and achievement depends both on the context of the schools in question, and on the subject area under consideration. This suggests that before undertaking to change the size of schools to realize some hoped-for outcome, one should be clear about the factors and mechanisms one hopes to exploit, how they relate to the characteristics of the schools in question, and what other outcomes may or may not also be affected. Turning to the implications of my findings for policy, an important strand of the literature on school size, which includes the papers that I cite by Craig Howley and his colleagues (see Appendix A), advocates against the consolidation of rural schools and in favor of small rural learning communities. Poor rural schools are the ones most likely to come under pressure to consolidate, and thus enlarge, in order to save money, and my results are therefore most relevant to them. The strongest finding presented here is of a negative association between school size and math learning in poor rural schools, and 40
43 DRAFT DO NOT CITE OR CIRCULATE while I cannot support causal claims about the relationship between school size and learning, this finding suggests some caution about enlarging such schools. For non-rural schools and lower poverty rural schools my findings offer little evidence that school size holds promise as an instrument for influencing outcomes. While there are likely advantages and disadvantages of both larger and smaller schools, the evidence presented here suggests that, without a deeper understanding of the school or schools in question, no particular size is clearly preferable. References Adams Jr, J. E., & Foster, E. M. (2002). District Size and State Educational Costs: Should Consolidation Follow School Finance Reform?. Journal of Education Finance, Andrews, M., Duncombe, W., & Yinger, J. (2002). Revisiting economies of size in American education: are we any closer to a consensus?. Economics of Education Review, 21(3), Barker, R. G., & Gump, P. V. (1964). Big school, small school: High school size and student behavior Stanford University Press. Battistich, V., Solomon, D., Kim, D., Watson, M., & Schaps, E. (1995). Schools as communities, poverty levels of student populations, and students attitudes, motives, and performance: A multilevel analysis. American Educational Research Journal, 32(3),
44 DRAFT DO NOT CITE OR CIRCULATE Blauwkamp, J. M., Longo, P. J., & Anderson, J. (2011). School consolidation in Nebraska: Economic efficiency vs. rural community life. Online Journal of Rural Research & Policy, 6(1), 1. Castellano, K. E., & Ho, A. D. (2013). A Practitioner's Guide to Growth Models. Council of Chief State School Officers. Coladarci, T. (2006). School size, student achievement, and the" power rating" of poverty: Substantive finding or statistical artifact?. Education Policy Analysis Archives, 14, 28. Conant, J. B., & Gardner, J. W. (1959). The American high school today: A first report to interested citizens McGraw-Hill New York. Crispin, L. M. (2015). School size and student achievement: Does one size fit All. Eastern Economic Journal, Fowler, W. J., & Walberg, H. J. (1991). School size, characteristics, and outcomes. Educational Evaluation and Policy Analysis, 13(2), Friedkin, N. E., & Necochea, J. (1988). School system size and performance: A contingency perspective. Educational Evaluation and Policy Analysis, 10(3), Howley, C. (1996). Compounding disadvantage: The effects of school and district size on student achievement in West Virginia. Journal of Research in Rural Education, 12, Howley, C. B., & Bickel, R. (1999). The Matthew project: National report. Huang, G., Howley, C. (1993). Mitigating Disadvantage: Effects of Small-Scale Schooling on Student Achievement in Alaska. Journal of Research in Rural Education, 9(3),
45 DRAFT DO NOT CITE OR CIRCULATE Isserman, A. M. (2005). In the national interest: Defining rural and urban correctly in research and public policy. International Regional Science Review, 28(4), Johnson, J. D., Howley, C. B., & Howley, A. A. (2002). Size, excellence, and equity: A report on Arkansas schools and districts. Koretz, D. M., & Barron, S. I. (1998). The Validity of Gains in Scores on the Kentucky Instructional Results Information System (KIRIS). Koretz, D. M., Waldman, M., Yu, C., Langi, M., & Orzech, A. (2016) Using the Introduction of a New Test to Investigate the Distribution of Score Inflation. Working Paper. Education Accountability Project. Lee, V. E., & Smith, J. B. (1997). High school size: Which works best and for whom? Educational Evaluation and Policy Analysis, 19(3), Lord, F. M. (1969). Statistical adjustments when comparing preexisting groups. Psychological Bulletin, 72(5), 336. McMillen, B. J. (2004). School size, achievement, and achievement gaps. Education Policy Analysis Archives, 12, 58. Meier, D. (2002). The power of their ideas: Lessons for America from a small school in Harlem. Beacon Press. Nelson, C. A., & Sheridan, M. A. (2011). Lessons from neuroscience research for understanding causal links between family and neighborhood characteristics and educational outcomes. Whither opportunity, Schreiber, J. B. (2002). Institutional and student factors and their influence on advanced mathematics achievement. The Journal of Educational Research, 95(5), StataCorp Stata Statistical Software: Release 13. College Station, TX: StataCorp LP. 43
46 DRAFT DO NOT CITE OR CIRCULATE Tieken, M. C. (2014). Why rural schools matter UNC Press Books. Werblow, J., & Duesbery, L. (2009). The impact of high school size on math achievement and dropout rate. The High School Journal, 92(3),
47 Tables Table 1 Means and standard deviations (in parentheses) of school variables (1) (2) (3) Entire Sample Non-rural Rural Enrollment (510) (566) (391) % Ever Eligible for FRPL in High Scho (0.18) (0.18) (0.17) % Ever LEP in High School (0.006) (0.029) (0.007) Math Gains (grade 8 to grade 11) (0.242) (0.205) (0.248) English Gains (grade 8 to grade 11) (0.226) (0.193) (0.241) N
48 Table 2 Correlations between school variables Enrollment % FRPL Rurality % LEP School mean ACT math School mean ACT English School mean KCCT math School mean KCCT reading School mean EXPLORE math School mean EXPLORE English School mean math gain School mean English gain School mean math gain (ACT- EXPLORE) Enrollment 1 - % FRPL * 1 (0.000) - Rurality * * 1 (0.000) (0.011) - % LEP * * 1 (0.001) (0.176) (0.000) - School mean ACT Math * * * (0.000) (0.000) (0.000) (0.505) - School mean ACT English * * * * * 1 (0.000) (0.000) (0.001) (0.029) (0.000) - School mean KCCT math * * * * 1 (0.000) (0.000) (0.734) (0.052) (0.000) (0.000) - School mean KCCT reading * * * * * * 1 (0.004) (0.000) (0.624) (0.028) (0.000) (0.000) (0.000) - School mean EXPLORE math * * * * * * 1 (0.000) (0.000) (0.075) (0.060) (0.000) (0.000) (0.000) (0.000) - School mean EXPLORE English * * * * * * * * * 1 (0.000) (0.000) (0.011) (0.016) (0.000) (0.000) (0.000) (0.000) (0.000) - School mean math gain * * * * * * * * 1 (0.002) (0.000) (0.000) (0.007) (0.000) (0.000) (0.000) (0.086) (0.092) (0.049) - School mean English gain * * * * * * * * 1 (0.035) (0.000) (0.000) (0.443) (0.000) (0.000) (0.958) (0.000) (0.188) (0.014) (0.000) - School mean math gain (ACT-EXPLORE) * * * * * * * * * 1 (0.001) (0.002) (0.002) (0.010) (0.000) (0.077) (0.616) (0.027) (0.000) (0.254) (0.000) (0.000) - School mean English gain (ACT-EXPLORE * * * * * * * 1 (0.132) (0.000) (0.002) (0.530) (0.000) (0.000) (0.236) (0.364) (0.228) (0.435) (0.000) (0.000) (0.000) - Note. p-values in parentheses * p<0.05 ** p<0.01 *** p<0.001 School mean English gain (ACT- EXPLORE)
49 Table 3 Regression results for math gains (1) (2) (3) (4) (5) (6) (7) (8) (9) Main Effects Enrollment (/100) ** * ** * (0.002) (0.836) (0.055) (0.030) (0.317) (0.361) (0.009) (0.010) (0.116) Enrollment Squared ** * (0.003) (0.018) (0.132) (0.265) Rural *** *** *** (0.000) (0.000) (0.641) (0.869) (0.000) (0.596) School Mean FRPL *** *** *** (0.000) (0.000) (0.000) (0.439) (0.693) (0.966) Interactions Enrollment x Rural (0.085) (0.060) (0.125) Enrollment Squared x Rural * 0.002* (0.036) (0.035) Enrollment x Mean FRPL * ** (0.022) (0.008) (0.179) Rural x Mean FRPL (0.938) Enrollment x Rural x Mean FRPL (0.055) Constant ** 0.288*** *** *** (0.001) (0.000) (0.897) (0.000) (0.209) (0.000) (0.792) (0.350) (0.820) N R-squared Note. p-values in parentheses * p<0.05 ** p<0.01 *** p<0.001
50 Table 4 Effect of enrollment and enrollment-squared on math gains for non-rural and rural schools (1) (2) (3) Non-rural schools: Effect of a 100 student enrollment increase on math gains. Rural schools: Effect of a 100 student enrollment increase on math gains. Difference between rural and non-rural effect estimates Enrollment (/100) ** `(0.360) `(0.003) `(0.060) Enrollment Squared ** 0.002* `(0.264) `(0.003) `(0.035) Notes. 1. p-values in parentheses * p<0.05 ** p<0.01 *** p< Effects for rural schools are calculated using coefficients from Table 3, column 6 as: β Enrollment + β EnrollmentxRural for the linear term and β Enrollment_Squared +β Enrollment_SquaredxRural for the quadratic term
51 Table 5 Effect of school size on math gains at quartiles of FRPL percentage with and without controlling for rurality % FRPL (1) Effect of a 100 student enrollment increase on math gains (with control for rurality) 1st quartile FRPL percentage `(0.470) 3rd quartile FRPL percentage `(0.075) Difference between effects at 3rd and 1st quartiles Notes. 1. p-values in parentheses * p<0.05 ** p<0.01 *** p< ** `(0.007) 2. Effects at each level of %FRPL are calculated using coefficients from Table 3, columns 7 and 8 as: β Enrollment + β EnrollmentxMean_FRPL *%FRPL
52 Table 6 Effect of enrollment on math gains at quartiles of FRPL percentage by nonrural and rural schools (1) (2) (3) Quartile of FRPL percentage % FRPL Non-rural schools: Effect of a 100 student enrollment increase on math gains Rural schools: Effect of a 100 student enrollment increase on math gains Difference between rural and non-rural effect estimates 1st quartile FRPL percentage `(0.279) `(0.698) `(0.800) 3rd quartile FRPL percentage ** `(0.661) `(0.005) `(0.055) Difference between effects at 3rd and 1st quartiles Notes. 1. p-values in parentheses * p<0.05 ** p<0.01 *** p< *** `(0.178) `(0.001) 2. Effects at each level of %FRPL are calculated using coefficients from Table 3, column 9 as: β Enrollment + β EnrollmentxMean_FRPL *%FRPL for non-rural schools and β Enrollment +β EnrollmentxRural + (β EnrollmentxMean_FRPL +β EnrollmentxMean_FRPLxRural )*%FRPL for rural schools
53 Table 7 Regression results for English gains (1) (2) (3) (4) (5) (6) (7) Main Effects Enrollment (/100) * (0.035) (0.435) (0.979) (0.208) (0.088) (0.106) (0.189) Rural *** ** ** *** (0.001) (0.002) (0.007) (0.001) (0.597) School Mean FRPL *** *** (0.000) (0.000) (0.077) (0.131) (0.599) Interactions Enrollment x Rural (0.155) (0.260) (0.545) Enrollment x Mean FRPL * (0.077) (0.045) (0.073) Rural x Mean FRPL (0.757) Enrollment x Rural x Mean FRPL (0.843) Constant * 0.332*** *** * (0.018) (0.000) (0.312) (0.000) (0.128) (0.043) (0.239) N R-squared Note. p-values in parentheses * p<0.05 ** p<0.01 *** p<0.001
54 Table 8 Effect of enrollment on English gains for non-rural and rural schools (1) (2) (3) Non-rural schools: Effect of a 100 student enrollment increase on English gains Rural schools: Effect of a 100 student enrollment increase on English gains Difference between rural and non-rural effect estimates Enrollment (/100) `(0.207) `(0.639) `(0.259) Notes. 1. p-values in parentheses * p<0.05 ** p<0.01 *** p< The effect for rural schools is calculated using coefficients from Table 7, column 4 as: β Enrollment + β EnrollmentxRural
55 Table 9 Effect of school size on English gains at quartiles of FRPL percentage (1) % FRPL Effect of a 100 student enrollment increase on English gains 1st quartile FRPL percentage `(0.700) 3rd quartile FRPL percentage * `(0.046) Difference between effects at 3rd and 1st quartiles Notes. 1. p-values in parentheses * p<0.05 ** p<0.01 *** p< * `(0.044) 2. Effects at each level of %FRPL are calculated using coefficients from Table 7, column 6 as: β Enrollment + β EnrollmentxMean_FRPL *%FRPL
56 Table 10 Effect of enrollment on English gains at quartiles of FRPL percentage for non-rural and rural schools (1) (2) (3) % FRPL Non-rural schools: Effect of a 100 student enrollment increase on English gains Rural schools: Effect of a 100 student enrollment increase on English gains Difference between rural and non-rural effect estimates 1st quartile FRPL percentage `(0.356) `(0.370) `(0.212) 3rd quartile FRPL percentage * `(0.034) `(0.466) `(0.435) Difference between effects at 3rd and 1st quartiles Notes. 1. p-values in parentheses * p<0.05 ** p<0.01 *** p< `(0.071) `(0.108) 2. Effects at each level of %FRPL are calculated using coefficients from Table 7, column 7 as: β Enrollment + β EnrollmentxMean_FRPL *%FRPL for non-rural schools and β Enrollment +β EnrollmentxRural + (β EnrollmentxMean_FRPL +β EnrollmentxMean_FRPLxRural )*%FRPL for rural schools
57
58
59
60
61
62
63
64

65
66
67
68 Appendix A Details of Past Studies on the Relationship Between School Size and Learning Outcomes Table A1 Details of cited papers on the association of school size with learning outcomes Paper Setting Huang & Alaska, Grades 4, Howley, , and 8 Type of Outcome Outcome SES School Size Other Controls ITBS Score Levels 5 point student-level indicator based on multiple characteristics Categorical (average number of per tested grade) 1 = <20/grade 2 = 20-60/grade 3= >60/grade Cost per pupil, Student-Teacher Ratio, Community Size, Class Size, School Climate (drawn from principal surveys), Student pre-k participation, student self-reports on academic engagement surveys Socioeconomic Disadvanta ge Size - + Socioeconomic_Disadvantag e*size 1 - Howley, 1996 Howley & Bickel, 1999 Johnson, Howley & Howley 2002 Coladarci, 2006 Schreiber, 2002 Fowler & Walberg, 1991 West Virginia Grades 3, 6, 9 and 11 Georgia, all tested grades K-12 Ohio, all tested grades K-12 Texas, all tested grades K-12 Montana, all tested grades K- 12 Arkansas Grades 4, 5, 7, 8, 10 Maine, Grade 8 U.S. Advanced Math Students (HS Seniors) from TIMMS data New Jersey High Schools LEVELS CTBS Score Levels % FRPL Enrollment per grade None - + (but negligible in uncontrolle d model) - (stronger as grade level increases) ITBS Score Levels % FRPL Ohio Proficiency Test Levels District Rate of Aid to Dependent Children Average Grade- Ethnicity and Class Size Cohort Size TAAS Score Levels % FRPL ITBS/CTBS/Stanford AT Levels 2 % FRPL Stanford AT Score Levels (5/7/10) and % % FRPL Proficient on Benchmark Test (4/8) Maine Education Assessment Levels Scores from study assessment Various: Average Scores and % passing on Minimum Competency Tests, Scores and % passing on Proficiency Tests Logarithm of average cohort size None - Sign varies based on FRPLcompositio n % FRPL Enrollment per grade None Individual Parent Education and School Mean of Parent Education % Below Federal Poverty Line in School, District Per-pupil expenditure, property wealth, and SES Composite from Census Variables (p.195) School Enrollment School Enrollment Gender, Various attitude and psychological variables, extracurricular activities, School resources School suspensions, % held back, % minority, various human capital measures for teachers - + NA - - NA -
69 Table A1 (continued) Details of cited papers on the association of school size with learning outcomes McMillen, 2004 North Carolina, High Schools (other levels not included here) Crispin, 2015 NELS:88 Sample Lee & Smith, 1997 Werblow & Duesbery, 2009 NELS:88 Sample ELS:2002 Sample COVARIATE ADJUSTED LEVELS SCORE DIFFERENCES HSCT scores controlled with G8 EOG scores for math and reading Covariate adjusted outcome scores from study assessments, math Gain scores from study assessments, math and reading Gain scores from study assessments, math Parent Education at Student Level, School % FRPL at School Level As control variables: Composite SES measure for individuals and school average. Median district hh income and minority concentration. Composite SES measure from NELS data Composite SES measure for individuals, % FRPL at school level School Enrollment Gender, Ethnicity - School Enrollment School Enrollment School Enrollment School racial and ability composition School sector, minority concentration, gender urbanicity (not interacted - larger average growth in urban than in rural schools), race/ethnicity, gender, LEP concentration. - + (quadratic specificatio n tested and rejected) Varies by School Urbanicity - -shaped NA - Smallest betweenschool gaps between medium-sized schools. Largest advantage to higher SES in large schools. - U-shaped NA Footnotes 1: A negative coefficient here indicates that a study found a less positive effect of school size increases for lower SES schools. Because some studies operationalize SES such that lower values indicate greater poverty the sign reported here may not correspond to that in the paper. 2: In Montana test selection is at the district level - these are the three most common tests reported.
70 Appendix B Distributions of Outcome Measures This appendix contains side-by-side histograms by rural and non-rural locale for the two main outcome measures for Math and English gain scores, at both the student level, and the school level. These are followed by histograms for the alternate math and English gain scores using EXPLORE instead of KCCT baseline scores. All of these distributions are bell-shaped and approximately symmetrical. Following these are side-by-side histograms for the component scores that were used to construct these outcome measures. The distributions of ACT scores have modest right skew, and the distributions of KCCT scores exhibit substantial floor and ceiling effects. The distributions of EXPLORE Math scores appear somewhat leptokurtic and those of EXPLORE English scores somewhat platykurtic. None of these features of the component scores seem to be reflected in the gain scores constructed from them. The final two histograms give the school-level gain score distributions excluding HOSS and LOSS scores.
71 Figure B1. Distribution of student math gain scores for rural and non-rural schools (ACT- KCCT)
72 Figure B2. Distribution of student English gain scores for rural and non-rural schools (ACT-KCCT)
73 Figure B3. Distribution of school mean math gain scores for rural and non-rural schools (ACT-KCCT)

74 Figure B4. Distribution of school mean English gain scores for rural and non-rural schools (ACT-KCCT)
75 Figure B5. Distribution of student math gain scores for rural and non-rural schools (alternate measure for sensitivity test using EXPLORE math instead of KCCT math for baseline test).
76 Figure B6. Distribution of alternate student English gain scores for rural and non-rural schools (alternate measure for sensitivity test using EXPLORE English instead of KCCT reading for baseline test).
77 Figure B7. Distribution of alternate school mean math gain scores for rural and non-rural schools (alternate measure for sensitivity test using EXPLORE math instead of KCCT math for baseline test).
78 Figure B8. Distribution of alternate school mean English gain scores for rural and nonrural schools (alternate measure for sensitivity test using EXPLORE English instead of KCCT reading for baseline test).

79 Figure B9. Distribution of 8 th grade student KCCT math scores for rural and non-rural schools

80 Figure B10. Distribution of student ACT math scores for rural and non-rural schools
81 Figure B11. Distribution of 8 th grade student EXPLORE math scores for rural and nonrural schools

82 Figure B12. Distribution of student 8 th grade KCCT reading scores for rural and nonrural schools
83 Figure B13. Distribution of student ACT English scores for rural and non-rural schools
84 Figure B14. Distribution of 8 th grade EXPLORE English scores for rural and non-rural schools
85 Figure B15. Distribution of school mean math gain scores for rural and non-rural schools (ACT-KCCT) gain scores calculated with scores of students obtaining highest and lowest obtainable scale scores removed.
 gain scores")
86 Figure B16. Distribution of school mean English gain scores for rural and non-rural schools (ACT-KCCT) gain scores calculated with scores of students obtaining highest and lowest obtainable scale scores removed

87 Appendix C Distributions of Predictor Variables Figure C1. Scatterplots of bivariate relationships between continuous variables.

88 Figure C2. Distribution of school enrollment by rural and non-rural schools.

89 Figure C3. Distribution of school FRPL concentration by rural and non-rural schools.

90 Figure C4. Distribution of school LEP concentration by rural and non-rural schools. Note. This variable takes a value of zero for the majority of schools, including 45% of non-rural schools and 75% of rural schools.
91 Table C1 Means and standard deviations (in parentheses) of variables disaggregated to the student level by rural and non-rural settings Entire Sample Rural Non-rural FRPL ever in high school (0.500) (0.496) (0.499) LEP ever in high school (-0.097) (-0.054) (-0.119) ACT math (1.027) (0.958) (1.069) ACT English (0.997) (0.967) (1.014) KCCT math (0.951) (0.930) (0.967) KCCT reading (0.952) (0.941) (0.960) EXPLORE math (-0.957) (-0.927) (-0.977) EXPLORE English (-1.007) (-0.974) ((1.029) Math gain score (0.229) (0.237) (0.189) English gain score (0.200) (0.208) (0.181) N 122,833 52,724 70,198
92 Table C2 Correlations between variables disaggregated to the student level. FRPL LEP ever ever in ACT in high high math school school ACT English KCCT math KCCT reading EXPLORE math EXPLORE English Math gain score FRPL ever in high school 1 - LEP ever in high school * 1 (0.000) - ACT math * * 1 (0.000) (0.000) - ACT English * * * 1 (0.000) (0.000) (0.000) - KCCT math * * * * 1 (0.000) (0.000) (0.000) (0.000) - KCCT reading * * * * * 1 (0.000) (0.000) (0.000) (0.000) (0.000) - EXPLORE math * * * * * * 1 (0.000) (0.000) (0.000) (0.000) (0.000) (0.000) - EXPLORE English * * * * * * * 1 (0.000) (0.000) (0.000) (0.000) (0.000) (0.000) (0.000) - Math gain score * * * * * * * * 1 (0.000) (0.000) (0.000) (0.000) (0.000) (0.000) (0.000) (0.000) - English gain score * * * * * * * * 1 (0.000) (0.084) (0.000) (0.000) (0.000) (0.000) (0.000) (0.000) (0.000) - Note. p-values in parentheses * statistically significant at 95% confidence level or higher English gain score
93 Appendix D Alternative and Rejected Model Specifications For my analyses in which I test FRPL percentage as a moderator of the relationship between school size and learning gains I also fit a set of models on subsets of schools, corresponding to the subsamples presented in the LOWESS plots (Figures 5 and 6 for math, and Figure 10 and 11 for English). In these models I simply regressed score gains on school size. I included rurality as a control in cases where I did not also partition the sample on that variable: 1 = with, ~ 0, These models estimate the average relationship between size and score gains within subsets of the sample. The patterns of results from these models are generally consistent with those in the main analyses in terms of the signs and relative magnitudes of coefficients: The largest negative association between size and learning gains is, by a considerable margin, for math in rural schools above the median of FRPL, although the average effect within this group is only marginally significant (-0.019sd, p=0.055) (Table D1, column 6). For English gains, the pattern of results is weaker, and no slope estimate for English gains on size is statistically significant at even the 90% level. Purely in terms of magnitude, however, the larger negative point estimate is for non-rural schools above the median of FRPL (Table D2, column 5). If these results contain one departure from those in the main analysis that is worth noting, it is that the point estimates of learning gains on size are positive and non-trivial for rural schools below median FRPL percentage, although neither is statistically significant at conventional levels. For math the estimated slope for these schools is 0.012sd (p=0.078) (Table D1, column 4) and for English the estimated slope is 0.013sd (p=0.187) (Table D2, column 4). This corresponds to the patterns observed in the LOWESS plots, which suggested positive relationships for these schools, but also supports the observation that these apparent relationships were being driven by a small number of large schools, rather than a statistically significant pattern throughout the data.
94 Appendix Table D1 Regression results for math gains for sub-samples from partitioning the entire sample at the median of FRPL percentage (1) (2) (3) (4) (5) (6) Enrollment (/100) * (0.050) (0.476) (0.238) (0.078) (0.531) (0.055) Rural * *** (0.013) (0.000) Constant (0.459) (0.474) (0.264) (0.093) (0.689) (0.336) N R-sq Sub-sample All schools below median of FRPL percentage All schools above median of FRPL percentage Non-rural schools below median of FRPL percentage Rural schools below the median of FRPL percentage Non-rural schools above the median of FRPL percentage Rural schools above the median of FRPL percentage Note. p-values in parentheses * p<0.05 ** p<0.01 *** p<0.001
95 Appendix Table D2 Regression results for English gains for sub-samples from partitioning the entire sample at the median of FRPL percentage (1) (2) (3) (4) (5) (6) Enrollment (/100) (0.319) (0.135) (0.855) (0.187) (0.149) (0.539) Rural * ** (0.046) (0.004) Constant * (0.293) (0.757) (0.060) (0.232) (0.665) (0.036) N R-sq Sub-sample All schools below median of FRPL percentage All schools above median of FRPL percentage Non-rural schools below median of FRPL percentage Rural schools below the median of FRPL percentage Non-rural schools above the median of FRPL percentage Rural schools above the median of FRPL percentage Note. p-values in parentheses * p<0.05 ** p<0.01 *** p<0.001
96 Table D3 Rejected specifications of models for math gains (1) (2) Main Effects Enrollment (/100) (0.644) (0.769) Enrollment Squared (0.497) Rural (0.051) (0.391) School Mean FRPL *** (0.000) (0.644) Interactions Enrollment x Rural (0.588) (0.247) Enrollment Squared x Rural (0.360) Enrollment x Mean FRPL (0.893) Enrollment Squared x Mean FRPL (0.665) Rural x Mean FRPL (0.456) Rural x Enrollment x Mean FRPL (0.124) Rural x EnrollmentSquared x Mean FRPL (0.229) Constant 0.279*** (0.000) (0.445) N R-squared Alternate specification of Table 3, column: (6) (9) Results of likelihood ratio test against selected model (column (1) rejects the model with fewer coefficients) Note. p-values in parentheses * p<0.05 ** p<0.01 *** p<0.001 χ 2 (2)=10.24 p =0.006 χ 2 (4)=3.60 p =0.46
97 Table D4 Rejected specifications of models for English gains (1) (2) (3) Main Effects Enrollment (/100) (0.134) (0.091) (0.169) Enrollment Squared (0.188) (0.166) Rural ** (0.001) (0.102) (0.552) School Mean FRPL *** *** (0.000) (0.000) (0.569) School Mean LEP (0.374) Interactions Enrollment x Rural (0.946) (0.566) Enrollment Squared x Rural (0.504) Enrollment x Mean FRPL (0.055) Rural x Mean FRPL (0.806) Rural x Enrollment x Mean FRPL (0.918) Constant 0.363*** 0.395*** (0.000) (0.000) (0.226) N R-squared Alternate specification of Table 7, column: (2) (4) (7) Results of likelihood ratio test against selected model (column (1) rejects the model with fewer coefficients) Note. p-values in parentheses * p<0.05 ** p<0.01 *** p<0.001 χ 2 (1)=1.78 p =0.18 χ 2 (2)=4.22 p =0.12 χ 2 (1)=0.82 p =0.36
98 Appendix Table D5 Effect of enrollment on English gains, after controlling for school LEP percentage, at quartiles of FRPL percentage for non-rural and rural schools (1) (2) Quartile % FRPL Effect of a 100 student enrollment increase on English gains in non-rural schools Effect of a 100 student enrollment increase on English gains in rural schools `(0.262) `(0.361) * `(0.049) `(0.867) * `(0.022) `(0.473) Notes. 1. p-values in parentheses * p<0.05 ** p<0.01 *** p< Effects at each level of %FRPL are calculated using coefficients from Table 7, column 7 as: β Enrollment + β EnrollmentxMean_FRPL *%FRPL for non-rural schools and β Enrollment +β EnrollmentxRural + (β EnrollmentxMean_FRPL +β EnrollmentxMean_FRPLxRural )*%FRPL for rural schools
99 Appendix E Sensitivity Tests and Regression Diagnositics In this appendix I present results from sensitivity checks to enable the reader to compare these with the results presented in the main body. I then present regression diagnostics from my final models, providing a brief description of them. Results from regression diagnostics suggest no threats to my conclusions.
100 Table E1 Table E2 Math final model results with EXPLORE substituted for grade 8 KCCT (cf. Table 6) English final model results with EXPLORE substituted for grade 8 KCCT (cf. Table 6) (1) (2) (1) (2) Quartile % FRPL Effect of a 100 student enrollment increase on math gains in non-rural schools Effect of a 100 student enrollment increase on math gains in rural schools Quartile % FRPL Effect of a 100 student enrollment increase on English gains in non-rural schools Effect of a 100 student enrollment increase on English gains in rural schools `(0.112) `(0.204) `(0.231) `(0.192) * `(0.485) `(0.037) `(0.253) `(0.601) Notes. Notes. 1. p-values in parentheses 1. p-values in parentheses * p<0.05 ** p<0.01 *** p<0.001 * p<0.05 ** p<0.01 *** p<0.001 Table E3 Math final model results with HOSS/LOSS scores excluded (cf. Table 6) Table E4 English final model results with HOSS/LOSS scores excluded (cf. Table 6) (1) (2) (1) (2) Quartile % FRPL Effect of a 100 student enrollment increase on math gains in non-rural schools Effect of a 100 student enrollment increase on math gains in rural schools Quartile % FRPL Effect of a 100 student enrollment increase on English gains in non-rural schools Effect of a 100 student enrollment increase on English gains in rural schools `(0.679) `(0.860) `(0.324) `(0.294) ** * `(0.330) `(0.006) `(0.019) `(0.585) Notes. Notes. 1. p-values in parentheses * p<0.05 ** p<0.01 *** p< p-values in parentheses * p<0.05 ** p<0.01 *** p<0.001
101 Table E5 Table E6 Math final model results with school enrollment in standard deviation units Math final model controlling for attrition with freshman enrollment in standard deviation units (cf. Table E5) (1) (2) (1) (2) Quartile % FRPL Effect of a 100 Effect of a 100 Effect of a 100 Effect of a 100 Quartile % FRPL student student student student (0.279) (0.698) (0.545) (0.915) ** ** (0.661) (0.005) (0.369) (0.003) Notes. Notes. 1. p-values in parentheses 1. p-values in parentheses * p<0.05 ** p<0.01 *** p<0.001 * p<0.05 ** p<0.01 *** p<0.001 Table E7 English final model results with school enrollment in standard deviation units Table E8 English final model controlling for attrition with freshman enrollment in standard deviation units (cf. Table E7) (1) (2) (1) (2) Quartile % FRPL Effect of a 100 Effect of a 100 Effect of a 100 Effect of a 100 Quartile % FRPL student student student student `(0.356) `(0.370) `(0.273) `(0.389) * * `(0.034) `(0.466) `(0.020) `(0.423) Notes. Notes. 1. p-values in parentheses 1. p-values in parentheses * p<0.05 ** p<0.01 *** p<0.001 * p<0.05 ** p<0.01 *** p<0.001
102 Table E9 Table E10 Math final model results with transfer students included and associated with last high school attended (cf. Table 6) English final model results with transfer students included and associated with last high school attended (cf. Table 6) (1) (2) (1) (2) Quartile % FRPL Effect of a 100 Effect of a 100 Effect of a 100 Effect of a 100 Quartile % FRPL student student student student `(0.186) `(0.517) `(0.403) `(0.177) *** * `(0.667) `(0.001) `(0.050) `(0.274) Notes. Notes. 1. p-values in parentheses 1. p-values in parentheses * p<0.05 ** p<0.01 *** p<0.001 * p<0.05 ** p<0.01 *** p<0.001 Table E11 Table E12 Math final model results with transfer students included and associated with last high school attended (cf. Table 6) English final model results with transfer students included and associated with first high school attended (cf. Table 6) (1) (2) (1) (2) Quartile % FRPL Effect of a 100 Effect of a 100 Effect of a 100 Effect of a 100 Quartile % FRPL student student student student `(0.431) `(0.636) `(0.225) `(0.330) ** ** `(0.329) `(0.009) `(0.014) `(0.382) Notes. Notes. 1. p-values in parentheses * p<0.05 ** p<0.01 *** p< p-values in parentheses * p<0.05 ** p<0.01 *** p<0.001
103 Regression Diagnostics Evidence from regression diagnostics indicates some departure from normality in the tails of the distributions of the residuals for both models. This is illustrated by quintile-normal plots (Figures E1 and E2). I find that none of my results for either subject areas are being driven by these schools, or by any subset of these schools, although plots of leverage-vs-squared residuals for math (Figure E3) and for English (Figure E4) suggest that some of the schools whose residuals depart from normality may be influential data points. For math, schools and have the most positive residuals, and are identified in Figure E5 as potentially influential points. Both of these schools are among the smallest high-poverty rural schools, and their influence (or, more precisely, their lack of influence) on my results is addressed in footnote 9 to my math results on page 28. For English, the schools with the most negative residuals are , , and , and the school with the most positive residual is , all of which are clearly marked in Figure E6 as potentially influential points. I find that my conclusions for English are unchanged when I exclude all of these schools from my sample, when I exclude only those with the most negative residuals, or only the school with the most positive residual.

104 Figure E1: Quantiles of standardized residuals from final math model against quantiles of normal distribution. Figure E2: Quantiles of standardized residuals from final English model against quantiles of normal distribution.


105 Figure E3: Plot of leverage against normalized squared residuals for final math model. Figure E4: Plot of leverage against normalized squared residuals for final English model.
Peer Influence on Academic Achievement: Mean, Variance, and Network Effects under School Choice
 Megan Andrew Cheng Wang Peer Influence on Academic Achievement: Mean, Variance, and Network Effects under School Choice Background Many states and municipalities now allow parents to choose their children
The Talent Development High School Model Context, Components, and Initial Impacts on Ninth-Grade Students Engagement and Performance
 The Talent Development High School Model Context, Components, and Initial Impacts on Ninth-Grade Students Engagement and Performance James J. Kemple, Corinne M. Herlihy Executive Summary June 2004 In many
NCEO Technical Report 27
 Home About Publications Special Topics Presentations State Policies Accommodations Bibliography Teleconferences Tools Related Sites Interpreting Trends in the Performance of Special Education Students
Probability and Statistics Curriculum Pacing Guide
 Unit 1 Terms PS.SPMJ.3 PS.SPMJ.5 Plan and conduct a survey to answer a statistical question. Recognize how the plan addresses sampling technique, randomization, measurement of experimental error and methods
An Empirical Analysis of the Effects of Mexican American Studies Participation on Student Achievement within Tucson Unified School District
 An Empirical Analysis of the Effects of Mexican American Studies Participation on Student Achievement within Tucson Unified School District Report Submitted June 20, 2012, to Willis D. Hawley, Ph.D., Special
Sector Differences in Student Learning: Differences in Achievement Gains Across School Years and During the Summer
 Catholic Education: A Journal of Inquiry and Practice Volume 7 Issue 2 Article 6 July 213 Sector Differences in Student Learning: Differences in Achievement Gains Across School Years and During the Summer
School Size and the Quality of Teaching and Learning
 School Size and the Quality of Teaching and Learning An Analysis of Relationships between School Size and Assessments of Factors Related to the Quality of Teaching and Learning in Primary Schools Undertaken
CHAPTER 4: REIMBURSEMENT STRATEGIES 24
 CHAPTER 4: REIMBURSEMENT STRATEGIES 24 INTRODUCTION Once state level policymakers have decided to implement and pay for CSR, one issue they face is simply how to calculate the reimbursements to districts
School Competition and Efficiency with Publicly Funded Catholic Schools David Card, Martin D. Dooley, and A. Abigail Payne
 School Competition and Efficiency with Publicly Funded Catholic Schools David Card, Martin D. Dooley, and A. Abigail Payne Web Appendix See paper for references to Appendix Appendix 1: Multiple Schools
Algebra 1, Quarter 3, Unit 3.1. Line of Best Fit. Overview
 Algebra 1, Quarter 3, Unit 3.1 Line of Best Fit Overview Number of instructional days 6 (1 day assessment) (1 day = 45 minutes) Content to be learned Analyze scatter plots and construct the line of best
A Comparison of Charter Schools and Traditional Public Schools in Idaho
 A Comparison of Charter Schools and Traditional Public Schools in Idaho Dale Ballou Bettie Teasley Tim Zeidner Vanderbilt University August, 2006 Abstract We investigate the effectiveness of Idaho charter
The Impacts of Regular Upward Bound on Postsecondary Outcomes 7-9 Years After Scheduled High School Graduation
 Contract No.: EA97030001 MPR Reference No.: 6130-800 The Impacts of Regular Upward Bound on Postsecondary Outcomes 7-9 Years After Scheduled High School Graduation Final Report January 2009 Neil S. Seftor
learning collegiate assessment]
![learning collegiate assessment]](/thumbs/71/66063392.jpg "learning collegiate assessment]") [ collegiate learning assessment] INSTITUTIONAL REPORT 2005 2006 Kalamazoo College council for aid to education 215 lexington avenue floor 21 new york new york 10016-6023 p 212.217.0700 f 212.661.9766
[ collegiate learning assessment] INSTITUTIONAL REPORT 2005 2006 Kalamazoo College council for aid to education 215 lexington avenue floor 21 new york new york 10016-6023 p 212.217.0700 f 212.661.9766
ABILITY SORTING AND THE IMPORTANCE OF COLLEGE QUALITY TO STUDENT ACHIEVEMENT: EVIDENCE FROM COMMUNITY COLLEGES
 ABILITY SORTING AND THE IMPORTANCE OF COLLEGE QUALITY TO STUDENT ACHIEVEMENT: EVIDENCE FROM COMMUNITY COLLEGES Kevin Stange Ford School of Public Policy University of Michigan Ann Arbor, MI 48109-3091
The Effects of Statewide Private School Choice on College Enrollment and Graduation
 E D U C A T I O N P O L I C Y P R O G R A M R E S E A RCH REPORT The Effects of Statewide Private School Choice on College Enrollment and Graduation Evidence from the Florida Tax Credit Scholarship Program
College Pricing. Ben Johnson. April 30, Abstract. Colleges in the United States price discriminate based on student characteristics
 College Pricing Ben Johnson April 30, 2012 Abstract Colleges in the United States price discriminate based on student characteristics such as ability and income. This paper develops a model of college
University-Based Induction in Low-Performing Schools: Outcomes for North Carolina New Teacher Support Program Participants in
 University-Based Induction in Low-Performing Schools: Outcomes for North Carolina New Teacher Support Program Participants in 2014-15 In this policy brief we assess levels of program participation and
ROA Technical Report. Jaap Dronkers ROA-TR-2014/1. Research Centre for Education and the Labour Market ROA
 Research Centre for Education and the Labour Market ROA Parental background, early scholastic ability, the allocation into secondary tracks and language skills at the age of 15 years in a highly differentiated
Estimating the Cost of Meeting Student Performance Standards in the St. Louis Public Schools
 Estimating the Cost of Meeting Student Performance Standards in the St. Louis Public Schools Prepared by: William Duncombe Professor of Public Administration Education Finance and Accountability Program
Effective Pre-school and Primary Education 3-11 Project (EPPE 3-11)
") Effective Pre-school and Primary Education 3-11 Project (EPPE 3-11) A longitudinal study funded by the DfES (2003 2008) Exploring pupils views of primary school in Year 5 Address for correspondence: EPPSE
Effective Pre-school and Primary Education 3-11 Project (EPPE 3-11) A longitudinal study funded by the DfES (2003 2008) Exploring pupils views of primary school in Year 5 Address for correspondence: EPPSE
CAAP. Content Analysis Report. Sample College. Institution Code: 9011 Institution Type: 4-Year Subgroup: none Test Date: Spring 2011
 CAAP Content Analysis Report Institution Code: 911 Institution Type: 4-Year Normative Group: 4-year Colleges Introduction This report provides information intended to help postsecondary institutions better
Effectiveness of McGraw-Hill s Treasures Reading Program in Grades 3 5. October 21, Research Conducted by Empirical Education Inc.
 Effectiveness of McGraw-Hill s Treasures Reading Program in Grades 3 5 October 21, 2010 Research Conducted by Empirical Education Inc. Executive Summary Background. Cognitive demands on student knowledge
Longitudinal Analysis of the Effectiveness of DCPS Teachers
 F I N A L R E P O R T Longitudinal Analysis of the Effectiveness of DCPS Teachers July 8, 2014 Elias Walsh Dallas Dotter Submitted to: DC Education Consortium for Research and Evaluation School of Education
Psychometric Research Brief Office of Shared Accountability
 August 2012 Psychometric Research Brief Office of Shared Accountability Linking Measures of Academic Progress in Mathematics and Maryland School Assessment in Mathematics Huafang Zhao, Ph.D. This brief
Miami-Dade County Public Schools
 ENGLISH LANGUAGE LEARNERS AND THEIR ACADEMIC PROGRESS: 2010-2011 Author: Aleksandr Shneyderman, Ed.D. January 2012 Research Services Office of Assessment, Research, and Data Analysis 1450 NE Second Avenue,
BENCHMARK TREND COMPARISON REPORT:
 National Survey of Student Engagement (NSSE) BENCHMARK TREND COMPARISON REPORT: CARNEGIE PEER INSTITUTIONS, 2003-2011 PREPARED BY: ANGEL A. SANCHEZ, DIRECTOR KELLI PAYNE, ADMINISTRATIVE ANALYST/ SPECIALIST
ASSESSMENT REPORT FOR GENERAL EDUCATION CATEGORY 1C: WRITING INTENSIVE
 ASSESSMENT REPORT FOR GENERAL EDUCATION CATEGORY 1C: WRITING INTENSIVE March 28, 2002 Prepared by the Writing Intensive General Education Category Course Instructor Group Table of Contents Section Page
OPTIMIZATINON OF TRAINING SETS FOR HEBBIAN-LEARNING- BASED CLASSIFIERS
 OPTIMIZATINON OF TRAINING SETS FOR HEBBIAN-LEARNING- BASED CLASSIFIERS Václav Kocian, Eva Volná, Michal Janošek, Martin Kotyrba University of Ostrava Department of Informatics and Computers Dvořákova 7,
The Relationship Between Tuition and Enrollment in WELS Lutheran Elementary Schools. Jason T. Gibson. Thesis
 The Relationship Between Tuition and Enrollment in WELS Lutheran Elementary Schools by Jason T. Gibson Thesis Submitted in partial fulfillment of the requirements for the Master of Science Degree in Education
Statewide Framework Document for:
 Statewide Framework Document for: 270301 Standards may be added to this document prior to submission, but may not be removed from the framework to meet state credit equivalency requirements. Performance
Gender and socioeconomic differences in science achievement in Australia: From SISS to TIMSS
 Gender and socioeconomic differences in science achievement in Australia: From SISS to TIMSS, Australian Council for Educational Research, thomson@acer.edu.au Abstract Gender differences in science amongst
On-the-Fly Customization of Automated Essay Scoring
 Research Report On-the-Fly Customization of Automated Essay Scoring Yigal Attali Research & Development December 2007 RR-07-42 On-the-Fly Customization of Automated Essay Scoring Yigal Attali ETS, Princeton,
Evidence for Reliability, Validity and Learning Effectiveness
 PEARSON EDUCATION Evidence for Reliability, Validity and Learning Effectiveness Introduction Pearson Knowledge Technologies has conducted a large number and wide variety of reliability and validity studies
Lecture 1: Machine Learning Basics
 1/69 Lecture 1: Machine Learning Basics Ali Harakeh University of Waterloo WAVE Lab ali.harakeh@uwaterloo.ca May 1, 2017 2/69 Overview 1 Learning Algorithms 2 Capacity, Overfitting, and Underfitting 3
Access Center Assessment Report
 Access Center Assessment Report The purpose of this report is to provide a description of the demographics as well as higher education access and success of Access Center students at CSU. College access
w o r k i n g p a p e r s
 w o r k i n g p a p e r s 2 0 0 9 Assessing the Potential of Using Value-Added Estimates of Teacher Job Performance for Making Tenure Decisions Dan Goldhaber Michael Hansen crpe working paper # 2009_2
Standards-based Mathematics Curricula and Middle-Grades Students Performance on Standardized Achievement Tests
 Journal for Research in Mathematics Education 2008, Vol. 39, No. 2, 184 212 Standards-based Mathematics Curricula and Middle-Grades Students Performance on Standardized Achievement Tests Thomas R. Post
STA 225: Introductory Statistics (CT)
") Marshall University College of Science Mathematics Department STA 225: Introductory Statistics (CT) Course catalog description A critical thinking course in applied statistical reasoning covering basic
Marshall University College of Science Mathematics Department STA 225: Introductory Statistics (CT) Course catalog description A critical thinking course in applied statistical reasoning covering basic
PROFESSIONAL TREATMENT OF TEACHERS AND STUDENT ACADEMIC ACHIEVEMENT. James B. Chapman. Dissertation submitted to the Faculty of the Virginia
 PROFESSIONAL TREATMENT OF TEACHERS AND STUDENT ACADEMIC ACHIEVEMENT by James B. Chapman Dissertation submitted to the Faculty of the Virginia Polytechnic Institute and State University in partial fulfillment
TIMSS ADVANCED 2015 USER GUIDE FOR THE INTERNATIONAL DATABASE. Pierre Foy
 TIMSS ADVANCED 2015 USER GUIDE FOR THE INTERNATIONAL DATABASE Pierre Foy TIMSS Advanced 2015 orks User Guide for the International Database Pierre Foy Contributors: Victoria A.S. Centurino, Kerry E. Cotter,
A Program Evaluation of Connecticut Project Learning Tree Educator Workshops
 A Program Evaluation of Connecticut Project Learning Tree Educator Workshops Jennifer Sayers Dr. Lori S. Bennear, Advisor May 2012 Masters project submitted in partial fulfillment of the requirements for
Understanding and Interpreting the NRC s Data-Based Assessment of Research-Doctorate Programs in the United States (2010)
") Understanding and Interpreting the NRC s Data-Based Assessment of Research-Doctorate Programs in the United States (2010) Jaxk Reeves, SCC Director Kim Love-Myers, SCC Associate Director Presented at UGA
Understanding and Interpreting the NRC s Data-Based Assessment of Research-Doctorate Programs in the United States (2010) Jaxk Reeves, SCC Director Kim Love-Myers, SCC Associate Director Presented at UGA
Chapters 1-5 Cumulative Assessment AP Statistics November 2008 Gillespie, Block 4
 Chapters 1-5 Cumulative Assessment AP Statistics Name: November 2008 Gillespie, Block 4 Part I: Multiple Choice This portion of the test will determine 60% of your overall test grade. Each question is
Karla Brooks Baehr, Ed.D. Senior Advisor and Consultant The District Management Council
 Karla Brooks Baehr, Ed.D. Senior Advisor and Consultant The District Management Council This paper aims to inform the debate about how best to incorporate student learning into teacher evaluation systems
The Efficacy of PCI s Reading Program - Level One: A Report of a Randomized Experiment in Brevard Public Schools and Miami-Dade County Public Schools
 The Efficacy of PCI s Reading Program - Level One: A Report of a Randomized Experiment in Brevard Public Schools and Miami-Dade County Public Schools Megan Toby Boya Ma Andrew Jaciw Jessica Cabalo Empirical
Running head: DELAY AND PROSPECTIVE MEMORY 1
 Running head: DELAY AND PROSPECTIVE MEMORY 1 In Press at Memory & Cognition Effects of Delay of Prospective Memory Cues in an Ongoing Task on Prospective Memory Task Performance Dawn M. McBride, Jaclyn
GDP Falls as MBA Rises?
 Applied Mathematics, 2013, 4, 1455-1459 http://dx.doi.org/10.4236/am.2013.410196 Published Online October 2013 (http://www.scirp.org/journal/am) GDP Falls as MBA Rises? T. N. Cummins EconomicGPS, Aurora,
Role Models, the Formation of Beliefs, and Girls Math. Ability: Evidence from Random Assignment of Students. in Chinese Middle Schools
 Role Models, the Formation of Beliefs, and Girls Math Ability: Evidence from Random Assignment of Students in Chinese Middle Schools Alex Eble and Feng Hu February 2017 Abstract This paper studies the
Evaluation of Teach For America:
 EA15-536-2 Evaluation of Teach For America: 2014-2015 Department of Evaluation and Assessment Mike Miles Superintendent of Schools This page is intentionally left blank. ii Evaluation of Teach For America:
The relationship between national development and the effect of school and student characteristics on educational achievement.
 The relationship between national development and the effect of school and student characteristics on educational achievement. A crosscountry exploration. Abstract Since the publication of two controversial
Teacher Supply and Demand in the State of Wyoming
 Teacher Supply and Demand in the State of Wyoming Supply Demand Prepared by Robert Reichardt 2002 McREL To order copies of Teacher Supply and Demand in the State of Wyoming, contact McREL: Mid-continent
Massachusetts Department of Elementary and Secondary Education. Title I Comparability
 Massachusetts Department of Elementary and Secondary Education Title I Comparability 2009-2010 Title I provides federal financial assistance to school districts to provide supplemental educational services
THE PENNSYLVANIA STATE UNIVERSITY SCHREYER HONORS COLLEGE DEPARTMENT OF MATHEMATICS ASSESSING THE EFFECTIVENESS OF MULTIPLE CHOICE MATH TESTS
 THE PENNSYLVANIA STATE UNIVERSITY SCHREYER HONORS COLLEGE DEPARTMENT OF MATHEMATICS ASSESSING THE EFFECTIVENESS OF MULTIPLE CHOICE MATH TESTS ELIZABETH ANNE SOMERS Spring 2011 A thesis submitted in partial
Python Machine Learning
 Python Machine Learning Unlock deeper insights into machine learning with this vital guide to cuttingedge predictive analytics Sebastian Raschka [ PUBLISHING 1 open source I community experience distilled
Systematic reviews in theory and practice for library and information studies
 Systematic reviews in theory and practice for library and information studies Sue F. Phelps, Nicole Campbell Abstract This article is about the use of systematic reviews as a research methodology in library
National Survey of Student Engagement (NSSE) Temple University 2016 Results
 Temple University 2016 Results") Introduction The National Survey of Student Engagement (NSSE) is administered by hundreds of colleges and universities every year (560 in 2016), and is designed to measure the amount of time and effort
Introduction The National Survey of Student Engagement (NSSE) is administered by hundreds of colleges and universities every year (560 in 2016), and is designed to measure the amount of time and effort
Rote rehearsal and spacing effects in the free recall of pure and mixed lists. By: Peter P.J.L. Verkoeijen and Peter F. Delaney
 Rote rehearsal and spacing effects in the free recall of pure and mixed lists By: Peter P.J.L. Verkoeijen and Peter F. Delaney Verkoeijen, P. P. J. L, & Delaney, P. F. (2008). Rote rehearsal and spacing
Early Warning System Implementation Guide
 Linking Research and Resources for Better High Schools betterhighschools.org September 2010 Early Warning System Implementation Guide For use with the National High School Center s Early Warning System
Unequal Opportunity in Environmental Education: Environmental Education Programs and Funding at Contra Costa Secondary Schools.
 Unequal Opportunity in Environmental Education: Environmental Education Programs and Funding at Contra Costa Secondary Schools Angela Freitas Abstract Unequal opportunity in education threatens to deprive
VOL. 3, NO. 5, May 2012 ISSN Journal of Emerging Trends in Computing and Information Sciences CIS Journal. All rights reserved.
 Exploratory Study on Factors that Impact / Influence Success and failure of Students in the Foundation Computer Studies Course at the National University of Samoa 1 2 Elisapeta Mauai, Edna Temese 1 Computing
The Relation Between Socioeconomic Status and Academic Achievement
 Psychological Bulletin 1982, Vol. 91, No. 3, 461-481 Copyright 1982 by the American Psychological Association, Inc. 0033-2909/82/9103-0461S00.75 The Relation Between Socioeconomic Status and Academic Achievement
Practices Worthy of Attention Step Up to High School Chicago Public Schools Chicago, Illinois
 Step Up to High School Chicago Public Schools Chicago, Illinois Summary of the Practice. Step Up to High School is a four-week transitional summer program for incoming ninth-graders in Chicago Public Schools.
A Guide to Adequate Yearly Progress Analyses in Nevada 2007 Nevada Department of Education
 A Guide to Adequate Yearly Progress Analyses in Nevada 2007 Nevada Department of Education Note: Additional information regarding AYP Results from 2003 through 2007 including a listing of each individual
Multiple regression as a practical tool for teacher preparation program evaluation
 Multiple regression as a practical tool for teacher preparation program evaluation ABSTRACT Cynthia Williams Texas Christian University In response to No Child Left Behind mandates, budget cuts and various
The Impact of Honors Programs on Undergraduate Academic Performance, Retention, and Graduation
 University of Nebraska - Lincoln DigitalCommons@University of Nebraska - Lincoln Journal of the National Collegiate Honors Council - -Online Archive National Collegiate Honors Council Fall 2004 The Impact
Educational Attainment
 A Demographic and Socio-Economic Profile of Allen County, Indiana based on the 2010 Census and the American Community Survey Educational Attainment A Review of Census Data Related to the Educational Attainment
Iowa School District Profiles. Le Mars
 Iowa School District Profiles Overview This profile describes enrollment trends, student performance, income levels, population, and other characteristics of the public school district. The report utilizes
Governors and State Legislatures Plan to Reauthorize the Elementary and Secondary Education Act
 Governors and State Legislatures Plan to Reauthorize the Elementary and Secondary Education Act Summary In today s competitive global economy, our education system must prepare every student to be successful
Evaluation of a College Freshman Diversity Research Program
 Evaluation of a College Freshman Diversity Research Program Sarah Garner University of Washington, Seattle, Washington 98195 Michael J. Tremmel University of Washington, Seattle, Washington 98195 Sarah
Honors Mathematics. Introduction and Definition of Honors Mathematics
 Honors Mathematics Introduction and Definition of Honors Mathematics Honors Mathematics courses are intended to be more challenging than standard courses and provide multiple opportunities for students
Jason A. Grissom Susanna Loeb. Forthcoming, American Educational Research Journal
 Triangulating Principal Effectiveness: How Perspectives of Parents, Teachers, and Assistant Principals Identify the Central Importance of Managerial Skills Jason A. Grissom Susanna Loeb Forthcoming, American
The Good Judgment Project: A large scale test of different methods of combining expert predictions
 The Good Judgment Project: A large scale test of different methods of combining expert predictions Lyle Ungar, Barb Mellors, Jon Baron, Phil Tetlock, Jaime Ramos, Sam Swift The University of Pennsylvania
Firms and Markets Saturdays Summer I 2014
 PRELIMINARY DRAFT VERSION. SUBJECT TO CHANGE. Firms and Markets Saturdays Summer I 2014 Professor Thomas Pugel Office: Room 11-53 KMC E-mail: tpugel@stern.nyu.edu Tel: 212-998-0918 Fax: 212-995-4212 This
Rural Education in Oregon
 Rural Education in Oregon Overcoming the Challenges of Income and Distance ECONorthwest )'3231-'7 *-2%2') 40%22-2+ Cover photos courtesy of users Lars Plougmann, San José Library, Jared and Corin, U.S.Department
NBER WORKING PAPER SERIES ARE EXPECTATIONS ALONE ENOUGH? ESTIMATING THE EFFECT OF A MANDATORY COLLEGE-PREP CURRICULUM IN MICHIGAN
 NBER WORKING PAPER SERIES ARE EXPECTATIONS ALONE ENOUGH? ESTIMATING THE EFFECT OF A MANDATORY COLLEGE-PREP CURRICULUM IN MICHIGAN Brian Jacob Susan Dynarski Kenneth Frank Barbara Schneider Working Paper
Financing Education In Minnesota
 Financing Education In Minnesota 2016-2017 Created with Tagul.com A Publication of the Minnesota House of Representatives Fiscal Analysis Department August 2016 Financing Education in Minnesota 2016-17
Grade Dropping, Strategic Behavior, and Student Satisficing
 Grade Dropping, Strategic Behavior, and Student Satisficing Lester Hadsell Department of Economics State University of New York, College at Oneonta Oneonta, NY 13820 hadsell@oneonta.edu Raymond MacDermott
The Relationship Between Poverty and Achievement in Maine Public Schools and a Path Forward
 The Relationship Between Poverty and Achievement in Maine Public Schools and a Path Forward Peer Learning Session MELMAC Education Foundation Dr. David L. Silvernail Director Applied Research, and Evaluation
Charter School Performance Comparable to Other Public Schools; Stronger Accountability Needed
 April 2005 Report No. 05-21 Charter School Performance Comparable to Other Public Schools; Stronger Accountability Needed at a glance On average, charter school students are academically behind when they
EXECUTIVE SUMMARY. Online courses for credit recovery in high schools: Effectiveness and promising practices. April 2017
 EXECUTIVE SUMMARY Online courses for credit recovery in high schools: Effectiveness and promising practices April 2017 Prepared for the Nellie Mae Education Foundation by the UMass Donahue Institute 1
Research Update. Educational Migration and Non-return in Northern Ireland May 2008
 Research Update Educational Migration and Non-return in Northern Ireland May 2008 The Equality Commission for Northern Ireland (hereafter the Commission ) in 2007 contracted the Employment Research Institute
The Effect of Written Corrective Feedback on the Accuracy of English Article Usage in L2 Writing
 Journal of Applied Linguistics and Language Research Volume 3, Issue 1, 2016, pp. 110-120 Available online at www.jallr.com ISSN: 2376-760X The Effect of Written Corrective Feedback on the Accuracy of
Lahore University of Management Sciences. FINN 321 Econometrics Fall Semester 2017
 Instructor Syed Zahid Ali Room No. 247 Economics Wing First Floor Office Hours Email szahid@lums.edu.pk Telephone Ext. 8074 Secretary/TA TA Office Hours Course URL (if any) Suraj.lums.edu.pk FINN 321 Econometrics
Social, Economical, and Educational Factors in Relation to Mathematics Achievement
 Social, Economical, and Educational Factors in Relation to Mathematics Achievement Aistė Elijio, Jolita Dudaitė Abstract In the article, impacts of some social, economical, and educational factors for
ECON 365 fall papers GEOS 330Z fall papers HUMN 300Z fall papers PHIL 370 fall papers
 Assessing Critical Thinking in GE In Spring 2016 semester, the GE Curriculum Advisory Board (CAB) engaged in assessment of Critical Thinking (CT) across the General Education program. The assessment was
Assignment 1: Predicting Amazon Review Ratings
 Assignment 1: Predicting Amazon Review Ratings 1 Dataset Analysis Richard Park r2park@acsmail.ucsd.edu February 23, 2015 The dataset selected for this assignment comes from the set of Amazon reviews for
Shyness and Technology Use in High School Students. Lynne Henderson, Ph. D., Visiting Scholar, Stanford
 Shyness and Technology Use in High School Students Lynne Henderson, Ph. D., Visiting Scholar, Stanford University Philip Zimbardo, Ph.D., Professor, Psychology Department Charlotte Smith, M.S., Graduate
MGT/MGP/MGB 261: Investment Analysis
 UNIVERSITY OF CALIFORNIA, DAVIS GRADUATE SCHOOL OF MANAGEMENT SYLLABUS for Fall 2014 MGT/MGP/MGB 261: Investment Analysis Daytime MBA: Tu 12:00p.m. - 3:00 p.m. Location: 1302 Gallagher (CRN: 51489) Sacramento
APA Basics. APA Formatting. Title Page. APA Sections. Title Page. Title Page
 APA Formatting APA Basics Abstract, Introduction & Formatting/Style Tips Psychology 280 Lecture Notes Basic word processing format Double spaced All margins 1 Manuscript page header on all pages except
The Oregon Literacy Framework of September 2009 as it Applies to grades K-3
 The Oregon Literacy Framework of September 2009 as it Applies to grades K-3 The State Board adopted the Oregon K-12 Literacy Framework (December 2009) as guidance for the State, districts, and schools
PETER BLATCHFORD, PAUL BASSETT, HARVEY GOLDSTEIN & CLARE MARTIN,
 British Educational Research Journal Vol. 29, No. 5, October 2003 Are Class Size Differences Related to Pupils Educational Progress and Classroom Processes? Findings from the Institute of Education Class
Rules and Discretion in the Evaluation of Students and Schools: The Case of the New York Regents Examinations *
 Rules and Discretion in the Evaluation of Students and Schools: The Case of the New York Regents Examinations * Thomas S. Dee University of Virginia and NBER dee@virginia.edu Brian A. Jacob University
Trends in College Pricing
 Trends in College Pricing 2009 T R E N D S I N H I G H E R E D U C A T I O N S E R I E S T R E N D S I N H I G H E R E D U C A T I O N S E R I E S Highlights Published Tuition and Fee and Room and Board
How to Judge the Quality of an Objective Classroom Test
 How to Judge the Quality of an Objective Classroom Test Technical Bulletin #6 Evaluation and Examination Service The University of Iowa (319) 335-0356 HOW TO JUDGE THE QUALITY OF AN OBJECTIVE CLASSROOM
KENTUCKY FRAMEWORK FOR TEACHING
 KENTUCKY FRAMEWORK FOR TEACHING With Specialist Frameworks for Other Professionals To be used for the pilot of the Other Professional Growth and Effectiveness System ONLY! School Library Media Specialists
MASTER S THESIS GUIDE MASTER S PROGRAMME IN COMMUNICATION SCIENCE
 MASTER S THESIS GUIDE MASTER S PROGRAMME IN COMMUNICATION SCIENCE University of Amsterdam Graduate School of Communication Kloveniersburgwal 48 1012 CX Amsterdam The Netherlands E-mail address: scripties-cw-fmg@uva.nl
Entrepreneurial Discovery and the Demmert/Klein Experiment: Additional Evidence from Germany
 Entrepreneurial Discovery and the Demmert/Klein Experiment: Additional Evidence from Germany Jana Kitzmann and Dirk Schiereck, Endowed Chair for Banking and Finance, EUROPEAN BUSINESS SCHOOL, International
NATIONAL CENTER FOR EDUCATION STATISTICS RESPONSE TO RECOMMENDATIONS OF THE NATIONAL ASSESSMENT GOVERNING BOARD AD HOC COMMITTEE ON.
 NATIONAL CENTER FOR EDUCATION STATISTICS RESPONSE TO RECOMMENDATIONS OF THE NATIONAL ASSESSMENT GOVERNING BOARD AD HOC COMMITTEE ON NAEP TESTING AND REPORTING OF STUDENTS WITH DISABILITIES (SD) AND ENGLISH
Politics and Society Curriculum Specification
 Leaving Certificate Politics and Society Curriculum Specification Ordinary and Higher Level 1 September 2015 2 Contents Senior cycle 5 The experience of senior cycle 6 Politics and Society 9 Introduction