KERN COMMUNITY COLLEGE DISTRICT INTERNAL SCAN. Institutional Research & Reporting
|
|
|
- Carmella Carroll
- 6 years ago
- Views:
Transcription
1 KERN COMMUNITY COLLEGE DISTRICT INTERNAL SCAN Institutional Research & Reporting June 2014
2 Table of Contents Section 1: Student Demographic Data... 3 Headcount... 3 Gender... 4 Age... 5 Race/ Ethnicity... 6 City... 7 Educational Level... 9 Incoming Student Placement Bakersfield College Cerro Coso Community College Porterville College Educational Goal Unit Load Specific Populations Financial Aid Other Populations Student Progress Section 2: Enrollment Data Campus Course Enrollment Activity Bakersfield College: All Courses Bakersfield College: Online Courses Bakersfield College: Sections and Enrollments Cerro Coso Community College: All Courses Cerro Coso Community College: Online Courses Cerro Coso Community College: Sections and Enrollments Porterville College: All Courses Porterville College: Online Courses Porterville College: Sections and Enrollments Section 3: Student Outcomes Data Success & Retention Bakersfield College Cerro Coso Community College Porterville College Awards Transfers Student Success Scorecard Results Bakersfield College Cerro Coso Community College
3 Porterville College Section 4: Employee Data Employee Type Employee Gender Employee Age Employee Race and Ethnicity
4 KCCD INTERNAL SCAN This Internal Scan is one tool designed to assist Kern Community College District (KCCD) in its strategic planning. The internal scan is guided by the current district-wide goals and KCCD s underlying mission, vision, and values. It is organized into four sections: Student Demographic Data, Enrollment Data, Student Outcomes Data, and Employee Data. SECTION 1: STUDENT DEMOGRAPHIC DATA The first section contains data about KCCD students. To be included, a student must be enrolled in at least one course at Census of the specified fall term at the indicated college (a student may be enrolled at more than one college). Headcount The table below shows the headcount for each college over the past five fall terms. The table also shows the number of incoming students at each college each fall. A student is considered incoming if their first term enrolled at KCCD equals the specified fall term or the previous summer term. In general, the KCCD headcount declined between 2010 and While Cerro Coso endured the largest decrease, Bakersfield has an interesting dynamic in that the total enrollment has only decreased by 2% over five years, but the number of incoming students has decreased by 15% in the same time frame year % Change Bakersfield College Total Headcount 18,690 19,886 18,078 18,101 18,296-2% Incoming Students 5,191 4,874 4,025 4,207 4,397-15% Cerro Coso Community College Total Headcount 6,351 6,687 5,835 5,004 4,641-27% Incoming Students 1,538 1,663 1,482 1,123 1,240-19% Porterville College Total Headcount 4,613 4,359 4,183 3,910 3,903-15% Incoming Students 1,079 1, % Total KCCD Students 1 Total Headcount 28,884 29,722 26,953 26,183 26,112-10% Incoming Students 7,673 7,368 6,297 6,209 6,502-15% 1 Total KCCD Students is an unduplicated count of students enrolled at KCCD in the specified term. 3


5 Headcount (continued) The following graph shows incoming students as a percent of the total student population for each college for 2009 and While incoming students constitute a higher percentage of CC and PC s student body in 2013 than in 2009, incoming students constitute a lower percentage of BC s student body in 2013 compared to and 2013 Comparison of Incoming Students as a Percent of the Total Student Population Gender At all three colleges, females are the majority, with CC showing the largest split. Over the past five years, the gender composition of BC's student population has remained stable. Females at CC have increased from 57% in 2009 to 64% in 2013; while males at PC have increased from 36% in 2009 to 39% in % Bakersfield Cerro Coso Porterville Note: The unknown category is not included in the chart above. 4
6 Age At all three colleges, the majority of students are in the age range. The age group also had the largest increase over the past five years, with PC experiencing the most growth. The students who attend CC are older than the students at the other colleges with the average age of their incoming students being 25 compared to 20 at BC and 21 at PC. The following table, along with many other tables in this document, displays data for the past five fall terms with the most recent term illustrated graphically. In this case, the table shows the age distribution of all enrolled students. Age 5-year Average Age of change Students Bakersfield College % Points Incoming Total 19 or younger 29% 26% 26% 25% 27% % 35% 37% 39% 39% % 14% 13% 13% 13% % 14% 13% 13% 12% % 7% 7% 6% 6% 0 50 or older 4% 4% 4% 4% 3% -1 Total Students 18,690 19,886 18,078 18,101 18,296 Cerro Coso Community College 19 or younger 18% 16% 17% 17% 17% % 24% 26% 26% 28% % 16% 16% 16% 17% % 20% 20% 20% 19% % 14% 13% 12% 11% or older 13% 10% 8% 9% 8% -5 Total Students 6,351 6,687 5,835 5,004 4,641 Porterville College 19 or younger 25% 26% 26% 27% 26% % 34% 37% 38% 41% % 14% 12% 14% 13% % 14% 14% 12% 11% % 8% 8% 6% 6% or older 7% 4% 3% 3% 3% -4 Total Students 4,613 4,359 4,183 3,910 3,903 5
7 Race/ Ethnicity The majority of students at BC and PC are Hispanic/ Latino. The majority of students at CC are White, with Hispanic/ Latino being the second largest population. All three colleges experienced an increase in the percent of Hispanic/ Latino students over the past 5 years and a corresponding decrease in White students. The race and ethnicity of incoming students is similar to that of all students. Race & Ethnicity 5-year change Bakersfield College % Points African American 7% 7% 7% 6% 5% -2 American Indian 1% 1% 1% 0% 1% 0 Asian/ Filipino/ Pac. Isl. 5% 5% 4% 5% 4% -1 Hispanic/ Latino 51% 53% 55% 58% 62% 11 White 32% 30% 29% 27% 24% -8 Two or more races 2% 3% 3% 3% 3% 1 Unknown 2% 1% 1% 1% 1% -1 Total Students 18,690 19,886 18,078 18,101 18,296 Cerro Coso Community College African American 5% 6% 6% 6% 5% 0 American Indian 3% 2% 2% 2% 2% -1 Asian/ Filipino/ Pac. Isl. 4% 4% 4% 4% 4% 0 Hispanic/ Latino 20% 24% 27% 30% 34% 14 White 63% 59% 55% 53% 49% -14 Two or more races 3% 4% 5% 5% 5% 2 Unknown 2% 1% 1% 0% 1% -1 Total Students 6,351 6,687 5,835 5,004 4,641 Porterville College African American 2% 2% 2% 1% 1% -1 American Indian 2% 1% 1% 1% 1% -1 Asian/ Filipino/ Pac. Isl. 6% 6% 5% 5% 4% -2 Hispanic/ Latino 60% 62% 65% 68% 71% 11 White 28% 26% 25% 23% 20% -8 Two or more races 1% 2% 2% 2% 3% 2 Unknown 1% 1% 0% 0% 0% -1 Total Students 4,613 4,359 4,183 3,910 3,903 6


8 City The table below shows the city of residence for KCCD students. BC and PC serve a more concentrated area, where a vast majority of their students live in Bakersfield or Porterville, respectively. CC serves a wider region as more than 20% of their students live outside of the KCCD service area. City of Residence Bakersfield College Bakersfield 76% 75% 76% 76% Delano 6% 7% 7% 7% Arvin 2% 2% 2% 2% Tehachapi 2% 2% 2% 2% Wasco 2% 2% 2% 2% Lamont 2% 2% 2% 2% Shafter 2% 1% 1% 1% Other In-District Service Area 4% 5% 4% 4% Other Out-of-District Service Area 4% 4% 4% 4% 3% Total Students 18,690 19,886 18,078 18,101 18,296 Cerro Coso Community College Ridgecrest 30% 25% 24% 27% Bakersfield 21% 25% 24% 23% Bishop 6% 6% 5% 6% Mammoth Lakes 3% 3% 3% 3% Lake Isabella 4% 3% 4% 3% Porterville 1% 1% 1% 1% Lancaster 1% 2% 2% 2% Tehachapi 2% 2% 2% 2% Other In-District Service Area 14% 14% 14% 13% Other Out-of-District Service Area 18% 19% 21% 20% 7% 2% 2% 2% 2% 2% 4% Total Students 6,351 6,687 5,835 5,004 4,641 Porterville College Porterville 65% 64% 64% 66% Lindsay 6% 6% 5% 5% 6% Strathmore 3% 4% 4% 4% 4% Terra Bella 4% 4% 4% 4% 4% Tulare 1% 2% 2% 2% 3% Bakersfield 4% 5% 5% 4% 2% Springville 3% 2% 2% 2% 2% Delano 4% 4% 4% 3% 2% Visalia 2% 1% 2% 2% 2% Other In-District Service Area 4% 4% 4% 4% 3% Other Out-of-District Service Area 4% 4% 4% 4% 3% Total Students 4,613 4,359 4,183 3,910 3, % 17% 5% 4% 3% 2% 2% 2% 14% 21% 76% 33% of incoming students reside outside of the district service area. 69% The following page contains a partial map of California for a visual representation of where all 2013 KCCD students reside. 7
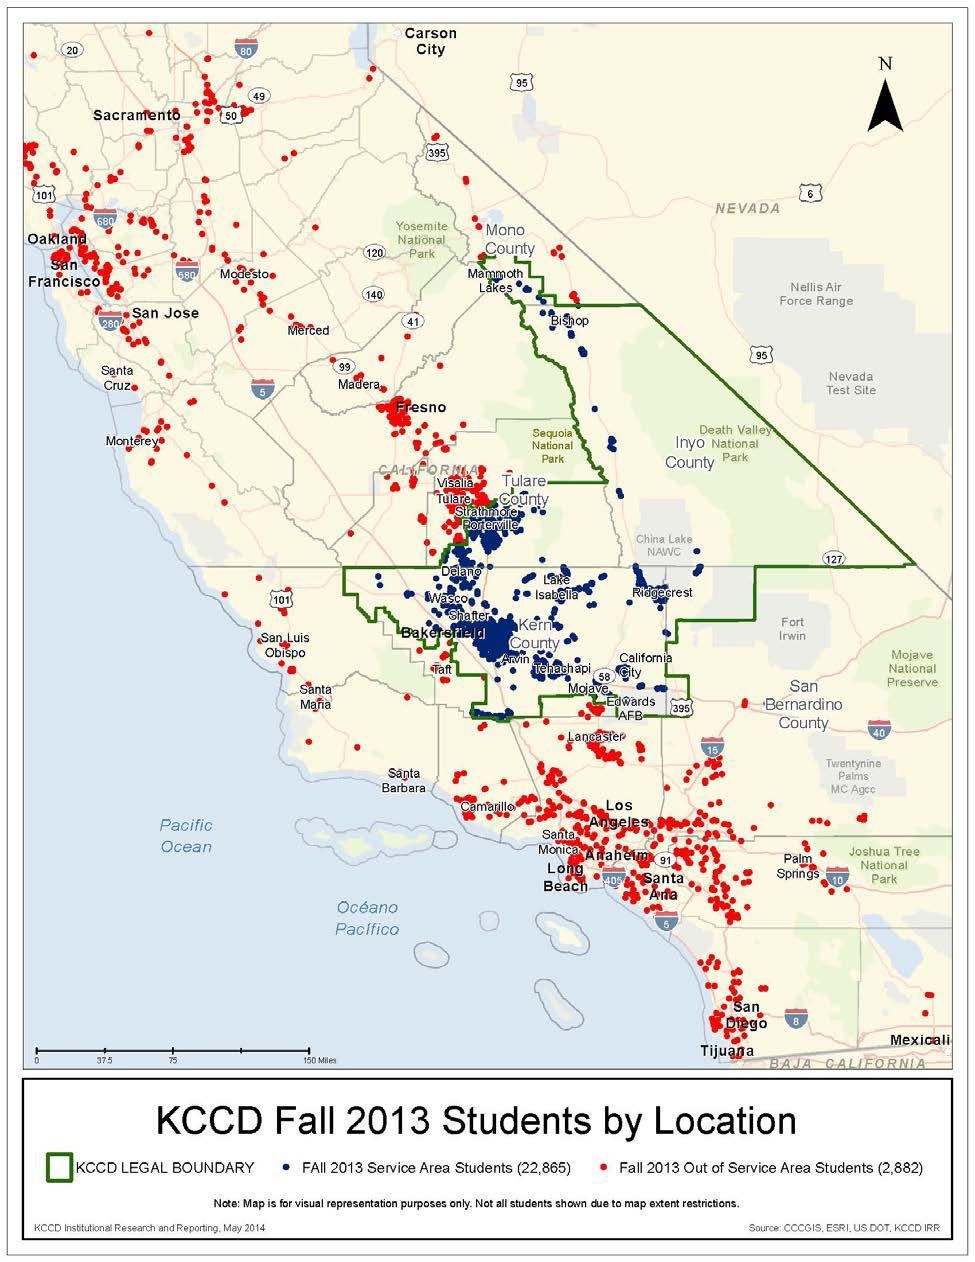
9 City (continued) 8
10 Educational Level At all three locations, the vast majority of students have obtained a high school diploma before enrolling in college. Educational Level 5-year change Bakersfield College % Points Not HS Grad 2% 3% 2% 2% 1% -1 Special Admit 1% 1% 0% 0% 1% 0 Enrolled at Adult School 0% 0% 1% 0% 0% 0 Received HS Diploma 79% 80% 82% 81% 84% 5 Passed GED 8% 7% 6% 7% 5% -3 Received HS Prof. 1% 1% 1% 0% 1% 0 Foreign Secondary School 1% 1% 1% 1% 1% 0 Received AA 5% 4% 4% 5% 4% -1 Received BA 3% 3% 3% 4% 3% 0 Unknown 0% 0% 0% 0% 0% 0 Total Students 18,690 19,886 18,078 18,101 18,296 Cerro Coso Community College Not HS Grad 4% 4% 3% 2% 2% -2 Special Admit 5% 3% 4% 3% 4% -1 Enrolled at Adult School 1% 1% 1% 1% 0% -1 Received HS Diploma 63% 68% 69% 69% 70% 7 Passed GED 7% 8% 8% 8% 7% 0 Received HS Prof. 1% 1% 1% 1% 1% 0 Foreign Secondary School 1% 1% 1% 1% 1% 0 Received AA 8% 7% 6% 7% 7% -1 Received BA 10% 7% 7% 8% 8% -2 Unknown 0% 0% 0% 0% 0% 0 Total Students 6,351 6,687 5,835 5,004 4,641 Porterville College Not HS Grad 5% 4% 4% 3% 3% -2 Special Admit 2% 1% 1% 0% 1% -1 Enrolled at Adult School 1% 1% 1% 0% 0% -1 Received HS Diploma 73% 78% 80% 80% 83% 10 Passed GED 10% 9% 9% 9% 6% -4 Received HS Prof. 0% 1% 0% 1% 1% 1 Foreign Secondary School 1% 1% 1% 1% 1% 0 Received AA 6% 4% 3% 4% 4% -2 Received BA 2% 1% 1% 2% 1% -1 Unknown 0% 0% 0% 0% 0% 0 Total Students 4,613 4,359 4,183 3,910 3,903 9
 in which a student needed remediation, among incoming students who completed at least one assessment.")

11 Incoming Student Placement This section details placement information for incoming students who completed assessment testing. The chart below displays the number of areas (English, Math, and Reading) in which a student needed remediation, among incoming students who completed at least one assessment. Of all 2013 incoming students who completed at least one assessment test: 81% of BC s incoming students needed remediation 72% of CC s incoming students needed remediation 91% of PC s incoming students needed remediation The chart below shows the percentage of incoming students who did not complete any assessment over the past five fall terms for each college. At BC, the percentage of students not completing assessment has been decreasing over the past five years to only 12% of 2013 incoming students. CC has also experienced a decrease, but with just under half of their incoming students not completing assessment in PC has experienced a slight increase in the percentage of students not completing assessment over the past five years with just over a quarter of their incoming students not completing assessment. 10
12 Bakersfield College While over half of the students who completed an English assessment in 2013 placed into the remedial level, that number has declined over the past five years. However, the percentage of students placing into remedial math has increased since In 2013, 71% of the students who completed their math assessment placed into the remedial level. Conversely, almost two-thirds of the students who completed their reading assessment did not need remediation. Incoming Student Placement year change Bakersfield College % Points English Remedial 69% 67% 68% 63% 64% -5 Transfer 31% 33% 32% 37% 36% 5 Total Students Assessed 4,201 4,093 3,363 3,402 3,465 Math Remedial 66% 68% 74% 74% 71% 5 Degree-Applicable 15% 14% 12% 12% 13% -2 Transfer 19% 18% 14% 14% 16% -3 Total Students Assessed 4,314 4,187 3,515 3,668 3,869 Reading Remedial Needed 38% 38% 39% 37% 35% -3 No Remediation 62% 62% 61% 63% 65% 3 Total Students Assessed 4,051 3,914 3,248 3,217 3,285 Cerro Coso Community College Of the students who completed their English assessment, the percentage who placed into a remedial level has decreased since 2009, bringing the number below 50%. The percentage of students who placed into remedial math has increased considerably (45% in 2009 to 63% in 2013). Incoming Student Placement year change Cerro Coso Community College % Points English Remedial 55% 48% 44% 48% 46% -9 Degree-Applicable 22% 22% 23% 21% 25% 3 Transfer 23% 30% 33% 31% 29% 6 Total Students Assessed Math Remedial 45% 63% 62% 62% 63% 18 Degree-Applicable 38% 21% 22% 17% 20% -18 Transfer 17% 16% 16% 21% 17% 0 Total Students Assessed Reading Remedial Needed 54% 52% 46% 51% 52% -2 No Remediation 46% 48% 54% 49% 48% 2 Total Students Assessed

13 Porterville College Over 80% of the incoming students who completed their English assessment placed into the remedial level. A similar circumstance occurred with those students who completed their reading assessment. However, of the students who completed their math assessment, only about one third placed into remedial math, which has decreased considerably from Incoming Student Placement year change Porterville College % Points English Remedial 81% 81% 81% 81% 83% 2 Transfer 19% 19% 19% 19% 17% -2 Total Students Assessed Math Remedial 52% 46% 39% 39% 33% -19 Degree-Applicable 31% 37% 40% 36% 38% 7 Transfer 17% 17% 21% 25% 29% 12 Total Students Assessed Reading Remedial Needed 84% 84% 84% 85% 86% 2 No Remediation 16% 16% 16% 15% 14% -2 Total Students Assessed Educational Goal A student's educational goal is reported by the student on their admissions application or update form. The chart to the right shows the percentage of 2013 students who have declared an educational goal that leads to a certificate, degree, or transfer. At all three colleges, at least 60% of the total student population considers themselves degree- or transfer-seeking, with BC being 2013: Percentage of Degree- or Transfer-Seeking Students BC CC PC close to 70%. However, incoming students are more likely to consider themselves degree- or transferseeking by percentage points. 62% 61% 68% 76% 74% 84% Incoming Total 12
14 Educational Goal (continued) The following table shows the self-reported educational goals of students for the past 5 fall terms. In 2013, KCCD updated the application and update form revising the question regarding educational goal. Educational Goal Bakersfield College Associates degree w/out transfer 4% 3% 2% 2% 5% BA after completing AA 51% 49% 50% 50% BA w/out completing AA 8% 8% 7% 7% 10% Vocational degree/certificate 4% 4% 4% 3% 4% Other 1 18% 21% 21% 20% 17% Undecided 13% 14% 16% 17% 14% Unknown/ Uncollected 2% 1% 0% 1% 1% Total Students 18,690 19,886 18,078 18,101 18,296 Cerro Coso Community College Associates degree w/out transfer 3% 3% 2% 2% BA after completing AA 38% 40% 41% 41% BA w/out completing AA 6% 7% 7% 6% Vocational degree/certificate 4% 3% 4% 4% Other 1 34% 31% 29% 29% Undecided 15% 16% 17% 18% Unknown/ Uncollected 0% 0% 0% 0% 0% Total Students 6,351 6,687 5,835 5,004 4,641 Porterville College Associates degree w/out transfer 3% 3% 3% 2% 5% BA after completing AA 41% 42% 43% 44% BA w/out completing AA 5% 4% 4% 4% 7% Vocational degree/certificate 8% 7% 7% 6% 5% Other 1 26% 24% 22% 21% Undecided 17% 19% 21% 22% Unknown/ Uncollected 0% 0% 0% 0% 0% Total Students 4,613 4,359 4,183 3,910 3, Other educational goal includes: Discover career interests, Educational development, GED preparation, Improve basic skills, Job advancement, Maintain certificate/license, and Prepare for new career. 8% 9% 6% 23% 15% 19% 20% 39% 44% 49% 13
, each college has a")

15 Unit Load At all three locations, the percent of students enrolled in 12 or more units has been increasing in recent years. Bakersfield Cerro Coso Porterville Looking at incoming student data for the most current term ( 2013), each college has a distinct incoming student population in regards to unit load. BC and CC mirror the total student population; however, PC's incoming students are more likely to be enrolled full-time. 2013: Incoming Student Unit Load BC 44% 54% CC 28% 70% Part-time Full-time PC 41% 56% 14
16 Specific Populations Financial Aid At all three colleges, the percentage of students awarded financial aid has increased over the past 5 fall terms. PC has the most students awarded aid and CC had the largest increase in financial aid awards. Other Populations Over the past 5 fall terms, little has changed regarding the percent of students who participate in DSPS, EOPS, CalWORKS, or who are veterans year change % Points Bakersfield College DSPS 4.5% 4.6% 5.0% 4.9% 4.8% 0.3 EOPS 3.8% 3.2% 2.9% 2.5% 3.2% -0.6 CalWORKS 0.6% 0.7% 0.5% 0.5% 0.4% -0.2 Veterans 1.9% 1.8% 1.6% 1.5% 1.6% -0.3 Total Students 18,690 19,886 18,078 18,101 18,296 Cerro Coso Community College DSPS 3.7% 3.6% 3.5% 4.4% 4.7% 1.0 EOPS 6.7% 4.5% 4.9% 4.8% 4.8% -1.9 CalWORKS 1.0% 0.7% 0.7% 0.7% 0.6% -0.4 Veterans 3.0% 3.4% 3.4% 3.2% 3.0% 0.0 Total Students 6,351 6,687 5,835 5,004 4,641 Porterville College DSPS 6.5% 5.8% 5.5% 6.1% 5.7% -0.8 EOPS 9.8% 8.5% 8.7% 9.2% 9.1% -0.7 CalWORKS 2.2% 3.9% 4.2% 3.6% 4.7% 2.5 Veterans 1.4% 1.7% 2.1% 2.1% 2.2% 0.8 Total Students 4,613 4,359 4,183 3,910 3,903 15
17 Student Progress The student progress data in the table below provides information on key momentum points through a program of study. Three measures are included: students completing 12 units within their first term, students completing 12 units within their first year (increasing this rate is an objective in the District Strategic Plan), and students completing 30 units in their first year. A cohort of first-time students each fall term (prior summer attendance was allowed) were tracked through the subsequent spring term to determine how many units were completed. Student Progress year change % Points Bakersfield College 12 units in: First term 16% 20% 19% 18% 20% 4 12 units in: First year 40% 47% 46% 46% 47% 7 30 units in: First year 4% 5% 5% 4% 5% 1 Total Students 5,066 4,366 4,161 3,600 3,423 Cerro Coso Community College 12 units in: First term 15% 14% 13% 13% 13% units in: First year 28% 30% 28% 29% 28% 0 30 units in: First year 3% 1% 2% 2% 2% -1 Total Students 1, Porterville College 12 units in: First term 17% 25% 27% 24% 28% units in: First year 35% 47% 51% 48% 52% units in: First year 3% 5% 5% 5% 5% 2 Total Students 1, Looking at the second metric, students completing 12 units in their first year, BC and PC have experienced an increase in students completing this metric over the past 5 years with PC showing the largest increase. CC has remained stable over the same time period. 16
18 SECTION 2: ENROLLMENT DATA Campus The table below shows the percent of students enrolled in at least one course on the indicated campus over the past five fall terms. The vast majority of students at BC and PC are enrolled on the main campus. The majority of students at CC are enrolled online, which increased from 52% in 2009 to 65% in Campus 5-year change Bakersfield College % Points Bakersfield Main 78% 76% 77% 79% 79% 1 Online 15% 16% 14% 14% 14% -1 Delano 9% 9% 9% 10% 10% 1 Bakersfield Area 14% 14% 13% 11% 9% -5 Northwest Extension 1% 3% 4% 4% 3% 2 Weekend Classes 3% 3% 2% 1% 3% 0 Weill Institute 2% 3% 3% 2% 2% 0 Shafter-Westec 4% 4% 3% 3% 2% -2 Arvin-Lamont 0% 1% 1% 1% 1% 1 Apprenticeship 1% 1% 1% 1% 1% 0 ITV 3% 0% 0% 0% 0% -3 Stockdale High School 4% 3% 3% 0% 0% -4 Total Students 18,690 19,886 18,078 18,101 18,296 Cerro Coso Community College Online 52% 59% 63% 61% 65% 13 Cerro Coso Main 43% 37% 32% 34% 32% -11 KRV 7% 7% 7% 6% 5% -2 ESCC Mammoth 4% 3% 3% 3% 5% 1 ESCC Bishop 5% 5% 5% 6% 4% -1 South Kern 1% 1% 2% 1% 2% 1 Total Students 6,351 6,687 5,835 5,004 4,641 Porterville College Porterville Main 92% 89% 90% 90% 93% 1 Online 15% 19% 21% 22% 18% 3 Off Campus 7% 6% 4% 3% 2% -5 Total Students 4,613 4,359 4,183 3,910 3,903 17
19 Course Enrollment Activity This section includes course enrollment activity for the past 5 years. Bakersfield College: All Courses The number of sections that BC offers has decreased by about 5% from Census enrollment has also decreased, which corresponds to the 2% decline in total student headcount described on page 2. The first day waitlist numbers decreased by 44% between and Enrollment Data: All Courses Bakersfield College Sections Census Enrollmt First day Waitlist Actual FTES *Due to data inconsistencies in the academic year, changes in First Day Waitlist numbers are measured from FTES/ FTEF Spring 2014 (to date) 1,625 50,587 5,756 6, ,604 53,021 7,475 6, Summer ,831 1,049 1, Academic Year (to date) 3, ,439 14,280 13, Spring ,574 48,872 7,591 5, ,588 50,787 8,825 5, Summer ,993 1, Academic Year 3, ,652 18,080 12, Spring 2012 Sections 1,612 52,411 9,018 5, decreased ,554 51,287 12,265 5, by 3%; Summer 2011 Enrollment 279 8,125 2, Academic Year by 3%; 3, ,823 23,390 12, Spring 2011 Waitlist by 1,722 54,836 10,341 6, % * 1,670 54,718 12,903 6, Summer ,019 2,285 1, Academic Year 3, ,573 25,529 14, Spring ,727 52,385 10,471 6, ,620 51,652 11,408 6, Summer , , Academic Year 3, ,880 22,559 14,
20 Bakersfield College: Online Courses While the total number of sections has decreased by only 5%, online sections have decreased by 35% over the past 5 years. The following table displays detail about online course enrollment activity. Census enrollment in online courses has also decreased, but not as much as online sections offered. First day waitlist numbers have decreased by more than half between and Enrollment Data: Online Courses Sections Census Enrollmt First day Waitlist Actual FTES FTES/ FTEF Bakersfield College Spring 2014 (to date) 78 3, , Summer , Academic Year (to date) 180 8,480 1, Spring , , Summer Academic Year 161 7,548 1, Spring 2012 Sections 114 4,531 1, decreased 97 3,524 1, Summer 2011 by 35%; Enrollment Academic Year 235 8,989 2, by 12%; Spring 2011 Waitlist by 114 4,551 1, % * 115 4,386 1, Summer , Academic Year ,233 3,108 1, Spring ,985 1, ,705 1, Summer , Academic Year 275 9,595 2,626 1, *Due to data inconsistencies in the academic year, changes in First Day Waitlist numbers are measured from

21 Bakersfield College: Sections and Enrollments The chart below shows the percentage of all sections at BC coded as online, basic skills, or Career Technical Education (CTE). About 5% of all BC sections are online courses, which has gone down slightly from About 15% of all BC sections are basic skills courses, which has increased slightly since About a third of all BC sections are CTE. The chart below shows the percentage of all enrollments at BC in courses coded as online, basic skills, or CTE. Looking at the most recent year, it s interesting to note that while basic skills courses constitute 15% of the total sections, 25% of all enrollments are in basic skills. Conversely, while 32% of all sections are CTE, only 17% of all enrollments are in CTE courses. Note: Categories are not mutually exclusive. Courses may overlap into more than one category. 20
22 Cerro Coso Community College: All Courses In 5 years, the number of sections offered has declined by 31%. Census enrollment has also decreased and it corresponds with the decline in total student headcount reported on page 2. First day waitlist numbers decreased by 60% between and Enrollment Data: All Courses Cerro Coso Community College Sections Census Enrollmt First day Waitlist Actual FTES FTES/ FTEF Spring 2014 (to date) , , ,244 1,137 1, Summer , Academic Year (to date) 1,038 24,466 1,908 2, Spring ,360 1,033 1, ,174 1,492 1, Summer ,943 1, Academic Year 1,030 24,477 3,611 2, Spring 2012 Sections ,292 1,155 1, decreased ,705 2,716 1, by 31%; Summer ,740 1, Enrollment Academic Year 1,270 27,737 5,323 3, by 21%; Spring 2011 Waitlist by ,631 1,779 1, % * ,738 2,169 1, Summer , Academic Year 1,422 31,990 4,778 3, Spring ,047 1,474 1, , , Summer , Academic Year 1,509 30,976 1,474 3, *Because Cerro Coso did not officially implement the waitlist until spring 2010, changes in First Day Waitlist numbers are measured from
23 Cerro Coso Community College: Online Courses While the total number of sections has decreased by 31%, online sections have only decreased by 9% over the past 5 years. The following table displays detail about online course enrollment activity. Census enrollment in online courses has followed a similar trajectory as sections offered, where it has decreased by13%. First day waitlist numbers decreased by two thirds between and Enrollment Data: Online Courses Sections Census Enrollmt First day Waitlist Actual FTES FTES/ FTEF Cerro Coso Community College Spring 2014 (to date) 188 5, , Summer , Academic Year (to date) ,639 1,378 1, Spring , ,479 1, Summer ,376 1, Academic Year ,268 3,148 1, Spring 2012 Sections 185 6,067 1, decreased ,513 2, by 9%; Summer 2011 Enrollment 116 4,066 1, Academic Year by 13%; ,646 4,974 1, Spring 2011 Waitlist by 206 7,031 1, % * 232 7,284 1, Summer , Academic Year ,115 4,051 1, Spring ,025 1, , Summer , Academic Year ,840 1,095 1, *Because Cerro Coso did not officially implement the waitlist until spring 2010, changes in First Day Waitlist numbers are measured from


24 Cerro Coso Community College: Sections and Enrollments The chart below shows the percentage of all sections at CC coded as basic skills, Career Technical Education (CTE), or online. About 4% of all CC sections are basic skills courses, which has gone down from About 37% of all CC sections are CTE courses. Almost half of all CC sections are online courses, which has increased from 35% in The chart below shows the percentage of all enrollments at CC in courses coded as basic skills, CTE, or online. Looking at the most recent year, basic skills and CTE enrollments are very similar to sections offered. However, online enrollments make up 60% of CC s total enrollments while online sections offered make up 46% of CC s total sections. Note: Categories are not mutually exclusive. Courses may overlap into more than one category. 23
25 Porterville College: All Courses PC has decreased the number of sections offered by about 17% from Census enrollment has decreased by 16%, corresponding with the total student headcount decline reported on page 2. First day waitlist numbers decreased by 24% between and Enrollment Data: All Courses Sections Census Enrollmt First day Waitlist Actual FTES *Due to data inconsistencies in the academic year, changes in First Day Waitlist numbers are measured from FTES/ FTEF Porterville College Spring 2014 (to date) ,046 1,551 1, ,382 2,129 1, Summer , Academic Year (to date) ,052 4,092 3, Spring ,103 2,223 1, ,560 2,390 1, Summer , Academic Year ,225 5,190 3, Spring 2012 Sections ,472 2,415 1, decreased ,118 2,840 1, by 17%; Summer , Enrollment Academic Year by 16%; ,766 5,753 3, Spring 2011 Waitlist by ,489 2,284 1, % * ,893 2,740 1, Summer , Academic Year ,139 5,389 3, Spring ,958 1,940 1, ,537 2,135 1, Summer , Academic Year ,762 4,402 3,

26 Porterville College: Online Courses Similar to all courses, PC s online sections have decreased by 13%. The following table displays detail about online course enrollment activity. Census enrollment in online courses has decreased by 21%. First day waitlist numbers decreased by 25% between and Enrollment Data: Online Courses Sections Census Enrollmt First day Waitlist Actual FTES FTES/ FTEF Porterville College Spring 2014 (to date) , Summer Academic Year (to date) 77 2, Spring , , Summer Academic Year 89 3, Spring 2012 Sections 39 1, decreased 40 1, by 13%; Summer Enrollment Academic Year by 21%; 94 3, Spring 2011 Waitlist by 44 1, % * 45 1, Summer Academic Year 98 3, Spring , , Summer Academic Year 89 3, *Due to data inconsistencies in the academic year, changes in First Day Waitlist numbers are measured from

27 Porterville College: Sections and Enrollments The chart below shows the percentage of all sections at PC coded as online, basic skills, or Career Technical Education (CTE). About 9% of all PC sections are online courses. About 13% of all PC sections are basic skills courses, which has increased from 9% in About 24% of all sections at PC are CTE courses, which has gone down from 29% in The chart below shows the percentage of all enrollments at PC in courses coded as online, basic skills, or CTE. Looking at the most recent year, PC enrollments seem to closely reflect the sections offered. Note: Categories are not mutually exclusive. Courses may overlap into more than one category. 26
28 SECTION 3: STUDENT OUTCOMES DATA Success & Retention This section provides success and retention rates for students at all three colleges. Both rates are calculated using student enrollments that end with a grade, including DR. The DR 'grade' occurs when an enrollment is dropped between census day and the last date to drop without receiving a "W" grade. The calculations are defined as follows: Retention = A,B,C,D,F,I,P,NP / A,B,C,P,D,F,I,NP,W,DR Success = A,B,C,P / A,B,C,P,D,F,I,NP,W,DR Bakersfield College Bakersfield College Success & Retention Rates Overall, BC s retention rate has remained fairly stable over 5 years and the success rate has increased by about 2 percentage points. The success rate for online and basic skills courses has increased by about BC Success & Retention by Course Type 4 percentage points. However, even Overall 85% though success rates in online and 68% basic skills courses have increased, they are still significantly lower than the overall success rate. The chart to Online 75% the right, illustrates the gap between 53% Retention Success success and retention for the Basic Skills 82% academic year. 58% CTE 77% 89% On the following pages, success and retention rates were also disaggregated by gender, age, and ethnicity to see where achievement gaps may exist. 5-year Change % Points Overall Retention Rate (All Courses) 84.2% 84.0% 82.7% 83.2% 85.1% 0.9 Overall Success Rate (All Courses) 65.5% 65.8% 64.3% 66.1% 68.0% 2.5 Success Rates by Course Type Online Course Retention 74.7% 75.1% 73.0% 71.4% 75.0% 0.3 Online Course Success 48.7% 50.6% 47.7% 48.3% 52.6% 3.9 Basic Skills Course Retention 80.8% 79.3% 78.9% 79.8% 81.8% 1.0 Basic Skills Course Success 53.6% 50.9% 51.3% 54.8% 57.7% 4.1 CTE Course Retention 88.7% 87.6% 86.8% 86.6% 88.6% -0.1 CTE Course Success 77.0% 76.0% 75.1% 75.1% 77.4%
29 Bakersfield College (continued) Gender There seems to be little difference between males and females in regards to success and retention. Both groups have had an increase in success rates since BC Success & Retention Rates year Change Trendline Gender Female % Points Retention 83.4% 83.4% 82.1% 82.1% 84.6% 1.2 Success 65.1% 65.7% 64.1% 65.0% 67.7% 2.6 Male Retention 85.2% 84.6% 83.4% 84.7% 85.7% 0.5 Success 65.9% 65.9% 64.6% 67.4% 68.3% 2.4 Age There were no negative changes in the 5 years; all age groups either remained stable or improved. Success rates for students 19 or younger had the largest improvement. BC Success & Retention Rates year Change Trendline Age 19 or Younger % Points Retention 85.0% 85.8% 84.6% 85.5% 87.0% 2.0 Success 60.8% 63.4% 62.3% 64.6% 65.5% Retention 83.2% 82.5% 81.1% 81.7% 83.9% 0.7 Success 66.0% 65.1% 63.2% 64.5% 67.1% Retention 85.0% 83.5% 83.2% 83.7% 85.5% 0.5 Success 72.0% 70.7% 69.9% 72.2% 74.7% or Older Retention 85.0% 84.9% 83.1% 83.1% 85.0% 0.0 Success 73.9% 73.5% 71.0% 71.8% 74.4%

30 Bakersfield College (continued) The chart to the BC Success & Retention by Course Age age group for the 67% right shows success and 19 or Younger 66% retention rates by % 84% Retention academic 85% Success year. Older 75% students tend to 40 or Older 85% have higher 74% success rates. While success rates for students 19 or younger have improved over the past 5 years, their overall success is still the lowest among the different age groups. However, retention rates for students 19 or younger are the highest among the different age groups. Ethnicity In the past five years, improvements have been made in success rates for Hispanic/ Latino and White students. Retention rates for African Americans is the only metric that has declined over the time frame. BC Success & Retention Rates year Change Trendline Race/ Ethnicity % Points African American Retention 77.6% 74.5% 72.1% 73.7% 75.3% -2.3 Success 50.5% 47.3% 45.0% 49.1% 50.8% 0.3 American Indian Retention 80.3% 81.1% 80.8% 80.8% 82.1% 1.8 Success 64.0% 62.8% 59.7% 59.8% 64.1% 0.1 Asian/ Filipino/ Pac. Isl. Retention 87.5% 87.8% 86.9% 87.1% 88.6% 1.1 Success 73.3% 75.0% 74.2% 72.7% 74.8% 1.5 Hispanic/ Latino Retention 83.8% 84.0% 82.5% 83.1% 84.8% 1.0 Success 63.3% 64.0% 62.4% 64.2% 65.9% 2.6 White Retention 85.9% 85.8% 85.3% 85.7% 87.6% 1.7 Success 70.6% 71.7% 71.4% 73.3% 75.2%
31 Bakersfield College (continued) African Americans have the lowest retention and success of any group - only half of all African American students enrolled at Census Day successfully complete the course. Asian and White students tend to have the highest retention and success rates. BC Success & Retention by Course Ethnicity African American American Indian Asian/ Filipino/ Pac. Isl. Hispanic/ Latino White 75% 51% 64% 75% 66% 75% 82% 89% 85% 88% Retention Success 30
 65.3% 65.2% 64.7% 64.5% 66.8% 1.5 Success Rates by Course Type Online Course Retention 79.5% 76.7% 77.6% 78.9% 77.8% -1.")
32 Cerro Coso Community College Cerro Coso Community College Success & Retention Rates year Change % Points Overall Retention Rate (All Courses) 83.7% 82.0% 82.4% 83.2% 83.0% -0.7 Overall Success Rate (All Courses) 65.3% 65.2% 64.7% 64.5% 66.8% 1.5 Success Rates by Course Type Online Course Retention 79.5% 76.7% 77.6% 78.9% 77.8% -1.7 Online Course Success 59.3% 57.8% 58.0% 58.1% 60.1% 0.8 Basic Skills Course Retention 81.2% 78.0% 84.1% 86.5% 84.4% 3.2 Basic Skills Course Success 52.5% 50.9% 53.5% 56.6% 60.7% 8.2 CTE Course Retention 83.9% 84.3% 83.2% 85.7% 82.9% -1.0 CTE Course Success 66.1% 68.9% 67.2% 68.8% 68.1% 2.0 At Cerro Coso, success rates in basic skills have increased by 8 percentage points during the last five years. However, they still remain below the overall rate. Retention rates in online courses have declined slightly, keeping them below the overall rate. CC Success & Retention by Course Type Overall 67% 83% Retention Online 60% 78% Success Basic Skills 61% 84% CTE 68% 83% 31
33 Cerro Coso Community College (continued) Gender There seems to be little difference between males and females in regards to success and retention. Females had a slightly greater improvement in success rates since CC Success & Retention Rates year Change Trendline Gender % Points Female Retention 82.8% 80.9% 81.6% 82.0% 82.2% -0.6 Success 64.6% 64.0% 63.9% 62.9% 66.4% 1.8 Male Retention 85.1% 83.5% 83.5% 85.3% 84.3% -0.8 Success 66.4% 67.2% 65.9% 67.3% 67.5% 1.1 Age Success rates for students 19 and younger have improved over 5 years. Retention rates for students 40 and older have declined in that same time frame. CC Success & Retention Rates year Change Trendline Age % Points 19 or Younger Retention 85.7% 84.6% 85.6% 85.5% 86.8% 1.1 Success 64.6% 64.3% 63.9% 64.0% 69.1% Retention 81.7% 79.3% 80.8% 82.1% 81.3% -0.4 Success 61.5% 59.7% 61.3% 61.7% 63.1% Retention 81.4% 81.1% 81.5% 82.5% 81.7% 0.3 Success 65.3% 67.6% 66.7% 65.2% 67.5% or Older Retention 86.5% 84.8% 83.3% 84.3% 83.5% -3.0 Success 72.6% 74.2% 70.9% 71.1% 72.1%
34 Cerro Coso Community College (continued) Looking at the chart to the right for the academic year, students 19 and younger have the highest retention rate and second highest success rate among the age groups. Those in the 40 and older category have the highest success rate. CC Success & Retention by Course Age 19 or Younger 69% % % 40 or Older 72% 87% 81% 82% 84% Retention Success Ethnicity Retention rates for African American students have declined by 5 percentage points over the past 5 years. Success rates for Asian students increased by 5 percentage points in that same time frame. CC Success & Retention Rates year Change Trendline Race/ Ethnicity % Points African American Retention 76.7% 70.6% 70.0% 71.2% 72.0% -4.7 Success 47.0% 42.7% 39.7% 37.7% 46.7% -0.3 American Indian Retention 81.3% 74.9% 78.7% 79.4% 80.5% -0.8 Success 56.5% 54.5% 57.4% 54.4% 57.7% 1.2 Asian/ Filipino/ Pac. Isl. Retention 88.1% 84.4% 82.6% 87.3% 86.8% -1.3 Success 72.1% 69.3% 69.4% 72.9% 76.6% 4.5 Hispanic/ Latino Retention 83.1% 79.5% 80.9% 81.6% 81.4% -1.7 Success 60.9% 60.5% 60.6% 61.7% 62.9% 2.0 White Retention 84.4% 83.9% 84.5% 85.1% 84.8% 0.4 Success 68.2% 69.0% 69.0% 68.7% 70.6%
35 Cerro Coso Community College (continued) Looking at the most recent academic year ( ), success and retention rates for African American students are lower than any other ethnic group at CC. Asian and White students have the highest success and retention rates. CC Success & Retention by Course Ethnicity African American 72% 47% American Indian 81% 58% Asian/ Filipino/ Pac. Isl. 87% 77% Hispanic/ Latino 81% 63% White 85% 71% Retention Success 34
36 Porterville College Porterville College Success & Retention Rates year Change % Points Overall Retention Rate (All Courses) 86.1% 85.5% 85.0% 84.8% 86.8% 0.7 Overall Success Rate (All Courses) 64.5% 63.9% 65.1% 66.6% 69.0% 4.5 Success Rates by Course Type Online Course Retention 79.5% 79.1% 75.5% 74.0% 77.7% -1.8 Online Course Success 59.0% 53.7% 48.7% 51.1% 55.7% -3.3 Basic Skills Course Retention 82.4% 82.1% 82.5% 82.9% 86.7% 4.3 Basic Skills Course Success 51.4% 53.7% 57.9% 62.8% 64.4% 13.0 CTE Course Retention 89.6% 89.1% 87.8% 86.7% 88.7% -0.9 CTE Course Success 74.1% 72.9% 74.0% 72.4% 75.6% 1.5 Since , PC s overall success rate has improved by 4 percentage points. Basic skills courses had the largest improvement, with a 13 percentage point increase over the past 5 years. Online and Basic skills courses have the lowest success rates compared to other course types and online courses have the lowest retention rate as well. PC Success & Retention by Course Type Overall 69% 87% Retention Online 56% 78% Success Basic Skills 64% 87% CTE 76% 89% 35
37 Porterville College (continued) Gender Looking at the past 5 years, success rates for both males and females improved since , with females having a higher rate of success than males. PC Success & Retention Rates year Change Trendline Gender Female % Points Retention 86.4% 85.4% 85.2% 84.8% 87.2% 0.8 Success 66.1% 66.0% 67.0% 68.2% 70.9% 4.8 Male Retention 85.4% 85.5% 84.6% 84.8% 86.1% 0.7 Success 61.6% 60.4% 61.9% 64.0% 65.9% 4.3 Age Success rates for students 19 and younger and have improved over the 5 year period, while both the success and retention rates for students 40 and older have decreased. PC Success & Retention Rates year Change Trendline Age 19 or Younger % Points Retention 87.4% 87.8% 87.6% 88.3% 90.0% 2.6 Success 60.2% 62.5% 63.8% 67.1% 68.9% Retention 84.1% 83.9% 83.5% 83.4% 85.5% 1.4 Success 64.0% 62.2% 64.4% 65.6% 68.8% Retention 85.8% 84.5% 82.5% 80.5% 84.1% -1.7 Success 67.7% 68.0% 67.6% 65.3% 69.5% or Older Retention 89.6% 86.2% 85.7% 84.7% 83.8% -5.8 Success 74.2% 70.0% 69.6% 71.2% 70.1%
38 Porterville College (continued) All age groups have a similar success rate in , with students 19 and younger having the highest retention rate. PC Success & Retention by Course Age 19 or Younger 69% % % 40 or Older 70% 90% 85% Retention 84% Success 84% Ethnicity Success rates for Hispanic/ Latino students have improved over the past 5 years. Success rates for African Americans have declined and are the lowest of any group. While success and retention rates for American Indians have improved, the number of American Indian students is so small the data is less meaningful. PC Success & Retention Rates year Change Trendline Race/ Ethnicity % Points African American Retention 79.6% 79.9% 78.5% 74.6% 80.5% 0.9 Success 49.5% 41.0% 44.5% 36.2% 48.3% -1.2 American Indian Retention 82.1% 78.5% 74.4% 76.5% 88.7% 6.6 Success 54.5% 47.2% 51.9% 56.6% 62.3% 7.8 Asian/ Filipino/ Pac. Isl. Retention 89.4% 89.3% 88.6% 85.6% 89.5% 0.1 Success 73.3% 76.1% 77.3% 71.8% 75.5% 2.2 Hispanic/ Latino Retention 85.6% 85.4% 85.0% 84.9% 87.0% 1.4 Success 62.6% 63.7% 64.5% 66.6% 69.3% 6.7 White Retention 87.4% 85.3% 84.7% 84.9% 86.3% -1.1 Success 68.8% 64.8% 66.3% 67.3% 69.2%

39 Porterville College (continued) Looking at the most recent academic year ( ), success and retention rates for African American students are the lowest of the ethnic groups and success and retention rates for Asian students are the highest. PC Success & Retention by Course Ethnicity African American 48% 81% American Indian 62% 89% Asian/ Filipino/ Pac. Isl. 75% 90% Hispanic/ Latino 69% 87% White 69% 86% Retention Success 38
, which is mostly from Certificates of Achievement.")
40 Awards The table below shows the number of awards earned at each college over five years. Of the three colleges, Cerro Coso has had the largest increase in awards (65%), which is mostly from Certificates of Achievement. Awards year % change Bakersfield College AA/AS 1, % AA-T/AS-T Certificates of Achievement % Job Skills Certificates % Total Awards 1,823 1,712 1,639 1,790 1,828 0% Cerro Coso Community College AA/AS % AA-T/AS-T 3 -- Certificates of Achievement % Job Skills Certificates Total Awards % Porterville College AA/AS % AA-T/AS-T Certificates of Achievement % Job Skills Certificates 1 -- Total Awards % The chart below displays a five year trend showing the percentage of all awards for PC that are certificates and the percentage that are degrees. In recent years, there has been an increase in degrees awarded and a corresponding decrease in certificates awarded. 39


41 Awards (continued) Conversely, at both BC and CC there has been a decrease in the percentage of overall awards that are degrees and an increase in the percentage of awards that are certificates. 40
42 Transfers The following table shows the number of transfers at each college over five years. After a spike in , all three colleges have experienced a decline in transfers. A similar trend exists at the statewide level as well. Transfers year % change Bakersfield College CSU UC In-State Private Out-of-State Total Transfers 1,166 1,180 1,198 1,188 1,010-13% Cerro Coso Community College CSU UC In-State Private Out-of-State Total Transfers % Porterville College CSU UC In-State Private Out-of-State Total Transfers % Source: CSU and UC transfer numbers are from the CSU and UC system offices, while ISP and OOS numbers are from the CCCCO Datamart. Looking at the most recent transfer year, the majority of BC s transfer students attended a CSU. PC has a similar dynamic; however, a quarter of their transfer students attended an in-state private college. Almost half of CC s transfer students attended a college Transfers by Segment located out-of-state. CSU UC In-State Private Out-of-State BC 62% 6% 16% 16% CC 32% 10% 13% 45% PC 52% 6% 25% 17% 41
43 Student Success Scorecard Results This section includes the most recent Student Success Scorecard results as reported by the California Community College Chancellor's Office. This information is updated annually as part of the state's Accountability Reporting for Community Colleges (ARCC). There are five measures - Completion, Persistence, 30 Unit Attainment, Progress through Remediation, and Career Technical Education Completion. Each measure defines a cohort of students who are tracked for a specific amount of time (generally six years) to determine whether they succeed in the metric. The tables in this section have results for the last five cohorts in each measure. Bakersfield College BC results have generally declined in the five-year time period. The only positive trend was for the Remedial Math rate which increased from 20.2% in to 21.4% in Although there was a slight variation between cohort years, the trend for the Remedial English rate remained the same during the five-year period. All other rates declined in the five-year time period. When compared to statewide rates, BC results tend to be lower. There were a few exceptions where BC student results were above the statewide rate such as Persistence (both the Overall and Unprepared Students), 30 Unit Attainment (Prepared Students), and Remedial ESL. The metrics with the lowest results compared to statewide were Completion, Remedial English and Math, and Career Technical Education. When compared to the highest score in the Peer Group (which is only reported for the Overall Completion rate), BC's results were lower % compared to 50.5%. Bakersfield College Student Success Scorecard Metrics thru Trend for the Most Recent Five Cohorts thru thru thru thru Trendlines Comparisons Highest Peer Grp Rate 1 Statewide Rate Cohort Size 2,337 2,540 2,516 2,727 2,807 Overall Outcome Success Rate 43.6% 44.7% 40.8% 43.5% 39.9% 50.5% 48.1% Completion Prepared (avg 16% of cohort) 70.2% 71.2% 70.1% 71.6% 67.2% 70.2% Unprepared (avg 84% of cohort) 38.6% 38.6% 36.3% 38.5% 34.8% 40.5% Cohort Size 2,337 2,540 2,516 2,727 2,807 Overall Outcome Success Rate 75.1% 75.2% 71.2% 71.8% 71.0% 70.5% Persistence Prepared (avg 16% of cohort) 75.3% 81.4% 72.5% 71.1% 68.3% 71.9% Unprepared (avg 84% of cohort) 75.0% 73.8% 71.0% 71.9% 71.6% 70.1% Cohort Size 2,337 2,540 2,516 2,727 2, Units Overall Outcome Success Rate 65.4% 65.1% 62.9% 64.5% 62.3% 66.5% Prepared (avg 16% of cohort) 75.3% 75.4% 70.7% 71.3% 71.4% 70.1% Unprepared (avg 84% of cohort) 63.6% 62.7% 61.7% 63.2% 60.6% 65.3% Cohort Size 2,417 2,348 2,585 2,411 2,313 Remedial English Outcome Success Rate 30.5% 29.6% 29.3% 29.8% 30.5% 43.6% Cohort Size 1,830 1,711 1,653 1,958 2,422 Remedial Math Outcome Success Rate 20.2% 22.9% 23.7% 24.1% 21.4% 30.6% Cohort Size Remedial ESL Outcome Success Rate 34.4% 27.9% 31.6% 32.6% 31.1% 27.1% Career Technical Cohort Size 1,268 1,227 1,297 1,468 1,494 Education Outcome Success Rate 48.5% 50.1% 48.6% 48.0% 48.2% 53.9% 1 A Peer Group Comparison is only available for the Overall Completion metric. This peer group is comprised of 19 colleges (avg score = 41.9%). 42
44 Cerro Coso Community College Results within the five-year trend at CC are generally positive. The only measure with a downward trend was Career Technical Education - which declined by 9 percentage points during the time period. Measures with the highest increases were Completion (both Overall and Prepared Students), 30 Units Attained (both Overall and Unprepared Students), and Remedial Math. When compared to statewide rates, CC results tend to be lower. An exception was Completion where rates for both the Overall and Prepared Students were above the statewide rate. The metrics with the lowest results compared to statewide were 30 Unit Attainment, Remedial English and Math, and Career Technical Education. When compared to the highest score in the Peer Group (which is only reported for the Overall Completion rate), CC's results were lower % compared to 58.6%. Cerro Coso Community College Student Success Scorecard Metrics thru Trend for the Most Recent Five Cohorts thru thru thru thru Trendlines Highest Peer Grp Rate 1 Statewide Rate Cohort Size Overall Outcome Success Rate 45.0% 45.2% 47.1% 49.6% 49.8% 58.6% 48.1% Completion Prepared (avg 25% of cohort) 75.4% 77.3% 66.4% 72.9% 83.2% 70.2% Unprepared (avg 75% of cohort) 35.4% 36.5% 40.5% 40.9% 37.2% 40.5% Cohort Size Overall Outcome Success Rate 61.6% 59.5% 57.9% 63.3% 64.2% 70.5% Persistence Prepared (avg 25% of cohort) 65.4% 63.6% 57.9% 66.2% 68.0% 71.9% Unprepared (avg 75% of cohort) 60.4% 58.3% 57.9% 62.2% 62.8% 70.1% Cohort Size Units Overall Outcome Success Rate 50.4% 52.3% 54.6% 55.7% 58.5% 66.5% Prepared (avg 25% of cohort) 44.6% 45.5% 45.8% 42.1% 48.8% 70.1% Unprepared (avg 75% of cohort) 52.2% 54.2% 57.6% 60.8% 62.2% 65.3% Cohort Size Remedial English Outcome Success Rate 24.2% 24.5% 22.5% 24.2% 24.8% 43.6% Cohort Size Remedial Math Outcome Success Rate 23.7% 23.3% 27.3% 28.3% 27.2% 30.6% Cohort Size <10 <10 <10 Remedial ESL Outcome Success Rate 0.0% 0.0% % Career Technical Cohort Size Education Outcome Success Rate 48.5% 44.8% 44.5% 42.6% 39.5% 53.9% 1 A Peer Group Comparison is only available for the Overall Completion metric. This peer group is comprised of 15 colleges (avg score = 48.6%) Comparisons 43
45 Porterville College Results within the five-year trend at PC are generally positive. The only downward trends were for prepared students attaining 30 Units and for Remedial ESL (note the small cohort size). Measures with the highest increases were Completion (Overall ), Remedial English, and Remedial Math. When compared to statewide rates, many PC results were higher. For example, all three rates for Persistence were higher than statewide rates. All three rates for 30 Unit Attainment were also above statewide but by a closer margin. While Remedial ESL was one of the rates that declined in the five-year trend, the rate was still over the statewide rate. Results in the Career Technical Education measure were also above the statewide rate. The metrics with the lowest results compared to statewide were Remedial English and Remedial Math. When compared to the highest score in the Peer Group (which is only reported for the Overall Completion rate), PC's results were lower % compared to 50.5%. Porterville College Student Success Scorecard Metrics thru Trend for the Most Recent Five Cohorts thru thru thru thru Trendlines Highest Peer Grp Rate 1 Statewide Rate Cohort Size Overall Outcome Success Rate 39.7% 41.9% 43.7% 51.0% 45.2% 50.5% 48.1% Completion Prepared (avg 11% of cohort) 80.0% 66.7% 81.8% 75.3% 82.7% 70.2% Unprepared (avg 89% of cohort) 36.8% 39.5% 39.1% 47.2% 37.6% 40.5% Cohort Size Overall Outcome Success Rate 71.6% 72.1% 70.8% 71.4% 74.4% 70.5% Persistence Prepared (avg 11% of cohort) 80.0% 73.3% 76.4% 68.5% 82.7% 71.9% Unprepared (avg 89% of cohort) 71.0% 71.9% 70.1% 71.8% 72.7% 70.1% Cohort Size Units Overall Outcome Success Rate 64.4% 61.1% 62.3% 69.2% 66.6% 66.5% Prepared (avg 11% of cohort) 82.9% 62.2% 65.5% 63.0% 71.4% 70.1% Unprepared (avg 89% of cohort) 63.0% 61.0% 61.9% 70.1% 65.6% 65.3% Cohort Size Remedial English Outcome Success Rate 27.8% 28.6% 30.6% 34.7% 32.3% 43.6% Cohort Size Remedial Math Outcome Success Rate 11.9% 15.8% 16.6% 23.6% 24.4% 30.6% Cohort Size Remedial ESL Outcome Success Rate 36.7% 44.9% 43.7% 35.0% 31.9% 27.1% Career Technical Cohort Size Education Outcome Success Rate 57.7% 61.8% 57.9% 62.1% 58.7% 53.9% 1 A Peer Group Comparison is only available for the Overall Completion metric. This peer group is comprised of 19 colleges (avg score = 41.9%) Comparisons 44
46 SECTION 4: EMPLOYEE DATA Employee information is collected from MIS data that is reported to the state each fall. This section includes a headcount of employees by type and work location as well as employee demographic information. Employee Type The table below shows the number and percent of employees by type and work location for the past five fall terms. Districtwide, the percentage of adjunct faculty and classified employees have decreased by 12% and 14%, respectively. However, each location varies in how their employee makeup has changed over time. Similar to KCCD as a whole, BC and CC experienced an overall decrease in their total employees from Adjunct faculty and classified staff have experienced the largest declines. At BC, the number of administrators/ managers also declined, while at CC, the number of administrators/ managers increased. Porterville and the district office both experienced a small increase in the total number of employees since PC increased the number of administrators/ managers and adjunct faculty, while full-time faculty is the group that experienced the biggest decline. Employee Type year change # % # % # % # % # % Bakersfield College % change Admin/ Mgmt 31 4% 29 3% 29 4% 29 4% 27 4% -13% Full-Time Faculty % % % % % 2% Adjunct Faculty % % % % % -18% Classified Staff % % % % % -17% Total BC Employees % Cerro Coso Community College Admin/ Mgmt 13 4% 14 5% 18 6% 15 6% 17 7% 31% Full-Time Faculty 56 18% 56 19% 55 19% 57 23% 57 23% 2% Adjunct Faculty % % % % % -26% Classified Staff % 91 32% 88 30% 81 32% 79 31% -22% Total CC Employees % Porterville College Admin/ Mgmt 11 5% 11 5% 15 7% 14 6% 13 6% 18% Full-Time Faculty 69 33% 68 30% 65 29% 63 28% 59 27% -14% Adjunct Faculty 56 26% 80 35% 74 32% 79 36% 81 36% 45% Classified Staff 75 36% 69 30% 73 32% 66 30% 70 31% -7% Total PC Employees % District Office Admin/ Mgmt 29 39% 28 37% 35 39% 29 33% 27 35% -7% Full-Time Faculty Adjunct Faculty Classified Staff 45 61% 47 63% 54 61% 60 67% 50 65% 11% Total DO Employees % KCCD All Admin/ Mgmt 84 6% 82 6% 97 7% 87 7% 84 7% 0% Full-Time Faculty % % % % % -1% Adjunct Faculty % % % % % -12% Classified Staff % % % % % -14% Total KCCD Employees 1,396 1,401 1,371 1,278 1,267-9% 45
 while the largest employee groups at CC and PC are adjunct faculty (39% and 36%, respectively) and the largest employee group at the DO is")
47 Employee Type (continued) Looking at all KCCD employees for the most current term ( 2013), there is a pretty even split between classified staff and adjunct faculty. The largest employee group at BC is full-time faculty (35%) while the largest employee groups at CC and PC are adjunct faculty (39% and 36%, respectively) and the largest employee group at the DO is classified staff (65%). Employee Gender The table below shows the percent of employees by gender and work location for the past five fall terms. Overall, there is no change in the gender makeup of KCCD employees. Similar to KCCD as a whole, PC experienced no change over the past five years and BC had no significant change. CC had an increase in the percentage of female employees by three percentage points and the DO had an increase in the percentage of male employees by seven percentage points. Employee Gender year change % Points Bakersfield College Female 57% 57% 58% 56% 56% -1 Male 43% 43% 42% 44% 44% 1 Total BC Employees Cerro Coso Community College Female 61% 62% 62% 62% 64% 3 Male 39% 38% 38% 38% 36% -3 Total CC Employees Porterville College Female 58% 58% 59% 59% 58% 0 Male 42% 42% 41% 41% 42% 0 Total PC Employees District Office Female 64% 64% 63% 60% 57% -7 Male 36% 36% 37% 40% 43% 7 Total DO Employees KCCD All Female 58% 59% 59% 58% 58% 0 Male 42% 41% 41% 42% 42% 0 Total KCCD Employees 1,396 1,401 1,371 1,278 1,267 46

48 Employee Gender (continued) The graph below shows the gender split for the 2013 term by location and employee type. The red line indicates the overall gender split for 2013 (58% female and 42% male). Compared to overall, classified staff and administrators are more likely to have a higher percentage of female employees and faculty are more likely to have a higher percentage of males. However, both PC and the district office have a higher percentage of males in management compared to overall. 47
49 Employee Age The table below shows the percent of employees by age group and work location for the past five fall terms. Overall, there have not been many changes with a slight decrease in employees in the age group and a minimal increase in employees in the Less than 40 and 55+ age groups. BC had an increase of four percentage points in the 55+ age group. CC had an increase in the Less than 40 age group and a corresponding decrease in the age group. PC had a decrease of three percentage points in the 55+ age group. The DO had a decrease of eight percentage points in the 55+ age group and a corresponding increase in the age group. Employee Age year change % Points Bakersfield College Less than 40 26% 25% 25% 24% 24% % 39% 39% 37% 39% % 36% 36% 38% 37% 4 Total BC Employees Cerro Coso Community College Less than 40 20% 18% 20% 21% 25% % 46% 44% 43% 41% % 36% 36% 36% 35% -1 Total CC Employees Porterville College Less than 40 21% 20% 25% 25% 23% % 42% 37% 37% 40% % 38% 38% 38% 37% -3 Total PC Employees District Office Less than 40 20% 16% 20% 25% 21% % 55% 55% 51% 56% % 29% 25% 25% 23% -8 Total DO Employees KCCD All Less than 40 23% 23% 23% 24% 24% % 42% 41% 39% 40% % 36% 36% 37% 36% 1 Total KCCD Employees 1,396 1,401 1,371 1,278 1,267 48


50 Employee Age (continued) The graph below shows the percentage of employees in each age group for the 2013 term by location and employee type. Overall, the majority of employees are in the age group. Classified staff are more likely to be younger and faculty are more likely to be older. 49
51 Employee Race and Ethnicity The table below shows the percent of employees by race and ethnicity and work location for the past five fall terms. Overall, there have not been many changes in the racial/ ethnic composition of KCCD's employees. Employee Race and Ethnicity 5-year change Bakersfield College % Points African American 5% 5% 5% 4% 4% -1 American Indian 1% 1% 1% 1% 1% 0 Asian/ Filipino/ Pac. Islander 3% 2% 3% 4% 4% 1 Hispanic 19% 18% 20% 21% 22% 3 White 65% 67% 65% 66% 64% -1 Unknown 6% 6% 6% 5% 4% -2 Total BC Employees Cerro Coso Community College African American 2% 2% 3% 2% 2% 0 American Indian 0% 0% 0% 0% 1% 1 Asian/ Filipino/ Pac. Islander 3% 4% 4% 5% 4% 1 Hispanic 7% 6% 6% 6% 7% 0 White 80% 81% 78% 78% 75% -5 Unknown 7% 6% 8% 8% 11% 4 Total CC Employees Porterville College African American 2% 4% 3% 3% 2% 0 American Indian 1% 1% 1% 1% 1% 0 Asian/ Filipino/ Pac. Islander 2% 1% 2% 2% 2% 0 Hispanic 18% 20% 20% 22% 22% 4 White 64% 62% 61% 62% 63% -1 Unknown 13% 12% 13% 10% 10% -3 Total PC Employees District Office African American 1% 1% 2% 4% 4% 3 American Indian 4% 3% 1% 1% 1% -3 Asian/ Filipino/ Pac. Islander 7% 7% 7% 7% 6% -1 Hispanic 24% 27% 24% 21% 23% -1 White 58% 56% 61% 62% 61% 3 Unknown 5% 7% 6% 4% 4% -1 Total DO Employees KCCD All African American 4% 4% 4% 4% 3% -1 American Indian 1% 1% 1% 1% 1% 0 Asian/ Filipino/ Pac. Islander 3% 3% 3% 4% 4% 1 Hispanic 17% 17% 17% 18% 19% 2 White 68% 68% 67% 67% 66% -2 Unknown 7% 7% 8% 6% 7% 0 Total KCCD Employees 1,396 1,401 1,371 1,278 1,267 50
. Classified staff appear to be the group with the highest percentage of minority employees across all locations.")
52 Employee Race and Ethnicity (continued) The graph below shows the percentage of employees who identify as a minority in the 2013 term by location and employee type. The blue line indicates the overall percentage of minority employees for 2013 (27%). Classified staff appear to be the group with the highest percentage of minority employees across all locations. BC also has a large percentage of minority employees in the administrator/ management group. Note: Minority includes the following race/ ethnicity groups: African American, American Indian, Asian/ Filipino/ Pacific Islander, and Hispanic/ Latino. 51
Educational Attainment
 A Demographic and Socio-Economic Profile of Allen County, Indiana based on the 2010 Census and the American Community Survey Educational Attainment A Review of Census Data Related to the Educational Attainment
Enrollment Trends. Past, Present, and. Future. Presentation Topics. NCCC enrollment down from peak levels
 Presentation Topics 1. Enrollment Trends 2. Attainment Trends Past, Present, and Future Challenges & Opportunities for NC Community Colleges August 17, 217 Rebecca Tippett Director, Carolina Demography
READY OR NOT? CALIFORNIA'S EARLY ASSESSMENT PROGRAM AND THE TRANSITION TO COLLEGE
 READY OR NOT? CALIFORNIA'S EARLY ASSESSMENT PROGRAM AND THE TRANSITION TO COLLEGE Michal Kurlaender University of California, Davis Policy Analysis for California Education March 16, 2012 This research
Idaho Public Schools
 Advanced Placement: Student Participation 13.5% increase in the number of students participating between 25 and 26 In 26: 3,79 Idaho Public School Students took AP Exams In 25: 3,338 Idaho Public School
U VA THE CHANGING FACE OF UVA STUDENTS: SSESSMENT. About The Study
 About The Study U VA SSESSMENT In 6, the University of Virginia Office of Institutional Assessment and Studies undertook a study to describe how first-year students have changed over the past four decades.
Los Angeles City College Student Equity Plan. Signature Page
 Los Angeles City College Student Equity Plan Signature Page Los Angeles Community College Los Angeles City College President, Board of Trustees Date District Chancellor: College President: Academic Senate
Status of Women of Color in Science, Engineering, and Medicine
 Status of Women of Color in Science, Engineering, and Medicine The figures and tables below are based upon the latest publicly available data from AAMC, NSF, Department of Education and the US Census Bureau.
Multiple Measures Assessment Project - FAQs
 Multiple Measures Assessment Project - FAQs (This is a working document which will be expanded as additional questions arise.) Common Assessment Initiative How is MMAP research related to the Common Assessment
Shelters Elementary School
 Shelters Elementary School August 2, 24 Dear Parents and Community Members: We are pleased to present you with the (AER) which provides key information on the 23-24 educational progress for the Shelters
Basic Skills Initiative Project Proposal Date Submitted: March 14, Budget Control Number: (if project is continuing)
") Basic Skills Initiative Project Proposal 2016-2017 Date Submitted: March 14, 2016 Check One: New Proposal: Continuing Project: X Budget Control Number: (if project is continuing) Control # 87-413 - EOPS
Basic Skills Initiative Project Proposal 2016-2017 Date Submitted: March 14, 2016 Check One: New Proposal: Continuing Project: X Budget Control Number: (if project is continuing) Control # 87-413 - EOPS
Access Center Assessment Report
 Access Center Assessment Report The purpose of this report is to provide a description of the demographics as well as higher education access and success of Access Center students at CSU. College access
Iowa School District Profiles. Le Mars
 Iowa School District Profiles Overview This profile describes enrollment trends, student performance, income levels, population, and other characteristics of the public school district. The report utilizes
Segmentation Study of Tulsa Area Higher Education Needs Ages 36+ March Prepared for: Conducted by:
 Segmentation Study of Tulsa Area Higher Education Needs Ages 36+ March 2004 * * * Prepared for: Tulsa Community College Tulsa, OK * * * Conducted by: Render, vanderslice & Associates Tulsa, Oklahoma Project
State Budget Update February 2016
 State Budget Update February 2016 2016-17 BUDGET TRAILER BILL SUMMARY The Budget Trailer Bill Language is the implementing statute needed to effectuate the proposals in the annual Budget Bill. The Governor
NATIONAL CENTER FOR EDUCATION STATISTICS
 NATIONAL CENTER FOR EDUCATION STATISTICS Palm Desert, CA The Integrated Postsecondary Education Data System (IPEDS) is the nation s core postsecondary education data collection program. It is a single,
Graduate Division Annual Report Key Findings
 Graduate Division 2010 2011 Annual Report Key Findings Trends in Admissions and Enrollment 1 Size, selectivity, yield UCLA s graduate programs are increasingly attractive and selective. Between Fall 2001
https://secure.aacte.org/apps/peds/print_all_forms.php?view=report&prin...
 1 of 35 4/25/2012 9:56 AM A» 2011 PEDS» Institutional Data inst id: 3510 Institutional Data A_1 Institutional Information This information will be used in all official references to your institution. Institution
Student Mobility Rates in Massachusetts Public Schools
 Student Mobility Rates in Massachusetts Public Schools Introduction The Massachusetts Department of Elementary and Secondary Education (ESE) calculates and reports mobility rates as part of its overall
Like much of the country, Detroit suffered significant job losses during the Great Recession.
 36 37 POPULATION TRENDS Economy ECONOMY Like much of the country, suffered significant job losses during the Great Recession. Since bottoming out in the first quarter of 2010, however, the city has seen
PUBLIC INFORMATION POLICY
 CALIFORNIA STATE POLYTECHNIC UNIVERSITY, POMONA Landscape Architecture College of Environmental Design PUBLIC INFORMATION POLICY Landscape Architecture Accreditation Board (LAAB) accredited programs are
California s Bold Reimagining of Adult Education. Meeting of the Minds September 6, 2017
 California s Bold Reimagining of Adult Education Meeting of the Minds September 6, 2017 Adult Education in California Historically CDE State Run Program $750M (est) Ten Program Areas K12 Districts / County
Facts and Figures Office of Institutional Research and Planning
 Facts and Figures 2008-2009 Office of Institutional Research and Planning Office of Institutional Research Fall 2009 Facts at a Glance Credit Headcount Enrollments Headcount Ethnicity Headcount Percent
The following resolution is presented for approval to the Board of Trustees. RESOLUTION 16-
 1. Adoption of Wright State 2016 Campus Completion Plan The following resolution is presented for approval to the Board of Trustees. RESOLUTION 16- WHEREAS, Section 3345.81 of the Ohio Revised Code requires
The Art and Science of Predicting Enrollment
 The Art and Science of Predicting Enrollment Ed Mills Associate Vice President for Student Affairs Enrollment and Student Support Harres Magee Enrollment Analyst Enrollment Management is both Art and Science
Frank Phillips College. Accountability Report
 Frank Phillips College Accountability Report January 2016 Accountability System, January 2016 1 of 22 Participation - Key Measures Enrollment 1. Fall Headcount (Unduplicated) Fall 2000 Fall 2014 Fall 2015
Best Colleges Main Survey
 Best Colleges Main Survey Date submitted 5/12/216 18::56 Introduction page 1 / 146 BEST COLLEGES Data Collection U.S. News has begun collecting data for the 217 edition of Best Colleges. The U.S. News
A Guide to Finding Statistics for Students
 San Joaquin Valley Statistics http://pegasi.us/sjstats/ 1 of 2 6/12/2010 5:00 PM A Guide to Finding Statistics for Students CV Stats Home By Topic By Area About the Valley About this Site Population Agriculture
MAINE 2011 For a strong economy, the skills gap must be closed.
 For a strong economy, the skills gap must be closed. 62% 36% 26% By 2020, jobs requiring a career certificate or college degree Skills gap Too few students make it through college. MEMBER Maine adults
5 Programmatic. The second component area of the equity audit is programmatic. Equity
 5 Programmatic Equity It is one thing to take as a given that approximately 70 percent of an entering high school freshman class will not attend college, but to assign a particular child to a curriculum
What We Are Learning about Successful Programs In College Calculus
 What We Are Learning about Successful Programs In College Calculus David Bressoud St. Paul, MN Knox College Galesburg, IL May 15, 2014 A pdf file of this PowerPoint is available at www.macalester.edu/~bressoud/talks
Kahului Elementary School
 Kahului Elementary Code: 405 Status and Improvement Report Year 2014-15 Focus On Standards Grades K-5 Focus on Standards Description Contents Setting Student Profile Community Profile Improvement Summary
File Print Created 11/17/2017 6:16 PM 1 of 10
 Success - Key Measures Graduation Rate: 4-, 5-, and 6-Year 9. First-time, full-time entering, degree-seeking, students enrolled in a minimum of 12 SCH their first fall semester who have graduated from
LATTC Program Review Instructional -Department Level
 LATTC Program Review 2011-2012 Instructional -Department Level Department: Apprenticeship Participated Faculty/Staff: William Elarton-Apprenticeship Director LATTC Bob Hudachek - JATC 501 Operating Engineers
NCEO Technical Report 27
 Home About Publications Special Topics Presentations State Policies Accommodations Bibliography Teleconferences Tools Related Sites Interpreting Trends in the Performance of Special Education Students
Institution-Set Standards: CTE Job Placement Resources. February 17, 2016 Danielle Pearson, Institutional Research
 Institution-Set Standards: CTE Job Placement Resources February 17, 2016 Danielle Pearson, Institutional Research Standard 1.B.3 states: The institution establishes institution-set standards for student
A Snapshot of the Graduate School
 A Snapshot of the Graduate School Prepared for the Research Council February 6, 2009 John R. Mullin, Ph.D., FAICP Dean of the Graduate School University of Massachusetts Amherst Graduate School Purpose
2012 New England Regional Forum Boston, Massachusetts Wednesday, February 1, More Than a Test: The SAT and SAT Subject Tests
 2012 New England Regional Forum Boston, Massachusetts Wednesday, February 1, 2012 More Than a Test: The SAT and SAT Subject Tests 1 Presenters Chris Lucier Vice President for Enrollment Management, University
African American Male Achievement Update
 Report from the Department of Research, Evaluation, and Assessment Number 8 January 16, 2009 African American Male Achievement Update AUTHOR: Hope E. White, Ph.D., Program Evaluation Specialist Department
CAMPUS PROFILE MEET OUR STUDENTS UNDERGRADUATE ADMISSIONS. The average age of undergraduates is 21; 78% are 22 years or younger.
 CAMPUS PROFILE MEET OUR STUDENTS Freshmen are defined here as all domestic students entering in fall quarter from high school. These statistics include information drawn from records available at UC Davis.
BENCHMARK TREND COMPARISON REPORT:
 National Survey of Student Engagement (NSSE) BENCHMARK TREND COMPARISON REPORT: CARNEGIE PEER INSTITUTIONS, 2003-2011 PREPARED BY: ANGEL A. SANCHEZ, DIRECTOR KELLI PAYNE, ADMINISTRATIVE ANALYST/ SPECIALIST
12-month Enrollment
 12-month Enrollment 2016-17 Institution: Potomac State College of West Virginia University (237701) Overview 12-month Enrollment Overview The 12-Month Enrollment component collects unduplicated student
Data Glossary. Summa Cum Laude: the top 2% of each college's distribution of cumulative GPAs for the graduating cohort. Academic Honors (Latin Honors)
") Institutional Research and Assessment Data Glossary This document is a collection of terms and variable definitions commonly used in the universities reports. The definitions were compiled from various
Institutional Research and Assessment Data Glossary This document is a collection of terms and variable definitions commonly used in the universities reports. The definitions were compiled from various
2012 ACT RESULTS BACKGROUND
 Report from the Office of Student Assessment 31 November 29, 2012 2012 ACT RESULTS AUTHOR: Douglas G. Wren, Ed.D., Assessment Specialist Department of Educational Leadership and Assessment OTHER CONTACT
A Diverse Student Body
 A Diverse Student Body No two diversity plans are alike, even when expressing the importance of having students from diverse backgrounds. A top-tier school that attracts outstanding students uses this
Strategic Plan Dashboard Results. Office of Institutional Research and Assessment
 29-21 Strategic Plan Dashboard Results Office of Institutional Research and Assessment Binghamton University Office of Institutional Research and Assessment Definitions Fall Undergraduate and Graduate
Serving Country and Community: A Study of Service in AmeriCorps. A Profile of AmeriCorps Members at Baseline. June 2001
 Serving Country and Community: A Study of Service in AmeriCorps Cambridge, MA Lexington, MA Hadley, MA Bethesda, MD Washington, DC Chicago, IL Cairo, Egypt Johannesburg, South Africa A Profile of AmeriCorps
University of Utah. 1. Graduation-Rates Data a. All Students. b. Student-Athletes
 University of Utah FRESHMAN-COHORT GRADUATION RATES All Students Student-Athletes # 2009-10 Graduation Rate 64% 64% Four-Class Average 61% 64% Student-Athlete Graduation Success Rate 87% 1. Graduation-Rates
Port Graham El/High. Report Card for
 School: District: Kenai Peninsula Grades: K - 12 School Enrollment: 20 Title I School? No Title 1 Program: Accreditation: Report Card for 2008-2009 A Title 1 school receives federal money in support low-achieving
Race, Class, and the Selective College Experience
 Race, Class, and the Selective College Experience Thomas J. Espenshade Alexandria Walton Radford Chang Young Chung Office of Population Research Princeton University December 15, 2009 1 Overview of NSCE
Cooper Upper Elementary School
 LIVONIA PUBLIC SCHOOLS http://cooper.livoniapublicschools.org 215-216 Annual Education Report BOARD OF EDUCATION 215-16 Colleen Burton, President Dianne Laura, Vice President Tammy Bonifield, Secretary
Basic Skills Plus. Legislation and Guidelines. Hope Opportunity Jobs
 Basic Skills Plus Legislation and Guidelines Hope Opportunity Jobs Page 2 of 7 Basic Skills Plus Legislation When the North Carolina General Assembly passed the 2010 budget bill, one of their legislative
Higher Education Six-Year Plans
 Higher Education Six-Year Plans 2018-2024 House Appropriations Committee Retreat November 15, 2017 Tony Maggio, Staff Background The Higher Education Opportunity Act of 2011 included the requirement for
Adult Education ACCE Presentation. Neil Kelly February 2, 2017
 Adult Education ACCE Presentation Neil Kelly February 2, 2017 Agenda The Adult Education Universe Data and Accountability System Adult Education Funding California Dreaming Adult Education Big Picture
National Survey of Student Engagement The College Student Report
 The College Student Report This is a facsimile of the NSSE survey (available at nsse.iub.edu/links/surveys). The survey itself is administered online. 1. During the current school year, about how often
Teacher Supply and Demand in the State of Wyoming
 Teacher Supply and Demand in the State of Wyoming Supply Demand Prepared by Robert Reichardt 2002 McREL To order copies of Teacher Supply and Demand in the State of Wyoming, contact McREL: Mid-continent
SFY 2017 American Indian Opportunities and Industrialization Center (AIOIC) Equity Direct Appropriation
 Equity Direct Appropriation") SFY 2017 American Indian Opportunities and Industrialization Center (AIOIC) Equity Direct Appropriation Report to the Legislature as required by 2016 Minnesota Session Laws, Chapter 189, H.F. 2749, Article
SFY 2017 American Indian Opportunities and Industrialization Center (AIOIC) Equity Direct Appropriation Report to the Legislature as required by 2016 Minnesota Session Laws, Chapter 189, H.F. 2749, Article
The Demographic Wave: Rethinking Hispanic AP Trends
 The Demographic Wave: Rethinking Hispanic AP Trends Kelcey Edwards & Ellen Sawtell AP Annual Conference, Las Vegas, NV July 19, 2013 Exploring the Data Hispanic/Latino US public school graduates The Demographic
AB104 Adult Education Block Grant. Performance Year:
 AB104 Adult Education Block Grant Performance Year: 2015-2016 Funding source: AB104, Section 39, Article 9 Version 1 Release: October 9, 2015 Reporting & Submission Process Required Funding Recipient Content
Western Australia s General Practice Workforce Analysis Update
 Western Australia s General Practice Workforce Analysis Update NOVEMBER 2015 PUBLISHED MAY 2016 Rural Health West This work is copyright. Apart from any use as permitted under the Copyright Act 1968, no
A Guide to Adequate Yearly Progress Analyses in Nevada 2007 Nevada Department of Education
 A Guide to Adequate Yearly Progress Analyses in Nevada 2007 Nevada Department of Education Note: Additional information regarding AYP Results from 2003 through 2007 including a listing of each individual
Validation Requirements and Error Codes for Submitting Common Completion Metrics
 Validation Requirements and s for Submitting Common Completion s March 2015 Overview To ensure accurate reporting and quality data, Complete College America is committed to helping data submitters ensure
Evaluation of a College Freshman Diversity Research Program
 Evaluation of a College Freshman Diversity Research Program Sarah Garner University of Washington, Seattle, Washington 98195 Michael J. Tremmel University of Washington, Seattle, Washington 98195 Sarah
Raw Data Files Instructions
 Raw Data Files Instructions Colleges will report the above information for students in the Main Cohort for each of the reporting timeframes and the system will calculate the sub cohorts and metrics based
An Empirical Analysis of the Effects of Mexican American Studies Participation on Student Achievement within Tucson Unified School District
 An Empirical Analysis of the Effects of Mexican American Studies Participation on Student Achievement within Tucson Unified School District Report Submitted June 20, 2012, to Willis D. Hawley, Ph.D., Special
Lesson M4. page 1 of 2
 Lesson M4 page 1 of 2 Miniature Gulf Coast Project Math TEKS Objectives 111.22 6b.1 (A) apply mathematics to problems arising in everyday life, society, and the workplace; 6b.1 (C) select tools, including
Albany Technical College Overview Goals Student Success and Implementation Team Conclusion Next Steps...
 ?33333 Dr. Josephine Reed-Taylor Chief Academic Officer Technical College System of Georgia 1800 Century Place, NE Atlanta, Georgia 30345-4304 December 2015 Contents Albany Technical College... 8 Overview...
Transportation Equity Analysis
 2015-16 Transportation Equity Analysis Each year the Seattle Public Schools updates the Transportation Service Standards and bus walk zone boundaries for use in the upcoming school year. For the 2014-15
Samuel Enoka Kalama Intermediate School
 Code: 420 Samuel Enoka Kalama Intermediate Status and Improvement Report Year 2014-15 Focus On Standards Grades 6-8 Contents This Status and Improvement Report has been prepared as part of the Department's
Updated: December Educational Attainment
 Updated: Educational Attainment Among 25- to 29-year olds, the proportions who have attained a high school education, some college, or a bachelor s degree are all rising, according to longterm trends.
STEM Academy Workshops Evaluation
 OFFICE OF INSTITUTIONAL RESEARCH RESEARCH BRIEF #882 August 2015 STEM Academy Workshops Evaluation By Daniel Berumen, MPA Introduction The current report summarizes the results of the research activities
ADMISSION TO THE UNIVERSITY
 ADMISSION TO THE UNIVERSITY William Carter, Director of Admission College Hall 140. MSC 128. Extension 2315. Texas A&M University-Kingsville adheres to high standards of academic excellence and admits
Executive Council Comprehensive Program Review
 Executive Council Comprehensive Program Review 2014-2015 Area 1 - Division or Program Overview 1.1 Briefly describe how the division or area contributes to the district mission. The College mission is
New Jersey Institute of Technology Newark College of Engineering
 New Jersey Institute of Technology Newark College of Engineering AND IN ELECTRICAL AND COMPUTER ENGINEERING Program Review Last Update: Nov. 23, 2005 MISSION STATEMENTS DOCTOR OF PHILOSOPHY IN ELECTRICAL
Miami-Dade County Public Schools
 ENGLISH LANGUAGE LEARNERS AND THEIR ACADEMIC PROGRESS: 2010-2011 Author: Aleksandr Shneyderman, Ed.D. January 2012 Research Services Office of Assessment, Research, and Data Analysis 1450 NE Second Avenue,
ESSEX COUNTY COLLEGE. INSTITUTIONAL PROFILE (Excellence and Accountability)
") ESSEX COUNTY COLLEGE INSTITUTIONAL PROFILE (Excellence and Accountability) Submitted to Commission on Higher Education September 28, 2009 Office of Planning, Research & Assessment Dr. J. Scott Drakulich
ESSEX COUNTY COLLEGE INSTITUTIONAL PROFILE (Excellence and Accountability) Submitted to Commission on Higher Education September 28, 2009 Office of Planning, Research & Assessment Dr. J. Scott Drakulich
Principal vacancies and appointments
 Principal vacancies and appointments 2009 10 Sally Robertson New Zealand Council for Educational Research NEW ZEALAND COUNCIL FOR EDUCATIONAL RESEARCH TE RŪNANGA O AOTEAROA MŌ TE RANGAHAU I TE MĀTAURANGA
What Is The National Survey Of Student Engagement (NSSE)?
?") National Survey of Student Engagement (NSSE) 2000 Results for Montclair State University What Is The National Survey Of Student Engagement (NSSE)? US News and World Reports Best College Survey is due next
National Survey of Student Engagement (NSSE) 2000 Results for Montclair State University What Is The National Survey Of Student Engagement (NSSE)? US News and World Reports Best College Survey is due next
John F. Kennedy Middle School
 John F. Kennedy Middle School CUPERTINO UNION SCHOOL DISTRICT Steven Hamm, Principal hamm_steven@cusdk8.org School Address: 821 Bubb Rd. Cupertino, CA 95014-4938 (408) 253-1525 CDS Code: 43-69419-6046890
Mission, Vision and Values Providing a Context
 Mission, Vision and Values Providing a Context Kathy McLain, Dean College Planning and Research Role of the Mission Statement Spring Break Experience Helped organize and lead a 4 day bike trip for 25 high
Foothill College: Academic Program Awards and Related Student Headcount, to
 Foothill College: Academic Program Awards and Related Student, 2013-14 to 2015-16 Introduction The following document summarizes data in the 2015-16 MIS SP report 1 for Foothill College, which was submitted
Data Diskette & CD ROM
 Data File Format Data Diskette & CD ROM Texas Assessment of Academic Skills Fall 2002 through Summer 2003 Exit Level Test Administrations Attention Macintosh Users To accommodate Macintosh systems a delimiter
APPLICANT INFORMATION. Area Code: Phone: Area Code: Phone:
 MARQUETTE UNIVERSITY HEALTH CAREERS OPPORTUNITY PROGRAM College Science Enrichment Program (CSEP) & Pre-Enrollment Support Program (PESP) Website: http://www.mu.edu/hcop INSTRUCTIONS: Please type or print
OFFICE OF ENROLLMENT MANAGEMENT. Annual Report
 2014-2015 OFFICE OF ENROLLMENT MANAGEMENT Annual Report Table of Contents 2014 2015 MESSAGE FROM THE VICE PROVOST A YEAR OF RECORDS 3 Undergraduate Enrollment 6 First-Year Students MOVING FORWARD THROUGH
Student Support Services Evaluation Readiness Report. By Mandalyn R. Swanson, Ph.D., Program Evaluation Specialist. and Evaluation
 Student Support Services Evaluation Readiness Report By Mandalyn R. Swanson, Ph.D., Program Evaluation Specialist and Bethany L. McCaffrey, Ph.D., Interim Director of Research and Evaluation Evaluation
Coming in. Coming in. Coming in
 212-213 Report Card for Glenville High School SCHOOL DISTRICT District results under review by the Ohio Department of Education based upon 211 findings by the Auditor of State. Achievement This grade combines
SASKATCHEWAN MINISTRY OF ADVANCED EDUCATION
 SASKATCHEWAN MINISTRY OF ADVANCED EDUCATION Report March 2017 Report compiled by Insightrix Research Inc. 1 3223 Millar Ave. Saskatoon, Saskatchewan T: 1-866-888-5640 F: 1-306-384-5655 Table of Contents
EDUCATIONAL ATTAINMENT
 EDUCATIONAL ATTAINMENT By 2030, at least 60 percent of Texans ages 25 to 34 will have a postsecondary credential or degree. Target: Increase the percent of Texans ages 25 to 34 with a postsecondary credential.
Suggested Citation: Institute for Research on Higher Education. (2016). College Affordability Diagnosis: Maine. Philadelphia, PA: Institute for
. College Affordability Diagnosis: Maine. Philadelphia, PA: Institute for") MAINE Suggested Citation: Institute for Research on Higher Education. (2016). College Affordability Diagnosis: Maine. Philadelphia, PA: Institute for Research on Higher Education, Graduate School of Education,
MAINE Suggested Citation: Institute for Research on Higher Education. (2016). College Affordability Diagnosis: Maine. Philadelphia, PA: Institute for Research on Higher Education, Graduate School of Education,
08-09 DATA REVIEW AND ACTION PLANS Candidate Reports
 08-09 DATA REVIEW AND ACTION PLANS Candidate Reports Data Observations Implications for Change Action for Change Admitted to TEP Only ~24% of students Recruit more secondary majors Develop recruitment
Update Peer and Aspirant Institutions
 Update Peer and Aspirant Institutions Prepared for Southern University at Shreveport January 2015 In the following report, Hanover Research describes the methodology used to identify Southern University
Physics/Astronomy/Physical Science. Program Review
 Physics/Astronomy/Physical Science Program Review June 2017 Modesto Junior College Instructional Program Review June 2017 Contents Executive Summary... 2 Program Overview... 3 Program Overview... 3 Response
A Comparison of State of Florida Charter Technical Career Centers to District Non-Charter Career Centers,
 A Comparison of State of Florida Charter Technical Career to District Non-Charter Career, 2013-14 At a Glance In school year 2013-14, there were 4,502 students enrolled in the state of Florida s charter
Kansas Adequate Yearly Progress (AYP) Revised Guidance
 Revised Guidance") Kansas State Department of Education Kansas Adequate Yearly Progress (AYP) Revised Guidance Based on Elementary & Secondary Education Act, No Child Left Behind (P.L. 107-110) Revised May 2010 Revised May
Kansas State Department of Education Kansas Adequate Yearly Progress (AYP) Revised Guidance Based on Elementary & Secondary Education Act, No Child Left Behind (P.L. 107-110) Revised May 2010 Revised May
Rachel Edmondson Adult Learner Analyst Jaci Leonard, UIC Analyst
 Rachel Edmondson Adult Learner Analyst Jaci Leonard, UIC Analyst UIC Process Changes for 2016 STARR Reporting Year, submission window Data Element, Business Rule Data Quality MI School Data Postsecondary
Profile of BC College Transfer Students admitted to the University of Victoria
 Profile of BC College Transfer Students admitted to the University of Victoria 23/4 to 27/8 Prepared by: Jim Martell & Alan Wilson Office of Institutional Planning and Analysis, University of Victoria
Descriptive Summary of Beginning Postsecondary Students Two Years After Entry
 NATIONAL CENTER FOR EDUCATION STATISTICS Statistical Analysis Report June 994 Descriptive Summary of 989 90 Beginning Postsecondary Students Two Years After Entry Contractor Report Robert Fitzgerald Lutz
Australia s tertiary education sector
 Australia s tertiary education sector TOM KARMEL NHI NGUYEN NATIONAL CENTRE FOR VOCATIONAL EDUCATION RESEARCH Paper presented to the Centre for the Economics of Education and Training 7 th National Conference
ADULT BASIC EDUCATION CURRICULUM GUIDE TABLE OF CONTENTS
 ADULT BASIC EDUCATION CURRICULUM GUIDE TABLE OF CONTENTS 2006 revisions noted as revised SECTION 1: GOALS AND PHILOSOPHY Pages 2 14 SECTION 2: ENROLLMENT All revised Pages 15 55 15 19 BASED Course Descriptions
Strategic Planning Guide
 Chandler-Gilbert Estrella Mountain GateWay Glendale Mesa Paradise Valley Phoenix Rio Salado Scottsdale South Mountain Maricopa Skill Center SouthWest Skill Center Strategic Planning Guide 1 Table of Contents
Executive Summary. Hialeah Gardens High School
 Miami-Dade County Public Schools Dr. Louis Algaze, Principal 11700 Hialeah Gardens Blvd Hialeah Gardens, FL 33018 Document Generated On March 19, 2014 TABLE OF CONTENTS Introduction 1 Description of the