The Measure of Opportunity. A special Understanding Boston Series on Inequality, Prosperity, Well- Being & Boston s Future Mobility
|
|
|
- Gilbert Charles
- 5 years ago
- Views:
Transcription

1 The Measure of Opportunity A special Understanding Boston Series on Inequality, Prosperity, Well- Being & Boston s Future Mobility


2
3
4
5

6
7

8 Median Household Income by Quintile 2000 $420,000 $320,000 $220,000 $120,000 $20,000 -$80,000 Lowest Quintile Second Quintile Third Quintile Fourth Quintile Highest Quintile Top 5 Percent Source: 2000 Decennial Census; 2014 American Community Survey
9 Median Household Income by Quintile 2000 v 2013 $420, % $320,000 $220,000 $120,000 $20, % -$80,000 Lowest Quintile Second Quintile Third Quintile Fourth Quintile Highest Quintile Top 5 Percent Source: 2000 Decennial Census; 2014 American Community Su
10 Change in Households by Income Less than $10,000 $10,000 to $24,999 $25,000 to $49,999 $50,000 to $74,999 $75,000 to $99,999 $100,000 to $149,999 $150,000 or more Source: American Community Survey

11 AGGREGATE HOUSEHOLD INCOME $47b $725m Source: American Community Survey, year estimates

12 CAN A CITY EXTEND THE BENEFITS OF ECONOMIC SUCCESS TO ALL OF ITS RESIDENTS & NEIGHBORHOODS?
13 CAN IT RETAIN A VIBRANT MIX OF INCOME, ETHNIC & AGE DIVERSITY EVEN AS IT ATTRACTS HIGHER INCOME RESIDENTS?

14 CAN IT CREATE PATHWAYS TO EDUCATIONAL & ECONOMIC SUCCESS FOR ALL ITS YOUNG PEOPLE?
15 WHAT WILL IT TAKE TO MAKE BOSTON AMERICA S MOST UPWARDLY MOBILE CITY?
16
17 OPPORTUNITY
18 PROSPERITY
19 WELL- BEING
20 SOCIAL & ECONOMIC MOBILITY

21 SOCIAL & ECONOMIC MOBILITY WHAT WE KNOW
22 100% 100% OPPORTUNITY AT BIRTH 67% 71% 68% 64% IMPACTS 59% 45% 49% 44% 43% 31% SUCCESS AT ADULTHOOD Birth Age 5 Age 11 Age 19 Age 29 Age 40 Advantaged at Birth Disadvantaged at Birth
23 100% 100% 67% 45% 71% 49% 59% 31% 68% 64% 44% 43% Birth Age 5 Age 11 Age 19 Age 29 Age 40 Advantaged at Birth Disadvantaged at Birth
24 100% 100% 67% 45% 71% 49% 59% 31% 68% 64% 44% 43% Birth Age 5 Age 11 Age 19 Age 29 Age 40 Advantaged at Birth Disadvantaged at Birth
25 100% 100% 67% 45% 71% 49% 59% 31% 68% 64% 44% 43% Birth Age 5 Age 11 Age 19 Age 29 Age 40 Advantaged at Birth Disadvantaged at Birth
26 100% 100% 67% 45% 71% 49% 59% 31% 68% 64% 44% 43% Birth Age 5 Age 11 Age 19 Age 29 Age 40 Advantaged at Birth Disadvantaged at Birth


27 100% 100% 67% 45% 71% 49% 59% 31% 68% 64% 44% 43% Birth Age 5 Age 11 Age 19 Age 29 Age 40 Advantaged at Birth Disadvantaged at Birth

28 GREATER MOBILITY LESS MOBILITY

29 Racial Segregation Commute Times Isolated Poverty Proximity to High Quality Schools Teen Labor Force Participation Social Capital Density of Single Parent Households

30

31 Middlesex County: +0.39% every year Suffolk County: -0.31% every year

32 2015 A BABY IS BORN IN BOSTON
33 2027 ENTERS 7 TH GRADE 2020 TURNS FIVE YEARS OLD
34 2039 STARTS A CAREER PATH 2038 COMPLETES COLLEGE 2033 GRADUATES HIGH SCHOOL

35 2055 ACHIEVES THE AMERICAN DREAM 2048 HAS A CHILD

36


37 EARLY OPPORTUNITY EDUCATION & SKILLS INEQUALITY & PLACES OF OPPORTUNITY INCOME, WEALTH, ASSETS JOBS & EMPLOYMENT
38


39

40 KEY INDICATOR: Healthy Birth Weight Percent of Babies Born at Low Birth Weight Boston % %

41 Early Education Opportunity : KEY INDICATOR Percent of 3 and 4 year-olds enrolled in school Boston % 90% 80% 70% 60% 50% 40% 30% Private Public 20% 10% 0% Between 0 and 49 Between 50 and 99 Between 100 and 199 Between 200 and 299 Between 300 and 399 Between 400 and Plus


42


43
44

45 WHAT MATTERS IN THE EDUCATION TO EMPLOYMENT PIPELINE?
46 Unemployment and Median Earnings by Educational Attainment $1,623 $1,714 PhD Professional 2.2% 2.3% $1,329 $1,108 Masters Bachelors 3.4% 4.0% $777 Associates 5.4% $727 Some College 7.0% $651 High School 7.5% $472 No High School 11.0% Median Weekly Earnings $827 All Workers 6.1% Unemployment Rate Source: US Bureau of Labor Statistics, Current Population Survey
47 Adult Income Quintile of Children Born at the Bottom Income Quintile by College Degree 5% 9% Top 20% 19% 18% Fourth 20% 22% 23% Middle 20% 21% 45% Second 20% Bottom 20% 22% 16% No Degree With Degree Source: Brookings Institute Analysis of PSID
48 Adult Income Quintile of Children Born at the Bottom Income Quintile by College Degree Top 20% Fourth 20% Middle 20% Second 20% 45% Bottom 20% 16% No Degree With Degree Source: Brookings Institute Analysis of PSID
49 Adult Income Quintile of Children Born at the Bottom Income Quintile by College Degree 5% Top 20% 19% Fourth 20% Middle 20% Second 20% Bottom 20% No Degree With Degree Source: Brookings Institute Analysis of PSID
50 Change in Real Earnings by Educational Attainment % Men Women 16% 13% 7% 3% -12% -13% -20% Source: Brookings Institute, Hamilton Project, Occupational Employment Statistics

51 Spending on Educational Enrichment by Parent s Income $8,872 $3,536 $835 $1, Source: Our Kids: The American Dream in Crisis [Robert D. Putnam)

52 Chances of Graduating College by 8 th Grade Math NAEP Scores 74% 51% 30% 29% 3% 8% Lowest Scores Middle Scores Highest Scores Source: Our Kids: The American Dream in Crisis [Robert D. Putnam)
53 Percent of Children with a College Degree by Parents Income Quintile % 38% Total: 29% 20% 25% 11% Bottom Second Middle Fourth Top Source: Brookings Institute Analysis of PSID

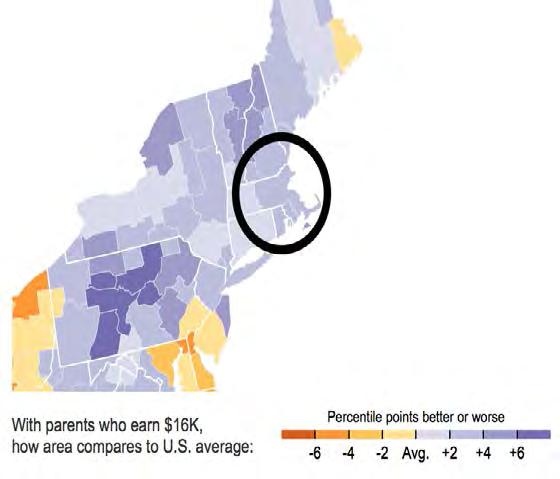
54 College Attendance Rates for Children of Parents in the Bottom 25% Source: Raj Chetty, Equality of Opportunity Project
55 Income Inequality / Economic Prosperity Washington DC San Francisco New York Boston Los Angeles Dallas Philadelphia Detroit Chicago Seattle Miami Income Ratio of 90 th to 10 th percentile Source: 2014 Occupational Employment Statistics, Metropolitan Statistical Areas
56 Income Inequality / Economic Prosperity Washington DC San Francisco 55.1% 53.0% 6.1 New York 44.7% 5.7 Boston 52.6% Los Angeles Dallas Philadelphia Detroit Chicago Seattle Miami 39.2% 39.3% 42.1% 38.2% 43.2% 48.9% 38.5% Income Ratio of 90 th to 10 th percentile % Associate s or Higher Source: 2014 Occupational Employment Statistics, Metropolitan Statistical Areas
57 Income Inequality / Economic Prosperity Washington DC San Francisco New York Boston Los Angeles Dallas Philadelphia Detroit Chicago Seattle Miami 0.48 Income Ratio of 90 th to 10 th percentile Employment to Population Ratio Source: 2014 Occupational Employment Statistics, Metropolitan Statistical Areas
58 Income Inequality / Economic Prosperity Washington DC San Francisco New York Boston Los Angeles Dallas Philadelphia Detroit Chicago Seattle Miami Income Ratio of 90 th to 10 th percentile Employment to Population Ratio 16 to 24 year olds Source: 2014 Occupational Employment Statistics, Metropolitan Statistical Areas
59 EDUCATION & EMPLOYMENT
60 EDUCATION & SKILLS


61 EDUCATION & SKILLS Key Indicator SHARE OF ADULTS WITH AN ASSOCIATE S DEGREE OR HIGHER 35% 40.4% 48.9% 51.3% Source: 1990, 2000 Decennial Census; 2010, 2014 American Community Survet


62 EDUCATION & SKILLS


63 Change in MCAS Proficiency Rates % 64% 36% 37% 30% 20% 31% 28% 3rd grade reading 8th grade math 10th grade ELA 10th grade math Source: Massachusetts Department of Elementary & Secondary Education

64 Change in MCAS Proficiency Rates % 64% 36% 37% 30% 20% 31% 28% 3rd grade reading 8th grade math 10th grade ELA 10th grade math Source: Massachusetts Department of Elementary & Secondary Education
65 Change in MCAS Proficiency Rates % 64% 36% 37% 30% 20% 31% 28% 3rd grade reading 8th grade math 10th grade ELA 10th grade math Source: Massachusetts Department of Elementary & Secondary Education

66 BPS Four Year Graduation Rate by Race/Ethnicity 2006 & 2013 Asian Class of Class of White African American Latino Source: Massachusetts Department of Elementary & Secondary Education
67 BPS Annual Dropout Rate by Neighborhood 2008 Allston Back Bay / Kenmore Boston Central Brighton Charlestown Codman Square East Boston Fields Corner Grove Hall Hyde Park Jamaica Plain Mattapan Roslindale Roxbury Roxbury Crossing South Boston South End Uphams Corner West Roxbury 1.8% 3.0% 5.7% 4.5% 4.5% 8.0% 7.8% 6.5% 9.0% 7.9% 6.5% 7.4% 7.6% 5.8% 8.9% 7.1% 6.2% 8.4% 8.8% Source: Boston Public Schools
68 BPS Annual Dropout Rate by Neighborhood 2014 Allston Back Bay / Kenmore Boston Central Brighton Charlestown Codman Square East Boston Fields Corner Grove Hall Hyde Park Jamaica Plain Mattapan Roslindale Roxbury Roxbury Crossing South Boston South End Uphams Corner West Roxbury 0.9% 3.2% 2.7% 2.4% 3.0% 3.5% 4.1% 3.5% 4.7% 4.2% 2.4% 3.8% 4.5% 3.1% 5.5% 4.8% 6.7% 3.5% 3.7% Source: Boston Public Schools

69 BPS Graduates College Enrollment Rates % 77% 60% 58% Class of % 44% 68% 65% Class of 2004 African American Latino White Asian Source: Massachusetts Department of Elementary & Secondary Education


70 Boston Public School Graduates College Completion Classes of % 37% 39% 41% 45% Class of 2000 Class of 2007 Source: Success Boston

71
72 JOBS & EMPLOYMENT

73 JOBS & EMPLOYMENT Key Indicator UNEMPLOYMENT RATE Source: US Bureau of Labor Statistics, Local Area Unemployment Statistics


74 JOBS & EMPLOYENT

75 Labor Market by Occupation 34% 28% 22% 16% 13% 10% 17% 18% 21% Blue-Collar Service 17% 18% White-Collar 13% 44% 55% 60% 67% 69% 69% Source: Decennial Census; 2010, 2014 American Community Survey

76 Total Employment , , , , , , , , , Source: US Bureau of Labor Statistics, Local Area Unemployment Statistics

77 Change in Employment by Industry 2001 Q Total Employment: +3% Education and Health Services Leisure and Hospitality Other Services Professional and Business Services 35% 29% 11% 3% Trade, Transportation and Utilities Financial Activities Public Administration -13% -14% -17% Information Construction -29% -31% Manufacturing -58% Source: Massachusetts Executive Office of Labor & Workforce Development ES202


78 Change in Employment by Occupation Personal care and service Community and social services Business and financial operations Computer and mathematical Healthcare support Management Healthcare practitioners and technical Life, physical, and social science Food preparation and serving related Protective service Education, training, and library Arts, design, entertainment, sports, and media Sales and related Legal Building and grounds cleaning and maintenance Architecture and engineering Transportation and material moving Installation, maintenance, and repair Production Construction and extraction Office and administrative support -0.8% -4.5% -8.7% -9.0% -9.4% 30.8% 26.4% 23.6% 21.9% 20.9% 20.5% 20.3% 16.6% 10.5% 8.2% 4.7% 2.6% 1.7% 1.2% 0.8% 50.4% Source: US Bureau of Labor Statistics, Occupational Employment Statistics Boston MSA
79 Work Experience by Weekly Hours Worked 29.8% 2.9% 12.4% 22.1% 4.9% 16.3% Did not Work 1 to 14 Hours 15 to 34 Hours 35 Hours or more 54.9% 56.7% Source: 2000 Decennial Census; 2014 American Community Survey
80 Work Experience by Weekly Hours Worked 29.8% 22.1% Did not Work 1 to 14 Hours 15 to 34 Hours 35 Hours or more Source: 2000 Decennial Census; 2014 American Community Survey
81 Change in Employment by Average Weekly Wages 2008 & 2014 Less than $718 12,706 $718 to $1,436 2,084 $1,436 to $2,154 8,849 $2,154 to $2,872-2,866 $2,872 or more -5,781 Source: Massachusetts Executive Office of Labor & Workforce Development ES202
82 Median Annual Earnings, Fast-Growing Occupations 2014 $92,330 $73,820 $43,610 $26,180 Personal Care and Service Community and Social Service Business and Financial Operations Computer and Mathematical Source: US Bureau of Labor Statistics, Occupational Employment Statistics Boston MSA
83 Median Annual Earnings at 10 th & 90 th Percentile 2014 $133,070 $147,600 $77,610 $48,490 $42,760 $52,380 $18,380 $25,390 Personal Care and Service Community and Social Service Business and Financial Operations Computer and Mathematical Source: US Bureau of Labor Statistics, Occupational Employment Statistics Boston MSA
84 INEQUALITY - OPPORTUNITY

85 INEQUALITY - OPPORTUNITY Adults with and Associate s Degree or Higher by Race/Ethnicity 2000 & % 49.0% 53.1% 40.7% % 23.6% 19.4% 22.4% 27.9% 29.9% 25.9% % Some Other Latino/ Hispanic African American Two or More Asian White Non-Latino Source: 2000 Decennial Census; 2014 American Community Survey
86 INEQUALITY - OPPORTUNITY Median Earnings for Full Time Workers 2000 & 2014 All 2000: $48,765 $56,406 $40,209 $40,154 $33,181 $37,630 $33,962 African American Asian Some Other Two or More Latino/ Hispanic White Non-Latino Source: 2000 Decennial Census; 2014 American Community Survey

87 INEQUALITY - OPPORTUNITY Median Earnings for Full Time Workers 2000 & 2014 $66,490 All 2014: $55,864 $51,876 $56,406 $41,700 $40,209 $40,154 $36,268 $33,181 $38,222 $37,630 $36,722 $33,962 African American Asian Some Other Two or More Latino/ Hispanic White Non-Latino Source: 2000 Decennial Census; 2014 American Community Survey
 Some college or associate's degree Bachelor's degree Graduate or professional degree Source: 2014 American Community")
88 INEQUALITY - OPPORTUNITY Median Earnings for Full Time Workers gender gap 2014 $74,934 $61,191 $51,878 $60,579 $31,675 $36,099 $34,881 $22,271 $22,777 $17,629 Less than high school graduate High school graduate (includes equivalency) Some college or associate's degree Bachelor's degree Graduate or professional degree Source: 2014 American Community Survey
89 INEQUALITY - OPPORTUNITY Unemployment by Educational Attainment 2000 & % 12.2% 9.8% 3.2% Less than High School High School Associate s Degree Bachelor s Degree Or Higher
90 INEQUALITY - OPPORTUNITY Unemployment by Educational Attainment 2000 & % 17.8% 16.8% 16.2% 12.2% 9.8% 4.1% 3.2% Less than High School High School Associate s Degree Bachelor s Degree Or Higher
91 INEQUALITY - OPPORTUNITY Poverty & Economic Security by Educational Attainment % 200% or Higher 62.0% 81.5% Near Poor 25.6% In Poverty 17.7% 28.8% 20.3% 8.7% 9.8% Less than HS HS or Some College AA or Higher Source: 2000 Decennial Census; 2014 American Community Survey Public Use Micro Data
92 INEQUALITY - OPPORTUNITY Poverty & Economic Security by Educational Attainment 2000 & % or Higher 45.7% 39.6% 62.0% 54.9% 81.5% 81.8% Near Poor 25.6% 28.2% 18.5% In Poverty 17.7% 28.8% 32.2% 20.3% 26.6% 8.7% 9.8% 8.0% 10.2% Less than HS HS or Some College AA or Higher Source: 2000 Decennial Census; 2014 American Community Survey Public Use Micro Data

93 INEQUALITY - OPPORTUNITY Poverty & Economic Security by Educational Attainment 2000 & % or Higher 45.7% 39.6% 62.0% 54.9% 81.5% 81.8% Near Poor 25.6% 28.2% 18.5% In Poverty 17.7% 28.8% 32.2% 20.3% 26.6% 8.7% 9.8% 8.0% 10.2% Less than HS HS or Some College AA or Higher Source: 2000 Decennial Census; 2014 American Community Survey Public Use Micro Data
94 INEQUALITY - OPPORTUNITY EDUCATIONAL ATTAINMENT Less than 20% Source: American Community Survey, year estimates Greater than 80%


95 INEQUALITY - OPPORTUNITY UNEMPLOYMENT RATE Less than 5% Source: American Community Survey, year estimates Greater than 25%
96 INEQUALITY - OPPORTUNITY MEDIAN HOUSEHOLD INCOME Less than $25,000 Source: American Community Survey, year estimates Greater than $100,000
97 INEQUALITY - OPPORTUNITY CHILD POVERTY Less than 5% Source: American Community Survey, year estimates Greater than 40%
98 INEQUALITY - OPPORTUNITY Young Adult Labor Force Participation Rate to 24 year olds to 19 year olds Source: American Community Survey

99 INEQUALITY - OPPORTUNITY Young Adult Unemployment Rate to 19 year olds to 24 year olds Source: American Community Survey

100
101
102 DATA GAPS: adult education, workforce, longitudinal data, missing topics
103 DATA GAPS: adult education, workforce, longitudinal data, missing topics BARRIERS: cost of education, student debt, cliff effect, proximity to jobs
104 DATA GAPS: adult education, workforce, longitudinal data, missing topics BARRIERS: cost of education, student debt, cliff effect, proximity to jobs ASSETS: higher education, workforce training, public/private partnerships
105 DATA GAPS: adult education, workforce, longitudinal data, missing topics BARRIERS: cost of education, student debt, cliff effect, proximity to jobs ASSETS: higher education, workforce training, public/private partnerships ON THE HORIZON: minimum wage, family leave, benefits
106 The Measure of Opportunity SEPTEMBER 22: BIERTH & EARLY CHILDRHOOD OCTOBER 28: EDUCATION, SKILLS, JOBS & EMPLOYMENT NOVEMBER 19: INCOME, INEQUALITY & NEIGHBORHOODS tbf.org/opportunity
107 The Measure of Opportunity
108
Like much of the country, Detroit suffered significant job losses during the Great Recession.
 36 37 POPULATION TRENDS Economy ECONOMY Like much of the country, suffered significant job losses during the Great Recession. Since bottoming out in the first quarter of 2010, however, the city has seen
Updated: December Educational Attainment
 Updated: Educational Attainment Among 25- to 29-year olds, the proportions who have attained a high school education, some college, or a bachelor s degree are all rising, according to longterm trends.
San Francisco County Weekly Wages
 San Francisco County Weekly Wages Focus on Post-Recession Recovery Q 3 205 Update Produced by: Marin Economic Consulting March 6, 206 Jon Haveman, Principal 45-336-5705 or Jon@MarinEconomicConsulting.com
The Boston Zoning Variance Database
 The Boston Zoning Variance Database From Clark Broida's MCP Thesis, 6/87 Main Table (ZONING) Field # Field Name dbaseiii+ Type dbaseiii+ Width ORACLE Type Field Description and Explanation of Codes PART
The number of involuntary part-time workers,
 University of New Hampshire Carsey School of Public Policy CARSEY RESEARCH National Issue Brief #116 Spring 2017 Involuntary Part-Time Employment A Slow and Uneven Economic Recovery Rebecca Glauber The
Suggested Citation: Institute for Research on Higher Education. (2016). College Affordability Diagnosis: Maine. Philadelphia, PA: Institute for
. College Affordability Diagnosis: Maine. Philadelphia, PA: Institute for") MAINE Suggested Citation: Institute for Research on Higher Education. (2016). College Affordability Diagnosis: Maine. Philadelphia, PA: Institute for Research on Higher Education, Graduate School of Education,
MAINE Suggested Citation: Institute for Research on Higher Education. (2016). College Affordability Diagnosis: Maine. Philadelphia, PA: Institute for Research on Higher Education, Graduate School of Education,
Iowa School District Profiles. Le Mars
 Iowa School District Profiles Overview This profile describes enrollment trends, student performance, income levels, population, and other characteristics of the public school district. The report utilizes
Welcome. Paulo Goes Dean, Eller College of Management Welcome Our region
 Welcome. Paulo Goes Dean, Welcome. Our region Outlook for Tucson Patricia Feeney Executive Director, Southern Arizona Market Chase George W. Hammond, Ph.D. Director, University of Arizona 1 Visit the award-winning
National Academies STEM Workforce Summit
 National Academies STEM Workforce Summit September 21-22, 2015 Irwin Kirsch Director, Center for Global Assessment PIAAC and Policy Research ETS Policy Research using PIAAC data America s Skills Challenge:
Status of Women of Color in Science, Engineering, and Medicine
 Status of Women of Color in Science, Engineering, and Medicine The figures and tables below are based upon the latest publicly available data from AAMC, NSF, Department of Education and the US Census Bureau.
The Value of English Proficiency to the. By Amber Schwartz and Don Soifer December 2012
 The Value of English Proficiency to the United States Economy By Amber Schwartz and Don Soifer December 2012 Also by the Lexington Institute: English Language Learners and NAEP: Progress Through Inclusion,
EDUCATIONAL ATTAINMENT
 EDUCATIONAL ATTAINMENT By 2030, at least 60 percent of Texans ages 25 to 34 will have a postsecondary credential or degree. Target: Increase the percent of Texans ages 25 to 34 with a postsecondary credential.
EDUCATIONAL ATTAINMENT
 EDUCATIONAL ATTAINMENT By 2030, at least 60 percent of Texans ages 25 to 34 will have a postsecondary credential or degree. Target: Increase the percent of Texans ages 25 to 34 with a postsecondary credential.
EARNING. THE ACCT 2016 INVITATIONAL SYMPOSIUM: GETTING IN THE FAST LANE Ensuring Economic Security and Meeting the Workforce Needs of the Nation
 THE ACCT 2016 INVITATIONAL SYMPOSIUM: GETTING IN THE FAST LANE Ensuring Economic Security and Meeting the Workforce Needs of the Nation Discussion Papers 2016 Invitational Symposium LEARNING WHILE EARNING
The Dropout Crisis is a National Issue
 2012 ANNUAL REPORT The Dropout Crisis is a National Issue Thirty percent of U.S. students drop out of high school, with dropout rates exceeding 50% in poor urban communities. Students who dropout face
DELIVERING A DEMAND LED SYSTEM IN THE U.S. THE ALAMO COMMUNITY COLLEGES APPROACH
 DELIVERING A DEMAND LED SYSTEM IN THE U.S. THE ALAMO COMMUNITY COLLEGES APPROACH LEARNING AND SKILLS DEVELOPMENT AGENCY NORTHERN IRELAND DR. BRUCE LESLIE, CHANCELLOR THE ALAMO COMMUNITY COLLEGES 40
RETAIL SECTOR CONTINUES SLOW RECOVERY AFTER A HARSH WINTER
 RETAIL MARKET REPORT: 1Q RETAIL SECTOR CONTINUES SLOW RECOVERY AFTER A HARSH WINTER KEY INDICATORS: Key retail market indicators improved slightly this quarter. Monthly retail sales (ex: motor vehicles
Lesson M4. page 1 of 2
 Lesson M4 page 1 of 2 Miniature Gulf Coast Project Math TEKS Objectives 111.22 6b.1 (A) apply mathematics to problems arising in everyday life, society, and the workplace; 6b.1 (C) select tools, including
ILLINOIS DISTRICT REPORT CARD
 -6-525-2- HAZEL CREST SD 52-5 HAZEL CREST SD 52-5 HAZEL CREST, ILLINOIS and federal laws require public school districts to release report cards to the public each year. 2 7 ILLINOIS DISTRICT REPORT CARD
ILLINOIS DISTRICT REPORT CARD
 -6-525-2- Hazel Crest SD 52-5 Hazel Crest SD 52-5 Hazel Crest, ILLINOIS 2 8 ILLINOIS DISTRICT REPORT CARD and federal laws require public school districts to release report cards to the public each year.
The Effect of Income on Educational Attainment: Evidence from State Earned Income Tax Credit Expansions
 The Effect of Income on Educational Attainment: Evidence from State Earned Income Tax Credit Expansions Katherine Michelmore Policy Analysis and Management Cornell University km459@cornell.edu September
Rural Education in Oregon
 Rural Education in Oregon Overcoming the Challenges of Income and Distance ECONorthwest )'3231-'7 *-2%2') 40%22-2+ Cover photos courtesy of users Lars Plougmann, San José Library, Jared and Corin, U.S.Department
BOOM FOR WHOM? How the resurgence of the Bronx is leaving residents behind JULY 2008
 BOOM FOR WHOM? How the resurgence of the Bronx is leaving residents behind JULY 2008 A report of the Northwest Bronx Community & Clergy Coalition and the Community Development Project of the Urban Justice
LOW-INCOME EMPLOYEES IN THE UNITED STATES
 LOW-INCOME EMPLOYEES IN THE UNITED STATES James T. Bond and Ellen Galinsky Families and Work Institute November 2012 This report is funded by the Ford Foundation as part of its efforts to understand and
A Guide to Finding Statistics for Students
 San Joaquin Valley Statistics http://pegasi.us/sjstats/ 1 of 2 6/12/2010 5:00 PM A Guide to Finding Statistics for Students CV Stats Home By Topic By Area About the Valley About this Site Population Agriculture
San Mateo Community College District External Trends and Implications for Strategic Planning
 San Mateo Community College District External Trends and Implications for Strategic Planning Demographic Trends United States It is estimated that by 2025, the number of Americans over 60 will increase
Race, Class, and the Selective College Experience
 Race, Class, and the Selective College Experience Thomas J. Espenshade Alexandria Walton Radford Chang Young Chung Office of Population Research Princeton University December 15, 2009 1 Overview of NSCE
NATIONAL CENTER FOR EDUCATION STATISTICS
 NATIONAL CENTER FOR EDUCATION STATISTICS Palm Desert, CA The Integrated Postsecondary Education Data System (IPEDS) is the nation s core postsecondary education data collection program. It is a single,
Cooper Upper Elementary School
 LIVONIA PUBLIC SCHOOLS http://cooper.livoniapublicschools.org 215-216 Annual Education Report BOARD OF EDUCATION 215-16 Colleen Burton, President Dianne Laura, Vice President Tammy Bonifield, Secretary
Cooper Upper Elementary School
 LIVONIA PUBLIC SCHOOLS www.livoniapublicschools.org/cooper 213-214 BOARD OF EDUCATION 213-14 Mark Johnson, President Colleen Burton, Vice President Dianne Laura, Secretary Tammy Bonifield, Trustee Dan
WORKFORCE DEVELOPMENT: WHAT WORKS? WHO BENEFITS? Harry J. Holzer Georgetown University The Urban Institute February 2010
 WORKFORCE DEVELOPMENT: WHAT WORKS? WHO BENEFITS? Harry J. Holzer Georgetown University The Urban Institute February 2010 1 Outline Labor Market: Demand v. Supply of Skills; Middle- v. High-Skill Jobs Effective
ACCESS TO SUCCESS IN AMERICA: Where are we? What Can We Learn from Colleges on the Performance Frontier?
 ACCESS TO SUCCESS IN AMERICA: Where are we? What Can We Learn from Colleges on the Performance Frontier? America: Two Powerful Stories Maricopa Community Colleges Student Success Conference Phoenix, AZ
An Analysis of the El Reno Area Labor Force
 An Analysis of the El Reno Area Labor Force Summary Report for the El Reno Industrial Development Corporation and Oklahoma Department of Commerce David A. Penn and Robert C. Dauffenbach Center for Economic
Fostering Equity and Student Success in Higher Education
 Fostering Equity and Student Success in Higher Education Laura I Rendón Professor Emerita University of Texas-San Antonio Presentation at NTCC 22 nd Annual Fall Leadership Conference Gainsesville, TX September
EDELINA M. BURCIAGA 3151 Social Science Plaza Irvine, CA
 EDELINA M. BURCIAGA 3151 Social Science Plaza Irvine, CA 92697-5000 eburciag@uci.edu EDUCATION UNIVERSITY OF CALIFORNIA, IRVINE, Irvine, CA Doctoral candidate, Department of Sociology. Expected graduation
Reaching the Hispanic Market The Arbonne Hispanic Initiative
 Reaching the Hispanic Market The Arbonne Hispanic Initiative Hispanic Initiative Overview 2002 Arbonne en Español Started 2006 Initiated Hispanic Initiative 2007 Market Study & Survey Field Support» Jael
Executive Summary. Walker County Board of Education. Dr. Jason Adkins, Superintendent 1710 Alabama Avenue Jasper, AL 35501
 Dr. Jason Adkins, Superintendent 1710 Alabama Avenue Jasper, AL 35501 Document Generated On November 3, 2016 TABLE OF CONTENTS Introduction 1 Description of the School System 2 System's Purpose 4 Notable
Moving the Needle: Creating Better Career Opportunities and Workforce Readiness. Austin ISD Progress Report
 Moving the Needle: Creating Better Career Opportunities and Workforce Readiness Austin ISD Progress Report 2013 A Letter to the Community Central Texas Job Openings More than 150 people move to the Austin
cover Private Public Schools America s Michael J. Petrilli and Janie Scull
 cover America s Private Public Schools Michael J. Petrilli and Janie Scull February 2010 contents introduction 3 national findings 5 state findings 6 metropolitan area findings 13 conclusion 18 about us
Educational Attainment
 A Demographic and Socio-Economic Profile of Allen County, Indiana based on the 2010 Census and the American Community Survey Educational Attainment A Review of Census Data Related to the Educational Attainment
Shelters Elementary School
 Shelters Elementary School August 2, 24 Dear Parents and Community Members: We are pleased to present you with the (AER) which provides key information on the 23-24 educational progress for the Shelters
21 st Century Apprenticeship Models
 21 st Century Apprenticeship Models Marjorie Valentin, Three Rivers Community College Donna Lawrence, Midlands Technical College Eric Roe, PhD, Polk State College Linda Head, Lone Star College System Let
Lied Scottsbluff Public Library Strategic Plan
 Lied Scottsbluff Public Library 2015 2018 Strategic Plan Purpose Statement: Strategic plans are used to communicate an organization s goals and the strategies needed to achieve these goals. Through the
Effective Recruitment and Retention Strategies for Underrepresented Minority Students: Perspectives from Dental Students
 Critical Issues in Dental Education Effective Recruitment and Retention Strategies for Underrepresented Minority Students: Perspectives from Dental Students Naty Lopez, Ph.D.; Rose Wadenya, D.M.D., M.S.;
Trends in Tuition at Idaho s Public Colleges and Universities: Critical Context for the State s Education Goals
 1 Trends in Tuition at Idaho s Public Colleges and Universities: Critical Context for the State s Education Goals June 2017 Idahoans have long valued public higher education, recognizing its importance
BUILDING CAPACITY FOR COLLEGE AND CAREER READINESS: LESSONS LEARNED FROM NAEP ITEM ANALYSES. Council of the Great City Schools
 1 BUILDING CAPACITY FOR COLLEGE AND CAREER READINESS: LESSONS LEARNED FROM NAEP ITEM ANALYSES Council of the Great City Schools 2 Overview This analysis explores national, state and district performance
Coming in. Coming in. Coming in
 212-213 Report Card for Glenville High School SCHOOL DISTRICT District results under review by the Ohio Department of Education based upon 211 findings by the Auditor of State. Achievement This grade combines
Sheryl L. Skaggs, Ph.D. Curriculum Vitae
 October 2011 Sheryl L. Skaggs, Ph.D. Curriculum Vitae School of Economic, Political and Policy Sciences Sociology and Public Policy The University of Texas at Dallas 800 W. Campbell Rd., GR 31; Richardson,
The Racial Wealth Gap
 The Racial Wealth Gap Why Policy Matters by Laura Sullivan, Tatjana Meschede, Lars Dietrich, & Thomas Shapiro institute for assets & social policy, brandeis university Amy Traub, Catherine Ruetschlin &
Fruitvale Station Shopping Center > Retail
 Oakland, CA > Retail > Very rare (i.e. high barriers of entry) freeway visible, surface parked, high volume grocery anchored regional serving center. > Notable tenants include: Food Maxx, Starbucks, Office
Executive Summary. Laurel County School District. Dr. Doug Bennett, Superintendent 718 N Main St London, KY
 Dr. Doug Bennett, Superintendent 718 N Main St London, KY 40741-1222 Document Generated On January 13, 2014 TABLE OF CONTENTS Introduction 1 Description of the School System 2 System's Purpose 4 Notable
Educational Management Corp Chef s Academy
 Educational Management Corp Chef s Academy Morrisville, North Carolina (Raleigh MSA) Exclusively Offered By: Porthaven Partners 8908 S. Yale Ave. Suite 400 Tulsa, OK 74137 Ryan Carter Partner P: 918.496.1464
2/3 9.8% 38% $0.78. The Status of Women in Missouri: 2016 ARE WOMEN 51% 22% A Comprehensive Report of Leading Indicators and Findings.
 A Missouri WOMAN WORKING FULL-TIME EARNS ONLY $0.78 FOR EACH DOLLAR A MAN EARNS 2/3 OF Missouri SENIORS LIVING IN POVERTY ARE WOMEN 9.8% The Status of Women in Missouri: 2016 A Comprehensive Report of
46 Children s Defense Fund
 Nationally, about 1 in 15 teens ages 16 to 19 is a dropout. Fewer than two-thirds of 9 th graders in Florida, Georgia, Louisiana and Nevada graduate from high school within four years with a regular diploma.
Average Loan or Lease Term. Average
 Auto Credit For many working families and individuals, owning a car or truck is critical to economic success. For most, a car or other vehicle is their primary means of transportation to work. For those
TENNESSEE S ECONOMY: Implications for Economic Development
 TENNESSEE S ECONOMY: Implications for Economic Development William F. Fox, Director Center for Business and Economic Research The University of Tennessee, Knoxville August 2005 U.S. ECONOMY W.F. Fox, CBER,
Descriptive Summary of Beginning Postsecondary Students Two Years After Entry
 NATIONAL CENTER FOR EDUCATION STATISTICS Statistical Analysis Report June 994 Descriptive Summary of 989 90 Beginning Postsecondary Students Two Years After Entry Contractor Report Robert Fitzgerald Lutz
U VA THE CHANGING FACE OF UVA STUDENTS: SSESSMENT. About The Study
 About The Study U VA SSESSMENT In 6, the University of Virginia Office of Institutional Assessment and Studies undertook a study to describe how first-year students have changed over the past four decades.
Institution-Set Standards: CTE Job Placement Resources. February 17, 2016 Danielle Pearson, Institutional Research
 Institution-Set Standards: CTE Job Placement Resources February 17, 2016 Danielle Pearson, Institutional Research Standard 1.B.3 states: The institution establishes institution-set standards for student
Wisconsin 4 th Grade Reading Results on the 2015 National Assessment of Educational Progress (NAEP)
") Wisconsin 4 th Grade Reading Results on the 2015 National Assessment of Educational Progress (NAEP) Main takeaways from the 2015 NAEP 4 th grade reading exam: Wisconsin scores have been statistically flat
Wisconsin 4 th Grade Reading Results on the 2015 National Assessment of Educational Progress (NAEP) Main takeaways from the 2015 NAEP 4 th grade reading exam: Wisconsin scores have been statistically flat
Options for Updating Wyoming s Regional Cost Adjustment
 Options for Updating Wyoming s Regional Cost Adjustment Submitted to: The Select Committee on School Finance Recalibration Submitted by: Lori L. Taylor, Ph.D. October 2015 Options for Updating Wyoming
Serving Country and Community: A Study of Service in AmeriCorps. A Profile of AmeriCorps Members at Baseline. June 2001
 Serving Country and Community: A Study of Service in AmeriCorps Cambridge, MA Lexington, MA Hadley, MA Bethesda, MD Washington, DC Chicago, IL Cairo, Egypt Johannesburg, South Africa A Profile of AmeriCorps
Financing Education In Minnesota
 Financing Education In Minnesota 2016-2017 Created with Tagul.com A Publication of the Minnesota House of Representatives Fiscal Analysis Department August 2016 Financing Education in Minnesota 2016-17
About PACER PACER FACTS. What is PACER Center? Highlights from PACER programs:
 PACER Programs - Parent Training & Information for Children with Disabilities Page 1 of 4 Home I About PACER I PACER Facts About PACER PACER FACTS What is PACER Center? What is PACER's mission? Is PACER
Student Mobility Rates in Massachusetts Public Schools
 Student Mobility Rates in Massachusetts Public Schools Introduction The Massachusetts Department of Elementary and Secondary Education (ESE) calculates and reports mobility rates as part of its overall
Enrollment Trends. Past, Present, and. Future. Presentation Topics. NCCC enrollment down from peak levels
 Presentation Topics 1. Enrollment Trends 2. Attainment Trends Past, Present, and Future Challenges & Opportunities for NC Community Colleges August 17, 217 Rebecca Tippett Director, Carolina Demography
MAINE 2011 For a strong economy, the skills gap must be closed.
 For a strong economy, the skills gap must be closed. 62% 36% 26% By 2020, jobs requiring a career certificate or college degree Skills gap Too few students make it through college. MEMBER Maine adults
Creating a Culture of Transfer
 J. Luke Wood, Carlos Nevarez, and Adriel A. Hilton Creating a Culture of Transfer Dr. J. Luke Wood is an Assistant Professor in the Department of Administration, Rehabilitation, and Postsecondary Education
Creating Collaborative Partnerships: The Success Stories and Challenges
 Creating Collaborative Partnerships: The Success Stories and Challenges Community College Center of Excellence Building a World Class Workforce Through Community College Partnerships Cari Mallory National
STATE CAPITAL SPENDING ON PK 12 SCHOOL FACILITIES NORTH CAROLINA
 STATE CAPITAL SPENDING ON PK 12 SCHOOL FACILITIES NORTH CAROLINA NOVEMBER 2010 Authors Mary Filardo Stephanie Cheng Marni Allen Michelle Bar Jessie Ulsoy 21st Century School Fund (21CSF) Founded in 1994,
Educational History. B. A., 1988, University Center at Tulsa, Sociology. Professional Experience. Principal Positions:
 May 2013 Sheryl L. Skaggs, Ph.D. Curriculum Vitae School of Economic, Political and Policy Sciences Sociology and Public Policy The University of Texas at Dallas 800 W. Campbell Rd., GR 31; Richardson,
National Survey of Student Engagement The College Student Report
 The College Student Report This is a facsimile of the NSSE survey (available at nsse.iub.edu/links/surveys). The survey itself is administered online. 1. During the current school year, about how often
RAISING ACHIEVEMENT BY RAISING STANDARDS. Presenter: Erin Jones Assistant Superintendent for Student Achievement, OSPI
 RAISING ACHIEVEMENT BY RAISING STANDARDS Presenter: Erin Jones Assistant Superintendent for Student Achievement, OSPI Agenda Introductions Definitions History of the work Strategies Next steps Debrief
Trends & Issues Report
 Trends & Issues Report prepared by David Piercy & Marilyn Clotz Key Enrollment & Demographic Trends Options Identified by the Eight Focus Groups General Themes 4J Eugene School District 4J Eugene, Oregon
Estimating the Cost of Meeting Student Performance Standards in the St. Louis Public Schools
 Estimating the Cost of Meeting Student Performance Standards in the St. Louis Public Schools Prepared by: William Duncombe Professor of Public Administration Education Finance and Accountability Program
California State University, Los Angeles TRIO Upward Bound & Upward Bound Math/Science
 Application must be completed in black or blue ink only. STUDENT INFORMATION Name: Social Security # - - First Middle Last Address: Apt.# Phone: ( ) City: State: Zip Code: Date of Birth: Place of Birth:
CLINTON-MACOMB PUBLIC LIBRARY STRATEGIC PLAN
 CLINTON-MACOMB PUBLIC LIBRARY STRATEGIC PLAN 2018-2020 INSPIRE. CREATE. DREAM. LEARN. OUR MISSION Ensure CMPL is valued as an essential community service by focusing on the following strategic priorities:
Kahului Elementary School
 Kahului Elementary Code: 405 Status and Improvement Report Year 2014-15 Focus On Standards Grades K-5 Focus on Standards Description Contents Setting Student Profile Community Profile Improvement Summary
Practices Worthy of Attention Step Up to High School Chicago Public Schools Chicago, Illinois
 Step Up to High School Chicago Public Schools Chicago, Illinois Summary of the Practice. Step Up to High School is a four-week transitional summer program for incoming ninth-graders in Chicago Public Schools.
A Diverse Student Body
 A Diverse Student Body No two diversity plans are alike, even when expressing the importance of having students from diverse backgrounds. A top-tier school that attracts outstanding students uses this
THE ECONOMIC AND SOCIAL IMPACT OF APPRENTICESHIP PROGRAMS
 THE ECONOMIC AND SOCIAL IMPACT OF APPRENTICESHIP PROGRAMS March 14, 2017 Presentation by: Frank Manzo IV, MPP Illinois Economic Policy Institute fmanzo@illinoisepi.org www.illinoisepi.org The Big Takeaways
Testimony to the U.S. Senate Committee on Health, Education, Labor and Pensions. John White, Louisiana State Superintendent of Education
 Testimony to the U.S. Senate Committee on Health, Education, Labor and Pensions John White, Louisiana State Superintendent of Education October 3, 2017 Chairman Alexander, Senator Murray, members of the
SUPPORTING COMMUNITY COLLEGE DELIVERY OF APPRENTICESHIPS
 The apprenticeship system is evolving to meet the needs of today s and tomorrow s economy. The two significant goals that have emerged involve broadening the roles of apprenticeship partners and increasing
Ready, willing, and unable:
 Ready, willing, and unable: How financial barriers obstruct bachelor-degree attainment in Texas A report to the 80 th regular session of the Texas Legislature Prepared by TG Research and Analytical Services
California s Bold Reimagining of Adult Education. Meeting of the Minds September 6, 2017
 California s Bold Reimagining of Adult Education Meeting of the Minds September 6, 2017 Adult Education in California Historically CDE State Run Program $750M (est) Ten Program Areas K12 Districts / County
2012 New England Regional Forum Boston, Massachusetts Wednesday, February 1, More Than a Test: The SAT and SAT Subject Tests
 2012 New England Regional Forum Boston, Massachusetts Wednesday, February 1, 2012 More Than a Test: The SAT and SAT Subject Tests 1 Presenters Chris Lucier Vice President for Enrollment Management, University
success matters Oakton Community College Strategic Plan
 success matters Oakton Community College 2018-2022 Strategic Plan Contents 1 Message from the President 2 Mission, Vision, and Values 3 Strategic Planning Process 4 Key Characteristics and Trends Describing
UEP 251: Economics for Planning and Policy Analysis Spring 2015
 UEP 251: Economics for Planning and Policy Analysis Spring 2015 Instructors Mary Davis Urban and Environmental Policy and Planning Office location: 72 Professor s Row mary.davis@tufts.edu; 617-627-4719
An Empirical Analysis of the Effects of Mexican American Studies Participation on Student Achievement within Tucson Unified School District
 An Empirical Analysis of the Effects of Mexican American Studies Participation on Student Achievement within Tucson Unified School District Report Submitted June 20, 2012, to Willis D. Hawley, Ph.D., Special
Kenya: Age distribution and school attendance of girls aged 9-13 years. UNESCO Institute for Statistics. 20 December 2012
 1. Introduction Kenya: Age distribution and school attendance of girls aged 9-13 years UNESCO Institute for Statistics 2 December 212 This document provides an overview of the pattern of school attendance
Women, Minorities, and Persons with Disabilities in Science and Engineering
 2017 Women, Minorities, and Persons with Disabilities in Science and Engineering Emilda B. Rivers, Deputy Director National Center for Science and Engineering Statistics National Science Foundation www.nsf.gov/statistics
OREGON TECH ECONOMIC IMPACT ANALYSIS
 OREGON TECH ECONOMIC IMPACT ANALYSIS JANUARY 2016 PREPARED BY: This page left intentionally blank TABLE OF CONTENTS 1 Executive Summary 2 Introduction 3 Oregon Tech s Role in Oregon 4 Career Readiness
STATE BOARD OF COMMUNITY COLLEGES Curriculum Program Applications Fast Track for Action [FTFA*]
![STATE BOARD OF COMMUNITY COLLEGES Curriculum Program Applications Fast Track for Action [FTFA*]](/thumbs/71/65575576.jpg "STATE BOARD OF COMMUNITY COLLEGES Curriculum Program Applications Fast Track for Action [FTFA*]") Attachment PROG 10 STATE BOARD OF COMMUNITY COLLEGES Curriculum Program Applications Fast Track for Action [FTFA*] Request: The State Board of Community Colleges is asked to approve the curriculum programs
Attachment PROG 10 STATE BOARD OF COMMUNITY COLLEGES Curriculum Program Applications Fast Track for Action [FTFA*] Request: The State Board of Community Colleges is asked to approve the curriculum programs
Arkansas Beauty School-Little Rock Esthetics Program Consumer Packet 8521 Geyer Springs Road, Unit 30 Little Rock, AR 72209
 Arkansas Beauty School-Little Rock Esthetics Program Consumer Packet 8521 Geyer Springs Road, Unit 30 Little Rock, AR 72209 www.studyhair.org Arkansas Beauty School-LR (ABSLR) is proud of its educational
An Introduction to School Finance in Texas
 An Introduction to School Finance in Texas May 12, 2010 Sheryl Pace TTARA Research Foundation space@ttara.org (512) 472-8838 Texas Public Education System 1,300 school districts (#1 in the nation) 1,025
Economics 6295 Labor Economics and Public Policy Section 12 Semester: Spring 2017 Thursdays 6:10 to 8:40 p.m. Location: TBD.
 Department of Economics Course: Economics 6295 Labor Economics and Public Policy Section 12 Semester: Spring 2017 Time: Thursdays 6:10 to 8:40 p.m. Location: TBD. INSTRUCTOR Name: Campus Address: E-mail:
The Condition of College & Career Readiness 2016
 The Condition of College and Career Readiness This report looks at the progress of the 16 ACT -tested graduating class relative to college and career readiness. This year s report shows that 64% of students
Pathways to Health Professions of the Future
 Pathways to Health Professions of the Future Stephen C. Shannon, DO, MPH American Association of Colleges of Osteopathic Medicine Copyright 2014 AACOM, all rights reserved. Photo courtesy of LECOM The
Integrated Pell Grant Expansion and Bachelor s Completion Pay for Performance: A Cost-Effectiveness Analysis. Harrison G. Holcomb William T.
 1 Integrated Pell Grant Expansion and Bachelor s Completion Pay for Performance: A Cost-Effectiveness Analysis Harrison G. Holcomb William T. Drier School of Public Affairs University of Colorado Denver
UH STEM Pathways Project
 UH STEM Pathways Project John Rand, PhD Director of STEM Education University of Hawai i System UH STEM Pathways Project University of Hawai i Strategic Directions, 2015-2021 http://www.hawaii.edu/strategicdirections/