Draft Summary of Goals and Objectives for the New District Strategic Plan
|
|
|
- Roxanne McCormick
- 5 years ago
- Views:
Transcription
1 Draft Summary of Goals and Objectives for the New District Strategic Plan Preamble: Comprised of the nine colleges; Los Angeles City College, East Los Angeles College, Los Angeles Harbor College, Los Angeles Mission College, Los Angeles Pierce College, Los Angeles Southwest College, Los Angeles Trade Technical College, Los Angeles Valley College and West Los Angeles College, we, the Los Angeles Community College District have set these goals as fundamental to the success of our District, the colleges, and the students we serve. Goal 1: We will increase college going for the Los Angeles region through enhanced outreach to community and educational partners and expanded access to academic programs that meet community and student needs. Objective 1: We will expand educational opportunities to local high school students by increasing the number of courses offered through dual enrollment. Objective 2: We will fully implement the LA College Promise and will seek to expand the promise to additional school districts and municipalities in the service area. Objective 3: We, in partnership with Los Angeles Regional Adult Education Consortium, will increase educational opportunities to nontraditional students through the expansion of noncredit adult education courses focused on skills improvement and vocational training. Goal 2: We will develop a premier learning environment that places students as the first priority in the institution and effectively supports students in attaining educational goals. Objective 1: We will have an excellent campus climate by improving student services, providing a safe learning environment, and by establishing a standard for customer service. Objective 2: We will create an environment that is respectful to the needs of diverse populations and that embraces the diversity of opinions found in a global society. Objective 3: We will increase fulltime enrollment for students through the development of flexible programs focused on working students and students with barriers to attending traditionally scheduled programs. Objective 4: We will review and refine curriculum and programs to ensure that they are responsive to student needs and meeting the economic, industry, and societal needs of the region. Objective 5: We will provide facilities and technologies to effectively serve and connect with the modern student and enhance regular and effective communication. Objective 6: We will increase access to those traditionally underrepresented in higher education by assisting students in gaining access to financial aid and ensuring that all students, whether in-person or online, receive orientation, multiple measures assessment, and educational planning. Objective 7: We will increase student persistence and successful course completion through effective practices. Goal 3: We will increase student completion to exceed the statewide performance measures and increase attainment of milestones indicative of academic success. Objective 1: We will decrease time to completion by enhancing academic and student support programs. Objective 2: We will increase completion of degrees and certificates. Page 1 of 2
2 Draft Summary of Goals and Objectives for the New District Strategic Plan Objective 3: We will increase the number of students transferring to four-year institutions. Objective 4: We will increase career and job placement rates by enhancing business and industry partnerships, internships, and employment opportunities. Objective 5: We will increase equity in the attainment of student milestones. Goal 4: We will improve organizational effectiveness through streamlined processes, minimized duplication of efforts, and enhanced communication and training. Objective 1: We will invest in professional development opportunities for faculty, staff, and administrators to enhance work performance, broaden skills for leadership and career advancement, leverage academic programs, and allow for effective and clear career pathways for all employees. Objective 2: We will improve recruiting, hiring, orientation and evaluation processes, and improve the customer service provided to all employees. Objective 3: We will improve processes to increase responsiveness to and within colleges, limit barriers, and accelerate completion of required business processes and tasks. Objective 4: We will use state-of-the-art technology to improve communication, including the development of an effective website that assists students, employees, and the community in interacting with the District. Objective 5: We will revise all District policies and procedures to implement the Community College League of California model policy. Goal 5: We will improve fiscal integrity through enhanced resource development, institutional advancement, and effective use of existing resources. Objective 1: We will enhance communication, support, and collaboration associated with grant development processes for curricular and student support programs. Objective 2: We will develop community partnerships to assist the District in achieving its mission and enhance student success by providing additional support to students. Objective 3: We will enhance the District and College foundations and improve alumni relations leading to the development of endowments from which additional resources for students and academic and support programs can be drawn. Objective 4: We will effectively use District and College resources and implement position control to support the ongoing improvements of academic and student support programs. Objective 5: We will improve the resource allocation processes to be integrated with District strategic plan. Objective 6: We will effectively plan and use resources to build and maintain District and College facilities and infrastructure in support of the academic and student support programs. Objective 7: We will develop and implement districtwide standards in information technology, facilities, and human resources that apply to all colleges. Page 2 of 2
3 Evaluation Report July 31, 2017
4
5 Table of Contents The Los Angeles Community College District... 1 District Strategic Plan Background... 1 Los Angeles Community College District Strategic Plan, District Strategic Plan Evaluation... 4 GOAL Objective 1: Ensure equitable access to education Objective 2: Increase the percentage of new students who complete the matriculation process by the end of their first semester Objective 3: Increase the percentage of new students successfully completing at least one English and Math class in their first year and persisting to subsequent terms GOAL Objective 1: Provide a learner-centered learning environment that encourages active learning and student engagement Objective 2: Increase the percentage of new students who have reached the following milestones within three and six years: successfully completing 30 and 60 units; successfully completing English 101 and Math 125; and earning a certificate, degree, or transferring to a 4-year college or university Objective 3: Increase the number of students who complete career-focused certificates in a timely manner, find employment in high growth/high earning occupations, or realize higher earnings as a result of their educational experience Objective 4: Increase equity in successful outcomes by identifying achievement gaps and increasing performance of under-performing groups GOAL Objective 1: Assess and improve district processes and services Objective 2: Improve communications and governance throughout the district Objective 3: Improve employee development opportunities GOAL Objective 1: Develop and diversify sources of revenue Objective 2: District and college Foundations will significantly increase external resources in order to support the District and colleges Objective 3: Increase business and community partnerships to support innovation and student learning Summary of Findings Recommendations Looking Forward to the District Strategic Plan Appendix A: List of Tables... 48
6
7 The Los Angeles Community College District The Los Angeles Community College District (LACCD) is comprised of 9 comprehensive colleges and a District Office. It is the largest community college in the United States and offers educational opportunities to students in 40 cities and communities. The District aims to provide students with an excellent education and strives to provide educational opportunities across the greater Los Angeles area. District Strategic Plan Background The District Strategic Plan (DSP) follows the first DSP that covered the 2006 through 2011 academic years. Chancellor Daniel LaVista appointed a 20-member District Strategic Planning Committee that was charged with creating a comprehensive plan. The DSP resulted from a year long process that involved: review of environmental scan data (e.g., changing demographics, K-12 enrollments, employment projections, etc.), the use of the SWOT analysis technique with various focus groups (i.e., assessing the District s Strengths, Weaknesses, Opportunities, and Threats), analyzing feedback from internal and external constituencies, and the coordination by the Educational Programs and Institutional Effectiveness (EPIE) division, District Planning Committee, and the District Strategic Planning Taskforce. The DSP included 4 goals and 13 objectives and was approved by the Board of Trustees in February The collaborative process allowed for the development of district-wide priorities and served as a planning framework for the colleges. GOAL 1: Access and Preparation for Success Improve equitable access; help students attain important early educational momentum points. GOAL 2: Teaching and Learning for Success Strengthen effective teaching and learning by providing a learner-centered educational environment; help students attain their goals of certificate and degree completion, transfer, and job training and career placement; increase equity in the achievement of these outcomes. Vision 2017 LACCD Strategic Plan GOAL 3: Goal 4: Organizational Effectiveness Resources and Collaboration Improve organizational effectiveness through datainformed planning and decision-making, process assessment, and professional development. Increase and diversify sources of revenue in order to achieve and maintain fiscal stability and to support District initiatives. Enhance and maintain mutually beneficial external partnerships with business, labor, and industry and other community and civic organizations in the greater Los Angeles area. Page 1
8 Los Angeles Community College District Strategic Plan, GOAL 1: Access and Preparation for Success. Improve equitable access; help students attain important early educational momentum points. Objective 1: Ensure equitable access to education. Measure 1: Participation rate in underserved areas Measure 2: Percentage of eligible students receiving financial aid Objective 2: Increase the percentage of new students who complete the matriculation process by the end of their first semester. Measure 1: Percentage of new students completing an English and math assessment before or in the first term Measure 2: Percentage of new students completing orientation Measure 3: Percentage of new students creating an educational plan Objective 3: Increase the percentage of new students successfully completing at least one English and Math class in their first year and persisting to subsequent terms. Measure 1: Percentage of new students successfully completing at least one English and math class in their first year Measure 2: Persistence (Fall to Spring and Fall to Fall) GOAL 2: Teaching and Learning for Success. Strengthen effective teaching and learning by providing a learnercentered educational environment; help students attain their goals of certificate and degree completion, transfer, and job training and career placement; increase equity in the achievement of these outcomes. Objective 1: Provide a learner-centered learning environment that encourages active learning and student engagement. Measure 1: Measure of active learning/project learning (from student survey) Measure of student engagement in and out of class (from student survey) Measure of self-efficacy/self-directed learning (from student survey) Measure 2: Measure of whether/how technology is being used to improve student learning and engagement (from student survey and District Employee Survey, which is to be developed) Objective 2: Increase the percentage of new students who have reached the following milestones within three and six years: successfully completing 30 and 60 units; successfully completing English 101 and Math 125; and earning a certificate, degree, or transferring to a 4-year college or university. Measure 1: Percentage of new student cohort successfully completing 30 and 60 units Measure 2: Percentage of new student cohort successfully completing English 101 and Math 125 Measure 3: Completion Rate (i.e., certificate, degree, or transfer) Objective 3: Increase the number of students who complete career-focused certificates in a timely manner, find employment in high growth/high earning occupations, or realize higher earnings as a result of their educational experience. Measure 1: Number of certificates awarded Measure 2: On-time program completion rates Measure 3: Student success scorecard skill builder metric
9 Objective 4: Increase equity in successful outcomes by identifying achievement gaps and increasing performance of under-performing groups. Measure 1: Percentage of new student cohort successfully completing 30 and 60 units by age, gender, ethnicity, and low-income status Measure 2: Percentage of new student cohort successfully completing English 101 and Math 125 by age, gender, ethnicity, and low-income status Measure 3: Completion Rate (i.e., certificate, degree, or transfer) by age, gender, ethnicity, and lowincome status Measure 4: Number of certificates awarded by age, gender, ethnicity, and low-income status GOAL 3: Organizational Effectiveness. Improve organizational effectiveness through data-informed planning and decision-making, process assessment, and professional development. Objective 1: Assess and improve district processes and services. Measure 1: Student satisfaction with district services Measure 2: College accreditation status Measure 3: Total Full Time Equivalent Student (FTES) Measure 4: Expenditures per FTES Measure 5: Average class size Measure 6: Fund balance Objective 2: Improve communications and governance throughout the district. Measure 1: Effective decision-making Measure 2: Participatory governance Measure 3: Overall rating of district-level governance Objective 3: Improve employee development opportunities. Measure 1: Staff development expenditures (according to Functional Area 6750 and faculty/staff development fund) Goal 4: Resources and Collaboration. Increase and diversify sources of revenue in order to achieve and maintain fiscal stability and to support District initiatives. Enhance and maintain mutually beneficial external partnerships with business, labor, and industry and other community and civic organizations in the greater Los Angeles area. Objective 1: Develop and diversify sources of revenue. Measure 1: Actual expenditures for other specially funded programs Objective 2: District and college Foundations will significantly increase external resources in order to support the District and colleges. Measure 1: Funds raised (annual and cumulative) Objective 3: Increase business and community partnerships to support innovation and student learning. Measure 1: Number and type of community/business partnerships
10 District Strategic Plan Evaluation To evaluate the current DSP, EPIE compiled data from various metrics and data from College Effectiveness Reports in years 2012 to The DSP Evaluation Report analyzes the outcome data on plan metrics, reviews the validity of the metrics, and suggests recommendations for improving the DSP. Qualitative input from the colleges was also included, and the report was vetted through the District Planning Committee and the District Research Committee. GOAL 1 Access and Preparation for Success Objective 1: Ensure equitable access to education. Measure 1: Participation rate in underserved areas Measure 2: Percentage of eligible students receiving financial aid Measure Participation Rate in Underserved Areas District Participation Rate % Summary of Findings. The District participation rate was 11.9% in the academic year. This is the percentage of the year old population within the District s boundaries that is enrolled in a community college in that district. This rate is lower than the state average of 18.3%. Unfortunately, there are no data available for previous years, as this is a new measure that is being collected by the state. College Plans for Improvement. Many colleges plan to conduct more outreach in order to promote attendance. With the implementation of the Los Angeles College Promise program, the District participation rate is anticipated to increase. In addition, AB 288, that allows dual-enrollment, is also anticipated to help increase the number of students attending the LACCD colleges and establish seamless pathways from high school to community college for student who are struggling or are at risk. Measure Percentage of Eligible Students Receiving Pell Grant College Year Change City 67% 74% 76% 75% 69% 2% East 70% 70% 66% 68% 62% 8% Harbor 83% 81% 80% 79% 74% 9% Mission 69% 69% 70% 67% 68% 1% Pierce 82% 82% 80% 78% 75% 7% Southwest 80% 76% 78% 68% 72% 8% Trade 62% 64% 66% 65% 60% 2% Valley 68% 64% 67% 69% 68% 0% West 64% 64% 63% 62% 52% 12% District 71% 71% 71% 70% 66% 5% Page 4
11 Summary of Findings. LACCD saw decreases in the percentage of eligible students receiving Pell Grants from 2011 to In 2015, approximately 66% of eligible LACCD students received Pell Grants, which is a 5% decrease from In 2013, the majority of colleges started to experience a decrease of eligible students receiving financial aid that may be partially due to changes made in eligibility requirements for Pell Grants, which changed in the academic year. A new Lifetime Eligibility Used (LEU) regulation has resulted in some students choosing to reserve Pell Grants for later use in their academic career. Additionally, due to the LEU, some students have effectively maxed out of eligibility. It is important to note that although some students do not elect to receive a Pell Grant, they do receive aid from the California Community Colleges Board of Governors (BOG) Fee Waiver. At Los Angeles Mission and Harbor Colleges, for example, over 80% of eligible students received financial aid when including students who are receiving a BOG fee waiver. At Los Angeles Southwest College (LASC), this figure is 95%. LASC has consistently had the highest percentage rate of eligible students receiving financial aid within the district. College Plans for Improvement. Many colleges plan to continue to or increase financial aid awareness and outreach. These plans will help students learn about the financial aid processes, budget management, and repayment responsibilities. At West Los Angeles College, in particular, they plan ensuring adequate staffing to help students with their financial aid applications and provide outreach support in order to increase the number of under-represented student groups receiving aid, such as veterans and foster youth. The Financial Aid Office will also increase the number of Satisfactory Academic Progress workshops (offered for students disqualified during the award year to appeal and regain eligibility) and work to involve parents in the financial aid application process by hosting evening, parent-night workshops. In addition to college s plans for improvement, it may be sensible to consider reporting additional metrics in order to accurately capture the percentage of eligible students receiving financial aid. While reporting the percentage of eligible students receiving Pell Grants is a good foundation, the recent changes in LEU regulations may underestimate the number of students receiving aid from other sources, such as the BOG fee waiver presently and the LA Promise students in the future. Reporting percentages of eligible students receiving Pell Grants and the percentage of students receiving aid from other sources may help more accurately capture this metric. Goal 1, Objective 1 Conclusion. The percentage of the year old population within the LACCD s boundaries that is enrolled in a community college is low. This partially means that the District could do more in order to increase district participation. Many changes have been made recently that may impact enrollment at LACCD colleges, including the implementation of the Achieving the Dream program, implementation of the LA College Promise program, and the enactment of AB 288. These changes to the community college landscape may help improve LACCD s ability to increase college participation in underserved areas. In addition, it is important to note that although LACCD provides an affordable postsecondary education, a great deal of students could not afford college without federally-funded Pell Grants. In the academic year, less than half (43.6%) of all students at all 2-year public colleges received any type of federal aid, including a Pell Grant. 1 In the same years, 71% of eligible LACCD students received Pell Grants. This means that LACCD is above the national average and doing well in making sure that students apply for aid. In addition, some colleges note that new and younger students do not use financial aid properly. Because 1 Juszkiewick, J. (2014, April). Community College and Federal Student Financial Aid: A Primer. Washington, DC: American Association of Community Colleges. Page 5
12 of this, LACCD recognizes that ensuring that students are provided and actively use financial aid resources will be an integral part of increasing the percentage of eligible students receiving financial aid. For example, Los Angeles City College has been actively addressing the increase in demand for financial aid services by building new online resources to meet the demand. Employing these methods, in addition to continued outreach students, will help ensure that students eligible for aid will get the resources and aid needed in order to improve equitable access and help students attain important early educational momentum points. Objective 2: Increase the percentage of new students who complete the matriculation process by the end of their first semester. Measure 1: Percentage of new students completing an English and math assessment before or in the first term Measure 2: Percentage of new students completing orientation Measure 3: Percentage of new students creating an educational plan Measure 1.2.1a Percentage of New Students Completing an English Assessment Before or in the First Term College Year Change City 58% 62% 61% 71% 71% 13% East 78% 84% 80% 83% 82% 4% Harbor 71% 70% 70% 79% 78% 7% Mission 76% 78% 75% 77% 80% 4% Pierce 74% 76% 73% 78% 76% 2% Southwest 79% 83% 77% 81% 83% 4% Trade N/A N/A N/A N/A N/A N/A Valley 73% 70% 72% 78% 74% 1% West 63% 73% 70% 75% 77% 14% District 72% 75% 73% 78% 78% 6% Measure 1.2.1b Percentage of New Students Completing a Math Assessment Before or in the First Term College Year Change City 61% 59% 62% 75% 74% 13% East 86% 88% 88% 91% 91% 5% Harbor 69% 61% 68% 79% 78% 9% Mission 77% 77% 75% 77% 82% 5% Pierce 75% 75% 73% 82% 81% 6% Southwest 78% 80% 77% 78% 79% 1% Trade N/A N/A N/A N/A N/A N/A Valley 75% 70% 78% 83% 60% 15% West 64% 70% 72% 78% 79% 15% District 74% 74% 75% 82% 79% 5% Page 6
13 Summary of Findings. LACCD saw overall increases in the percentages of new students completing English and math assessments before the first term from 2011 to In 2015, approximately 78% of new students completed an English assessment and 79% of new students completed a math assessment. District-wide, the percentage for English assessments increased by 6% and increased by 5% for math assessments from Los Angeles City College (LACC) and West Los Angeles College (WLAC) saw the greatest improvements in the percentage of students completing assessments, 13% and 15% respectively. Both LACC and WLAC recognized that they did not initially have sufficient resources and that students did not have clear pathways to the services and resources they needed. At WLAC, for example, the increase of assessments can be linked to the new Student Services Building, which provides well-designed facilities that include large computer labs dedicated to assessment, which allow WLAC to be more efficient and have an increased capacity for assessing English and math skills in their new student population. In addition, WLAC designed and implemented a new matriculation process housed online in a portal called West Expressway; this system was also helpful with increasing the percentage of assessments completed. Please note that complete assessment data were not available for Los Angeles Trade-Technical College (LATTC), as they were using another internal system to track the number of students completing English and Math assessments. Currently, LATTC has transitioned to using the same reporting system as the other colleges and will be available for future reports. College Plans for Improvement. Colleges with gains in English and math assessments will continue their effort in providing information to students about the matriculation process through orientations, campus programs, and high school outreach programs. Implementation of SB 1456 and Title V enrollment priorities also now require that all new, non-exempt students complete the matriculation process, which includes assessment. The colleges enforce this mandated assessment by not allowing students to enroll in an English or math class until they have completed an assessment. In addition, some colleges will continue to or start streamlining their matriculation/orientation process to help increase the number of students participating in the assessment process. In addition, LATTC will be using the same system, as the other colleges, to track the number of assessments completed with the implementation of the new student information system. Measure Percentage of New Students Completing Orientation College Year Change City N/A N/A N/A 47% 64% 17% East N/A N/A N/A 64% 74% 10% Harbor N/A N/A N/A 60% 78% 18% Mission N/A N/A N/A 51% 72% 21% Pierce N/A N/A N/A 56% 72% 16% Southwest N/A N/A N/A 78% 84% 6% Trade N/A N/A N/A 52% 76% 24% Valley N/A N/A N/A 53% 65% 12% West N/A N/A N/A 77% 78% 1% District N/A N/A N/A 58% 72% 14% Page 7
14 Summary of Findings. LACCD saw overall increases over the past year in the percentages of new students completing orientation. In 2015, approximately 72% of new students participated in an orientation session. Districtwide, the percentage has increased by 14% since Los Angeles Trade-Technical College (LATTC) and Los Angeles Mission College (LAMC) saw the greatest improvements in the percentage of students completing the orientation process, 24% and 21% respectively. Some colleges have recognized that they did not initially have sufficient resources and that students did not have clear pathways to the services and resources they needed. However, since 2014, many colleges implemented new matriculation processes that have been more publicized and accessible for new students. For example, LATTC has an online orientation available to students with several videos and quizzes that provide valuable information about programs and services available. It is important to note that in prior years, data regarding the number of students attending or participating in an orientation were not tracked, as it was not a requirement for new students. College Plans for Improvement. Attending a college orientation is an essential way to give students the right start to their college experience. The orientation process, whether done online or in person, often provides useful information about academic programs and services to help students be successful and navigate their college career more skillfully. To further encourage students to participate in orientation, the colleges do not provide priority registration for those students who have not completed the AOC (Assessment-Orientation- Counseling) process, which includes orientation. In addition, colleges will continue to track and monitor their participation rates in orientation. Measure Percentage of New Students Creating an Academic Plan College Year Change City N/A N/A N/A 60% 73% 13% East N/A N/A N/A 69% 73% 4% Harbor N/A N/A N/A 66% 79% 13% Mission N/A N/A N/A 60% 80% 20% Pierce N/A N/A N/A 63% 77% 14% Southwest N/A N/A N/A 78% 84% 6% Trade N/A N/A N/A 63% 81% 18% Valley N/A N/A N/A 68% 73% 5% West N/A N/A N/A 79% 82% 3% District N/A N/A N/A 66% 77% 11% Summary of Findings. LACCD saw overall increases over the past year in the percentages of new students creating an academic plan. In 2015, approximately 77% of new students visited a counselor and created an academic plan. Districtwide, the percentage has increased by 11% since Los Angeles Mission College and Los Angeles Trade-Technical College saw the greatest improvements in this area, 20% and 18%, respectively. Los Angeles Southwest and West Los Angeles Colleges had the highest percentages of new students creating academic plans, 84% and 82% respectively. It is important to note that in prior years, data regarding the number of students creating academic plan, like the number of student participating in orientation, were not tracked, as it was not a requirement for new students. Page 8
15 College Plans for Improvement. Creating an academic plan is essential for students to ensure that they have defined pathways to achieve their educational goals. Counselors help students define their goals and develop academic plans that outlines courses that students should consider taking in their first semester. To further encourage students to participate in counseling before their first semester, the colleges do not provide priority registration for those students who have not completed the AOC (Assessment-Orientation-Counseling) process, which includes attending an individual counseling appointment. In addition, colleges will continue to track and monitor their participation rates in counseling. Goal 1, Objective 2 Conclusion. Ensuring that students complete English and math assessments, participate in orientation, and attend a counseling appointment (the A-O-C process) is a crucial part of completing the matriculation process. LACCD has been active in ensuring that students complete A-O-C services before or within their first term. These efforts are evidenced by increases in the proportion of assessments, orientations, and counseling sessions completed by new students in LACCD colleges will continue their efforts to provide information to students, make the assessment process easier, and streamline the orientation process at various campuses, which has been integral to ensuring new students complete their assessments and matriculation. Completing the matriculation process by the first term will also help student gain momentum towards achieving their educational goals. Objective 3: Increase the percentage of new students successfully completing at least one English and Math class in their first year and persisting to subsequent terms. Measure 1: Percentage of new students successfully completing at least one English and math class in their first year Measure 2: Persistence (Fall to Spring and Fall to Fall) Measure Percentage of New Students Successfully Completing at Least One English and Math Class in their First Year College Year Change City 15% 14% 17% 22% 27% 12% East 16% 17% 22% 27% 29% 13% Harbor 15% 12% 20% 29% 31% 16% Mission 15% 14% 13% 17% 22% 7% Pierce 23% 22% 23% 27% 26% 3% Southwest 11% 13% 15% 20% 24% 13% Trade 11% 10% 8% 9% 13% 2% Valley 21% 21% 28% 33% 30% 9% West 18% 18% 18% 24% 26% 8% District 17% 17% 19% 24% 26% 9% Page 9
16 Summary of Findings. LACCD saw overall increases in the percentages of new students successfully completing at least one English and math class in their first year. Since 2011, this percentage has increase by 9% and approximately 26% of new students in 2015 have completed at least one English and math class within their first year. Los Angeles Harbor College (LAHC) experienced the greatest increase of successful completions from 2011 to 2015; this success may be partly due to the Harbor Advantage (HA) program created at LAHC. HA guarantees first-time college students an English and math class in their first two semesters of enrollment. Colleges with more modest gains of successful completion rates may be partially due to the student population. For example, at Los Angeles Mission College (LAMC) many students (75%) are part time and only take one or two courses per term. LAMC also found that many new students do not have priority registration and are unable to enroll in the English and math classes needed. College Plans for Improvement. Although increases in successful completion of English and math classes rose from 2011 to 2015, many colleges plan to continue to or increase awareness of the assessment process so that students are able to enroll in the appropriate English and math classes. Some colleges, like East Los Angeles College and LAMC, are reinstating and/or increasing the number of courses available to students. LAMC and West Los Angeles Colleges are also considering ways to give priority to students who complete the matriculation process. These plans will help students gain access to and complete English and math courses in their first year at LACCD. In addition to college s plans for improvement, it may be sensible to consider reporting additional metrics in order to accurately capture the percentage of new students who complete an English and math class in their first year. It was noted by several colleges that many times the lowest levels of English and math are listed in the Noncredit Department, and not in English or Math Departments. This could mean, for example, that a student may complete a noncredit Basic Skills English or math course into which they assessed, but would not be counted as a student enrolled in and/or completed an English or math class in their first year. Reporting percentages of students who completed a credit or a noncredit English and math course in their first year may help more accurately capture this metric. Measure 1.3.2a Persistence Fall to Spring College Year Change City 86% 87% 85% 85% 86% 0% East 91% 91% 91% 92% 92% 1% Harbor 88% 89% 91% 91% 91% 3% Mission 83% 84% 83% 88% 88% 5% Pierce 88% 90% 89% 90% 90% 2% Southwest 79% 83% 87% 85% 79% 0% Trade 79% 79% 82% 82% 82% 3% Valley 85% 86% 87% 87% 89% 4% West 81% 83% 84% 84% 88% 7% District 86% 87% 87% 88% 89% 3% Page 10
17 Measure 1.3.2b Persistence Fall to Fall College Year Change City 70% 72% 72% 72% 72% 2% East 81% 80% 78% 80% 79% 2% Harbor 75% 75% 76% 76% 77% 2% Mission 70% 75% 73% 75% 75% 5% Pierce 78% 79% 79% 78% 78% 0% Southwest 56% 69% 66% 68% 63% 7% Trade 64% 65% 67% 65% 65% 1% Valley 76% 76% 77% 76% 76% 0% West 63% 68% 70% 65% 69% 6% District 74% 75% 75% 75% 75% 1% Summary of Findings. LACCD overall saw modest increases in persistence from Fall to Spring and Fall to Fall. In 2015, approximately 89% of new students persisted from Fall to Spring, which was an increase of 3% since In addition, about 75% persisted from Fall to Fall, which increased from 2011 by 1%. East Los Angeles College (ELAC) is the most consistently strong in this measure and since 2011 has regularly experience Fall to Spring persistence rates of above 90% and near 80% for persistence from Fall to Fall. ELAC credits their success to regular evaluations on persistence, which serve as a target for intervention. West Los Angeles College (WLAC) has improved the most since 2011 and now has persistence rates that are more aligned with district averages. WLAC credits an increased focus on student success, including the Student Success Committee, Achieving the Dream Initiative, Student Equity, Access and Completion (SEAC) Committee, and the Student Equity Workgroup. In addition, WLAC has increased faculty engagement through Faculty Inquiry Groups (FIGs) and professional learning, which emphasizes engagement and cultural competence. College Plans for Improvement. Although small increases in persistence were found from 2011 to 2015, many colleges plan to continue their efforts to ensure that new students have a clear path to completion that is inclusive of completing an English and math course in their first year. Some colleges, like Los Angeles Mission College, will also re-examine sequencing to ensure that there are enough sections offered to accommodate all students that are prepared to take the next course in the sequence. In addition, efforts will be made to guide students towards programs that support student success and persistence, such as Los Angeles Southwest College s First Year Experience and Passage programs or Los Angeles Harbor College s Harbor Advantage program. Page 11
18 Goal 1, Objective 3 Conclusion. Ensuring that students complete an English and math course in their first year and persist to subsequent terms is essential to helping students attain early educational momentum and be successful in college. LACCD overall saw modest increases first-year English and math course completions and in persistence. Additional measures of persistence were also examined, including the California Community Colleges Chancellor's Office Data Mart 2 that reports the percentage of degree, certificate and/or transferseeking students enrolled in the first three consecutive terms (for students starting first time in ). The statewide proportion of students was 73.4%, while the LACCD district average was 70.8%. This finding, coupled with internal measures of persistence, suggest that LACCD is doing about average when compared to statewide persistent rates and should remain active in ensuring that students have clear pathways to completion and that colleges have programs aimed directly at increasing persistence among first-year students. Increasing knowledge and availability of assessments, along with helping with registration priority for new students may help LACCD increase the percentage of English and math courses completed by students in their first year. Supporting student programs, along with continual monitoring of persistence will allow LACCD to maintain and/or increase already high rates of persistence. Both objectives help students attain early educational momentum and complete their educational goals efficiently. 2 Page 12
19 GOAL 2 Teaching and Learning for Success Objective 1: Provide a learner-centered learning environment that encourages active learning and student engagement. Measure 1: Measure of active learning/project learning (from student survey) Measure of student engagement in and out of class (from student survey) Measure of self-efficacy/self-directed learning (from student survey) Measure 2: Measure of whether/how technology is being used to improve student learning and engagement (from student survey and District Employee Survey, which is to be developed) Measure 2.1.1a Measure of Active Learning/Project Learning College Year Change City 62% N/A 66% 4% East 68% N/A 71% 3% Harbor 68% N/A 70% 2% Mission 66% N/A 68% 2% Pierce 63% N/A 70% 7% Southwest 69% N/A 71% 2% Trade 63% N/A 71% 8% Valley 65% N/A 69% 4% West 63% N/A 68% 5% District 65% N/A 69% 4% Measure 2.1.1b Measure of Student Engagement In and Out of Class College Year Change City 19% N/A 17% 2% East 23% N/A 25% 2% Harbor 19% N/A 19% 0% Mission 16% N/A 15% 1% Pierce 24% N/A 18% 6% Southwest 22% N/A 21% 1% Trade 16% N/A 17% 1% Valley 20% N/A 16% 4% West 16% N/A 16% 0% District 20% N/A 19% 1% Page 13
20 Measure 2.1.1c Measure of Self-Efficacy/Self-Directed Learning College Year Change City 71% N/A 77% 6% East 77% N/A 80% 3% Harbor 73% N/A 80% 7% Mission 75% N/A 79% 4% Pierce 69% N/A 74% 5% Southwest 71% N/A 76% 5% Trade 71% N/A 78% 7% Valley 69% N/A 76% 7% West 69% N/A 76% 7% District 72% N/A 78% 6% Summary of Findings. LACCD overall saw modest increases in providing a learner-centered environment. Across the district, measures of active learning/project learning and self-efficacy/self-directed learning have increased from 2012 to 2014 by 4% and 6%, respectively. East Los Angeles College (ELAC), for example, found that the inclusion of student-centered interventions included in the College Educational Master Plan have helped engage students in active learning. In fact, nearly 70% of ELAC faculty has been trained on authentic assessments. As a result, 25% of the courses use some form of authentic or project-based learning. Although gains in active learning were seen in the classroom, the district s scores on student engagement in and out of class were low (20%) in 2012 and slightly decreased to 19% in Some schools, like Los Angeles Mission College (LAMC), have student populations that are not on campus frequently. At LAMC, 75% of student are part time and, therefore, are less likely to be engaged in campus activities; this college also lacks athletic and theater arts programs and facilities, which are often popular student activities. Other colleges have credited some of their success of student engagement to campus groups. ELAC, who scored above the district average, stated their Associated Student Union, Student Activities, Workforce Education & Economic Development, and Student Services offices regularly plan activities to engage students in and out of the classroom. In addition, students have the opportunity to participate in campus activities, community service, and social events through chartered campus clubs, and the presence of the Vincent Price Art Museum on campus provides students exposure to modern and contemporary art. It should also be noted that student engagement in and out of class may not have been accurately captured. The questions that measured engagement in the 2014 Student Survey only measured out of class engagement and does not account for the fact that such engagement is less available or unavailable at some campuses. For example, all the athletic programs were summarily cancelled at Los Angeles City College. This means the entire dimension of engagement in and out of the classroom was not entirely captured and that the results may have been skewed. College Plans for Improvement. Many colleges recognize the need for improved learning outcomes and student engagement in and out of the classroom. Los Angeles City College (LACC), for example, has recently hired a new Dean of Student Life who will be directing the college s overall effort to increase student engagement. The college will also be conducting a First Year Experience program that is designed to increase engagement among first-time college students. In addition, many of the colleges also plan to increase and promote student engagement activities (such as welcome week fairs/kickoff semester events and Page 14
21 career/transfer fairs and programs), and some campuses have new or updated facilities (such as the new Library and Learning Resources Center at Los Angeles Harbor College or the new Health Fitness Athletics Complex at LAMC). The new or updated facilities will make the environment more comfortable for students to study, work collaboratively, and spend more time on campus. Measure Measure of How Technology is Being Used to Improve Student Learning and Engagement College Year Change City N/A N/A 66% N/A East N/A N/A 68% N/A Harbor N/A N/A 67% N/A Mission N/A N/A 66% N/A Pierce N/A N/A 66% N/A Southwest N/A N/A 69% N/A Trade N/A N/A 63% N/A Valley N/A N/A 65% N/A West N/A N/A 66% N/A District N/A N/A 66% N/A Summary of Findings. LACCD recognizes the critical role that technology plays in helping student leaning and engagement. In 2014, the district average of how technology was being used to improve learning and engagement was 66%, with all colleges scoring between 63% and 69%. Some higher scoring colleges credit their success to their focus or heavy use of technology. For example, East Los Angeles College (ELAC) has 200 faculty members that have been certified to teach online using Études and more than 180 of faculty are actively using course management systems in their face-to-face classes. In addition, the number of online courses offered has increased and may have affected the rating of how technology is being used to improve student learning and engagement. For example, the number of online sections has increased at Los Angeles Harbor College (LAHC), and the percentage of students enrolled in only online classes has also increased by 4% since In addition, the new LAHC Library and Learning Resources Center has 140 computers available for students and 200 new computers were installed 5 discipline-specific labs across campus. College Plans for Improvement. Recognizing the critical role that technology plays today, many colleges have made a concerted effort to provide more online services for students, to communicate with students electronically, and to update the college computing infrastructure. Some colleges, like Los Angeles Southwest College (LASC), have hosted several professional development activities that have focused on using technology effectively to improve student success. LASC also recently opened 2 new classroom buildings that have dramatically increased the number of SMART classrooms on campus. West Los Angeles College, Los Angeles Mission College (LAMC), and ELAC also plan to expand SMART classroom technology on their campuses. Last, some colleges, like Los Angeles Trade-Technical College (LATTC), ELAC, and LAHC, are also using and increasing their use of social media to engage students and improve learning. Since LATTC s launch of its Facebook campaign in 2011 and ELAC s launch of their ELAC Schools App in 2015, students have been more readily able to connect with the school and one another; popularity and utilization of these interactive social networks has only increased with time. Page 15
22 Goal 2, Objective 1 Conclusion. Ensuring that students are provided with a positive environment that encourages active learning and student engagement is essential to student success. LACCD has recognized the importance of technology in helping meet these objectives and has been active in updating, maintaining, and identifying technology that may benefit its students. Because there is not a data from more recent years, it is challenging to determine how well the colleges are creating a learner-centered environment for their students. However, the increases in active/project learning and self-efficacy/self-directed learning indicate that the colleges effort to focus on the use of technology and professional development for faculty has been constructive. To better capture student learning environments it may be prudent to collect data at more regular intervals in order to get a more complete picture of active learning, student engagement, self-directed learning, and the use of technology to improve student learning and engagement. Objective 2: Increase the percentage of new students who have reached the following milestones within three and six years: successfully completing 30 and 60 units; successfully completing English 101 and Math 125; and earning a certificate, degree, or transferring to a 4-year college or university. Measure 1: Percentage of new student cohort successfully completing 30 and 60 units Measure 2: Percentage of new student cohort successfully completing English 101 and Math 125 Measure 3: Completion Rate (i.e., certificate, degree, or transfer) Measure 2.2.1a Percentage of New Student Cohort Completing 30 units in 3 Years College Year Change City 60% 59% 59% 60% 62% 2% East 61% 66% 66% 65% 64% 3% Harbor 58% 60% 61% 65% 65% 7% Mission 55% 55% 57% 57% 55% 0% Pierce 66% 68% 70% 69% 66% 0% Southwest 38% 46% 41% 56% 57% 19% Trade 50% 53% 58% 59% 62% 12% Valley 58% 61% 63% 65% 67% 9% West 51% 53% 52% 53% 57% 6% District 59% 61% 62% 63% 63% 4% Page 16
23 Measure 2.2.1b Percentage of New Student Cohort Completing 60 units in 3 Years College Year Change City 26% 26% 26% 27% 28% 2% East 30% 32% 33% 32% 30% 0% Harbor 24% 21% 28% 26% 26% 2% Mission 24% 23% 25% 24% 25% 1% Pierce 34% 34% 35% 32% 31% 3% Southwest 14% 17% 15% 21% 24% 10% Trade 22% 23% 25% 24% 30% 8% Valley 27% 30% 32% 30% 33% 6% West 18% 17% 19% 21% 26% 8% District 27% 28% 30% 29% 29% 2% Summary of Findings. LACCD overall saw modest increases in the percentage of new student cohorts successfully completing 30 and 60 units. In 2015, approximately 63% of students completed 30 units in 3 years, which was an increase of 4% since In addition, about 29% of the new student cohort completed 60 units in 3 years, which increased from 2011 by 2%. These milestones are difficult for some colleges to meet simply because of their student population or the structure of the programs offered. For example, some colleges have high rates of unprepared students that require remediation, which means it would take longer for students to meet these milestones and complete their educational goals. Los Angeles Southwest College (LASC) has one of the highest percentages of unprepared students in the LACCD (93%). Coupled with this issue is the fact that approximately 80% of LASC students attend college part time. As a result, unit accumulation and progress through English and math sequences occurs more slowly. It is also possible that students may achieve their educational goals before reaching the 30-unit milestone. At Los Angeles Trade-Technical College (LATTC), for example, there are over 25 credits, CCCCO 3 -approved certificates that have completion requirements of units. Thus, for students in these programs there is no need to complete 30 units. College Plans for Improvement. Although LACCD experienced increases in completion of 30 and 60 unit milestones, many colleges plan to continue their efforts to restructure college pathways to promote cohorts, directed choices, and embedded counseling. In addition, efforts will be made to guide students towards programs that support student success and persistence, such as Los Angeles Southwest College s First Year Experience and Passage programs or East Los Angeles College s (ELAC) First Year Completion program. Los Angeles Mission College (LAMC) also found that students receiving Pell Grants were far more likely to attain these unit thresholds within 3 years than students receiving no financial aid or receiving only a California Community Colleges Board of Governors (BOG) Fee Waiver. At LAMC they are planning to continue efforts to increase Pell Grant recipients, though events like the Fall Kickoff. ELAC, who is above the district average, has a strategic enrollment process that allows departments to schedule those courses most necessary for student completion; they will continue to work with departments in scheduling classes in a manner that best meets the students needs and promotes completion; this process allows for effective student enrollment. 3 California Community Colleges Chancellor's Office Page 17
24 Measure 2.2.2a Percentage of New Student Cohort Completing English 101 & Math 125 (or above) in 3 Years College Year Change City 20% 17% 18% 19% 21% 1% East 23% 26% 28% 28% 29% 6% Harbor 23% 20% 25% 20% 26% 3% Mission 23% 21% 23% 24% 24% 1% Pierce 32% 35% 36% 32% 32% 0% Southwest 10% 14% 14% 21% 23% 13% Trade 11% 11% 15% 12% 17% 6% Valley 27% 28% 30% 31% 33% 6% West 13% 14% 16% 17% 22% 9% District 23% 24% 26% 26% 28% 5% Measure 2.2.2b Percentage of New Student Cohort Completing English 101 & Math 125 (or above) in 6 Years College Year Change City 28% 30% 30% 30% 26% 2% East 32% 36% 35% 33% 37% 5% Harbor 35% 33% 27% 29% 29% 6% Mission 33% 31% 29% 32% 31% 2% Pierce 40% 44% 42% 40% 44% 4% Southwest 11% 15% 17% 16% 23% 12% Trade 13% 18% 15% 16% 18% 5% Valley 36% 36% 38% 36% 38% 3% West 17% 20% 19% 17% 20% 3% District 31% 34% 33% 31% 34% 3% Summary of Findings. LACCD overall saw modest increases in the percentage of new student cohorts successfully completing English 101 and Math 125 in 3 and 6 years. In 2015, approximately 28% of students completed English 101 and Math 125 in 3 years, which was an increase of 5% since In addition, about 34% completed English and math requirements in 6 years, which was an increase of 3% since As with unit thresholds, these milestones are difficult for some colleges to meet simply because of their part-time student population or the structure of the programs offered (i.e., some programs do not require English and math courses). For example, at Los Angeles Trade-Technical College (LATTC), the students primarily take career and technical education (CTE) courses, and CTE certificates do not require English 101 or Math 125 courses. In addition to these issues, some colleges have high rates of students that require remediation, which often extends the time it takes to complete English 101 and Math 125 (or above) requirements. At Los Angeles Mission College (LAMC), for example, 82% of students place into courses that are below English 101 and 70% place into courses that are below Math 125. Page 18
25 College Plans for Improvement. The LACCD experienced increases in completion of English 101 and Math 125 requirements in 3 and 6 years. However, many colleges plan to continue to work on aligning courses with student goals and continue curriculum development to shorten pathways to completion of English and math sequences. For example, the Los Angeles Harbor College math faculty has recently created new, shorter math pathways for non-stem majors. At LAMC they deployed an English Pilot Program where students concurrently enroll in English 21 & 28 or English 28 & 101 in the same semester classes with coordinated content and a single instructor so that sequences can be accelerated and students can start college-level English coursework. Many schools are also concentrating their efforts on promoting and increasing enrollment into first year experience programs, which focus on helping students make informed decisions and complete important educational milestones. It may also be necessary to reconsider this benchmark that may not capture the amount of students that are meeting graduation requirements. For example, at LAMC, there are new math courses and sequences (e.g., Math 123A/B/C and Math 129A/B) that are alternative pathways that provides transfer-level Math, which are growing in popularity and were not included in the calculation of this measure. Measure 2.2.3a Completion Rate (i.e., certificate, degree or transfer) in 3 Years College Year Change City 11% 7% 7% 8% 11% 0% East 14% 12% 13% 12% 14% 0% Harbor 14% 12% 16% 14% 16% 2% Mission 12% 11% 8% 8% 12% 0% Pierce 22% 21% 17% 13% 20% 2% Southwest 8% 9% 8% 13% 17% 9% Trade 13% 10% 12% 12% 16% 3% Valley 14% 15% 13% 11% 17% 3% West 15% 15% 11% 12% 14% 1% District 15% 14% 13% 12% 16% 1% Measure 2.2.3b Completion Rate (i.e., certificate, degree or transfer) in 6 Years College Year Change City 30% 30% 29% 24% 24% 6% East 33% 34% 32% 28% 32% 1% Harbor 34% 37% 28% 32% 31% 3% Mission 30% 27% 26% 28% 28% 2% Pierce 46% 46% 41% 38% 43% 3% Southwest 16% 22% 22% 19% 25% 9% Trade 29% 29% 26% 25% 23% 6% Valley 39% 36% 35% 30% 36% 3% West 28% 30% 30% 26% 28% 0% District 35% 35% 33% 30% 33% 2% Page 19
26 Summary of Findings. The LACCD saw little change in the percentage of students who completed their program--a certificate, degree, or a transfer to a 4-year college--in 3 and 6 years. In 2015, 16% of students completed their program in 3 years, which was an increase of only 1% since The percentage of students who completed their program in 6 years actually decreased (by 3% since 2011) to 33% in This finding is not all to surprising considering the student populations at the various colleges. Los Angeles Southwest College (LASC), who scores low on these metrics, has a high percentage of students who attend college part time (80%). An internal analysis at Los Angeles City College (LACC) found that 40% of completers take more than 6 years to complete their programs, which means that that 40% of all degrees and certificates awarded are not counted in completion statistics for the college. Budget cuts also necessitated that many courses be dropped. West Los Angeles College (WLAC), for example, responded to the budget crisis rapidly and eliminated summer and winter class offerings. These budget cuts made it more difficult for students to complete requirements and many are still in the pipeline waiting to complete various courses and course sequences. In addition, some colleges, like WLAC, do not have the adequate facilities for current campus programs in Computer Science, Business, Theater, Motion Picture Television Production, Dance, and Aviation Maintenance Technology. At the WLAC campus, for example, there are computer labs that are not appropriately air conditioned. College Plans for Improvement. The colleges will employ multiple strategies to address the low completion rates in 3- and 6-year timeframes. Starting with matriculation and first year experience efforts, the colleges will assure that all new students are assessed, referred, and/or enrolled into first year experience (FYE) programs, like Los Angeles Harbor College s Harbor Advantage and LASC s Passages programs. Programs like these, in addition to counseling departments, help increase the amount of information provided to students about completion options and how to best accomplish their goals. The Counseling Department at Los Angeles Mission College (LAMC), for example, will continue to identify, seek out, and counsel students who have accumulated more than 50 units to complete their degrees or transfer. There will also be a focus on course allocations and support services to facilitate student completion of degrees, certificates, and transfers. For example, LAMC is now offering more sections, with an increased focus on sequencing so students can complete their requirements more quickly, and they have added 9 new Associate Degrees for Transfer, which should also increase degree and transfer rates. LACC has also recently created 14 Associate Degrees for Transfer that will help students identify their completion path while in their FYE program. It is also important to consider the student populations and their goals at the various LACCD campuses. For many students attending part time it may not be a realistic goal to complete a program in a 3- or 6-year timeframe. Because completion rates are not tracked at or beyond the 6-year threshold, there is no way to see how many students actually complete their educational goals. This may mean that the completion rates may be underreported, especially at campuses like LAMC that stopped recording the number of Skills Certificates awarded in Fall 2009, even though certificates are still being awarded. Page 20
27 Goal 2, Objective 2 Conclusion. The LACCD plays an active role in helping students attain their goals of certificate completion, degree completion, transfer, job training, and/or career placement. The district has experienced modest increases in the percentage of new students who have successfully completed 30 and 60 units within 3 year and who have successfully completed English 101 and Math 125 within 3 and 6 years. However, there the completion of LACCD students appears to be low and stagnant. To corroborate these findings additional data from the California Community Colleges Chancellor's Office (CCCCO) Data Mart 4 was examined. The data showed that the statewide percentage of student who achieved at least 30 units in 6 years (for first-time student starting in through academic year) was 67.6%, compared to the LACCD average of 63.9%. The CCCCO also reports that LACCD s percentage of degree, certificate and/or transfer-seeking students who completed their program in 6 years was 37.6% (for first-time student starting in through academic year), which was lower than the statewide average of 47.1%. These findings may be partially due to the LACCD student population that are mostly attending school part time, often require remediation, and many times enroll in programs that do not have English 101, Math 125, or 30- unit minimum requirements. This means that these metrics can be improves to better track students progress through their program. Baseline calculation methodology should be re-examined to account for program completers that did not take English 101 or Math 125, program completers who are enrolled in programs requiring less than 30 units, and completers who finish their program in more than 6 years. Objective 3: Increase the number of students who complete career-focused certificates in a timely manner, find employment in high growth/high earning occupations, or realize higher earnings as a result of their educational experience. Measure 1: Number of certificates awarded Measure 2: On-time program completion rate Measure 3: Student success scorecard skill builder metric Measure Number of Certificates Awarded College Year Change City East 874 1,058 1,099 1,253 1, Harbor Mission Pierce , Southwest Trade 666 1,116 1,225 1,359 1, Valley , West District 3,682 4,585 5,185 5,936 8,400 4, Page 21
28 Summary of Findings. LACCD saw an increase in the number of certificates awarded since In 2015, the District awarded 8,400 Chancellor s Office Approved Certificates, which is more than double the amount of certificates earned by students in This increase is due to an increase in the number and types of certificate programs offered at the colleges. The colleges have focused on ensuring that programs are current and relevant and offer a high value for students. It should also be noted that the number of certificates earned is not a count of individual students, but reflects the number of certificates awarded, as students may earn multiple certificates in their chosen area of study. College Plans for Improvement. The LACCD colleges will continue to review their certificate programs regularly in order to provide the community with curriculum that offers the most up-to-date skills and information needed by students to start a new career or advance in their current profession. Measure 2.3.2a Graduation Rates of Full-Time, First-Time, Degree/Certificate-Seeking Undergraduates with 150% of Normal Time to Completion College Year Change City 15% 12% 14% 17% 19% 4% East 29% 21% 28% 30% 34% 5% Harbor 19% 13% 19% 22% 21% 2% Mission 12% 14% 12% 16% 19% 7% 7Pierce 23% 26% 27% 28% 27% 4% Southwest 6% 7% 10% 15% 12% 6% Trade 16% 15% 19% 21% 26% 10% Valley 17% 18% 18% 21% 28% 11% West 12% 13% 13% 16% 20% 8% District 17% 15% 18% 21% 23% 6% Measure 2.3.2b Median Time to Degree College Year Change City East Harbor Mission Pierce Southwest Trade Valley West District Page 22
29 Summary of Findings. The LACCD saw an increase in the proportion of graduation rates of full-time, first-time, degree/certificate-seeking undergraduate students who finished their program within 150% of the normal time to completion. In 2015, 23% of students finished within 150% of the normal time; this proportion increased by 6% since East Los Angles College (ELAC) has the highest proportion of students completing within 150% of normal time, 34%. Los Angeles Trade-Technical College and Los Angeles Valley College, since 2011, have experienced the greatest increases in these rates, 10% and 11% respectively. To further explore on-time completion rates, Measure 2.3.2b shows the median number of years from the time of a student s first enrollment in an LACCD college until the time they receive an AA, AS, or ADT degree. As seen in the table, the median time to completion in the District has been consistent, 4.4 years. In 2015, West Los Angeles College had the lowest time to degree, 3.4 years, and has improved this rate by.5 years since College Plans for Improvement. The LACCD colleges will continue to improve the A-O-C (Assessment- Orientation-Counseling) process that will help students have the right start to their college experience and give them a clear path to obtain their academic goals as efficiently as possible. Giving students a pathway to follow and concrete recommendations of courses that are essential to take early will help students stay on track, allowing them to accomplish their academic goals efficiently. In addition to enhancing the A-O-C process, the implementation of the Los Angeles College Promise Program (LACP), which will offer students in Los Angeles County a free year of community college, may also help increase the number of students that are attending full time, which will decrease the median time to completion. Measure Student Success Scorecard Skill Builder Metric College Year Change City 19.9% 37.8% 34.0% N/A N/A 14.1% East 4.2% 3.5% 11.4% N/A N/A 7.2% Harbor 15.2% 16.4% 30.7% N/A N/A 15.5% Mission 6.6% 10.5% 18.8% N/A N/A 12.2% Pierce 11.9% 18.5% 29.8% N/A N/A 17.9% Southwest 3.7% 2.0% 14.6% N/A N/A 10.9% Trade 13.0% 16.9% 22.9% N/A N/A 9.9% Valley 12.9% 13.9% 26.0% N/A N/A 13.1% West 8.2% 12.7% 22.6% N/A N/A 14.4% District 8.2% 8.0% 18.5% N/A N/A 10.3% Summary of Findings. The Skill Builder Metric displays the median percentage salary increase in wages for students who completed higher level CTE coursework in a given cohort year and left the system without receiving any type of traditional outcome, such as transfers to a four-year college or completion of a degree or certificate. This is a fairly new state metric, so data were not available for cohorts after the academic year. However, the data show that there has been an increase in the median percentage of wages for students who completed higher level CTE coursework since 2011; the percentage has increased by 10.3% and was 18.5% in cohort year Page 23
30 College Plans for Improvement. The colleges plan to focus on increasing educational opportunities for students in adult education programs. In partnership with the Los Angeles Regional Education Consortium, the LACCD has been working to evaluate the current needs for the various types of adult education programs offered, identify gaps in types in programs available, and working towards addressing those gaps identified. It will be important to continue to track this new skill builder metric, reported on the student success scorecard, and evaluate it as more data become available. Goal 2, Objective 3 Conclusion. The LACCD has been able to increase the number of students who complete career-focused certificates in a timely manner and help students realize higher earnings as a result of their educational experience at our colleges. As the results show, the number of certificates awarded by LACCD has increased dramatically since In 2015, 8,400 certificates were awards across the nine colleges. Not only has there been an increase in the number of students who completed certificates, but the time to completion has also improved. In fact, 23% of students who were full-time, first-time degree/certificate-seeking students graduated within 150% of normal time to completion; this rate has increased by 6% since The results suggest that LACCD is meeting its objective to increase the number of students who complete career-focused certificates in a timely manner. Objective 4: Increase equity in successful outcomes by identifying achievement gaps and increasing performance of under-performing groups. Measure 1: Percentage of new student cohort successfully completing 30 and 60 units by age, gender, ethnicity, and low-income status Measure 2: Percentage of new student cohort successfully completing English 101 and Math 125 by age, gender, ethnicity, and low-income status Measure 3: Completion Rate (i.e., certificate, degree, or transfer) by age, gender, ethnicity, and lowincome status Measure 4: Number of certificates awarded by age, gender, ethnicity, and low-income status Measure 2.4.1a Percentage of New Student Cohort Completing 30 units in 3 Years By Age District Year Change Under 20 62% 64% 65% 65% 65% 3% % 47% 48% 51% 50% 5% % 50% 56% 60% 59% 7% 35 and Over 53% 61% 62% 68% 67% 14% Total 59% 61% 62% 63% 63% 4% Page 24
31 Measure 2.4.1b Percentage of New Student Cohort Completing 60 units in 3 Years By Age District Year Change Under 20 29% 30% 32% 30% 31% 2% % 18% 19% 19% 20% 1% % 22% 24% 25% 25% 3% 35 and Over 24% 29% 32% 26% 28% 4% Total 27% 28% 30% 29% 29% 2% Measure 2.4.1c Percentage of New Student Cohort Completing 30 units in 3 Years By Gender District Year Change Female 60% 62% 64% 66% 65% 5% Male 57% 60% 61% 61% 61% 4% Total 59% 61% 62% 63% 63% 4% Measure 2.4.1d Percentage of New Student Cohort Completing 60 units in 3 Years By Gender District Year Change Female 28% 29% 31% 31% 31% 3% Male 26% 26% 28% 26% 27% 1% Total 27% 28% 30% 29% 29% 2% Measure 2.4.1e Percentage of New Student Cohort Completing 30 units in 3 Years By Ethnicity District Year Change Asian 71% 74% 74% 76% 76% 5% Black 44% 48% 48% 53% 54% 10% Hispanic 56% 59% 59% 60% 59% 3% White 67% 69% 73% 73% 74% 7% American Indian/ Other Non-White 69% 69% 67% 63% 58% 11% Unknown/ Declined to State 62% 63% 65% 62% 62% 0% Total 59% 61% 62% 63% 63% 4% Page 25
32 Measure 2.4.1f Percentage of New Student Cohort Completing 60 units in 3 Years By Ethnicity District Year Change Asian 41% 43% 46% 45% 44% 3% Black 17% 17% 19% 21% 22% 5% Hispanic 23% 24% 25% 25% 25% 2% White 37% 37% 39% 34% 37% 0% American Indian/ Other Non-White 34% 35% 30% 28% 30% 4% Unknown/ Declined to State 29% 29% 30% 28% 29% 0% Total 27% 28% 30% 29% 29% 2% Measure 2.4.1g Percentage of New Student Cohort Completing 30 units in 3 Years By Financial Aid (Low-Income) Status District Year Change Receiving No Financial Aid 56% 61% 61% 65% 63% 7% Receiving BOG Waiver only 52% 51% 53% 55% 57% 5% Receiving Pell Grant (w/ BOGW) 65% 65% 66% 65% 65% 0% Total 59% 61% 62% 63% 63% 4% Measure 2.4.1h Percentage of New Student Cohort Completing 60 units in 3 Years By Financial Aid (Low-Income) Status District Year Change Receiving No Financial Aid 26% 28% 29% 30% 29% 3% Receiving BOG Waiver only 21% 19% 21% 22% 24% 3% Receiving Pell Grant (w/ BOGW) 33% 32% 32% 30% 32% 1% Total 27% 28% 30% 29% 29% 2% Summary of Findings. To help identify achievement gaps, the percentage of new students successfully completing 30 and 60 units was examined by age, gender, ethnicity, and low-income/financial aid status. Although the LACCD experienced modest increases overall in these two measures, the data show that older students (35 and over) saw the greatest increases in the percentage of students who completed 30 units in 3 years. In 2011, 53% of students 35 and over completed 30 units in 3 years. By 2015, this figure rose to 67%, which is a rate that surpasses all of the younger age groups. When examining differences by ethnicity, most Page 26
33 groups have rates that are increasing. However, the data show that the percentage of Black students completing 30 units in 3 years grew by 10% since Conversely, the percentage of American Indian/Other Non-white students who completed 30 units in 3 years decreased by 11% in the same time period. No large differences were observed between gender and financial aid status. College Plans for Improvement. Although LACCD experienced increases in completion of 30 and 60 unit milestones, many colleges plan to continue their efforts to ensure equity in successful student outcomes. Programs, such as first year experience programs, will help support student success and persistence. These programs, which help promote directed choices and embed counseling services, will continue to help identify the appropriate resources and services for students, with the expressed goal to increase equity in successful student outcomes. Measure 2.4.2a Percentage of New Student Cohort Completing English 101 & Math 125 (or above) in 3 Years By Age District Year Change Under 20 27% 27% 30% 29% 31% 4% % 16% 16% 15% 17% 3% % 14% 13% 19% 18% 6% 35 and Over 4% 6% 7% 8% 8% 4% Total 23% 24% 26% 26% 28% 5% Measure 2.4.2b Percentage of New Student Cohort Completing English 101 & Math 125 (or above) in 6 Years By Age District Year Change Under 20 35% 37% 37% 36% 37% 2% % 27% 23% 21% 24% 1% % 22% 17% 20% 22% 3% 35 and Over 14% 16% 15% 10% 16% 2% Total 31% 34% 33% 31% 34% 3% Measure 2.4.2c Percentage of New Student Cohort Completing English 101 & Math 125 (or above) in 3 Years By Gender District Year Change Female 24% 25% 27% 26% 28% 4% Male 23% 23% 26% 25% 27% 4% Total 23% 24% 26% 26% 28% 5% Page 27
34 Measure 2.4.2d Percentage of New Student Cohort Completing English 101 & Math 125 (or above) in 6 Years By Gender District Year Change Female 32% 34% 33% 33% 35% 3% Male 30% 34% 32% 30% 32% 2% Total 31% 34% 33% 31% 34% 3% Measure 2.4.2e Percentage of New Student Cohort Completing English 101 & Math 125 (or above) in 3 Years By Ethnicity District Year Change Asian 37% 39% 45% 42% 46% 9% Black 11% 11% 13% 16% 16% 5% Hispanic 20% 21% 23% 23% 25% 5% White 30% 31% 34% 31% 35% 5% American Indian/ Other Non-White 30% 26% 28% 25% 23% 7% Unknown/ Declined to State 25% 25% 23% 22% 23% 2% Total 23% 24% 26% 26% 28% 5% Measure 2.4.2f Percentage of New Student Cohort Completing English 101 & Math 125 (or above) in 6 Years By Ethnicity District Year Change Asian 44% 48% 45% 44% 49% 5% Black 15% 15% 15% 15% 17% 2% Hispanic 28% 31% 30% 29% 32% 4% White 40% 42% 40% 39% 39% 1% American Indian/ Other Non-White 39% 44% 40% 38% 40% 1% Unknown/ Declined to State 30% 37% 38% 34% 35% 5% Total 31% 34% 33% 31% 34% 3% Page 28
35 Measure 2.4.2g Percentage of New Student Cohort Completing English 101 & Math 125 (or above) in 3 Years By Financial Aid (Low-Income) Status District Year Change Receiving No Financial Aid 25% 28% 30% 31% 33% 8% Receiving BOG Waiver only 18% 18% 23% 23% 24% 6% Receiving Pell Grant (w/ BOGW) 24% 23% 25% 23% 26% 2% Total 23% 24% 26% 26% 28% 5% Measure 2.4.2h Percentage of New Student Cohort Completing English 101 & Math 125 (or above) in 6 Years By Financial Aid (Low-Income) Status District Year Change Receiving No Financial Aid 35% 35% 33% 33% 38% 3% Receiving BOG Waiver only 23% 28% 26% 25% 27% 4% Receiving Pell Grant (w/ BOGW) 33% 36% 35% 33% 33% 0% Total 31% 34% 33% 31% 34% 3% Summary of Findings. To help identify achievement gaps, the percentage of new students successfully completing English 101 and Math 125 (or higher) in 3 and 6 years was examined by age, gender, ethnicity, and low-income/financial aid status. The District experienced modest increases overall in these two measures and similar percentage rate increases were observed across age, gender, ethnicity, and financial aid status. Although all age groups improved in completing English 101 and Math 125, the youngest age group (20 and under) had the highest percentage of new students completing these two courses (31% in 3 years and 37% in 6 years) when compared to the other age groups. For example, only 8% of students 35 and older completed these courses in 3 years. When examining ethnic groups, declines in the percentage of new students completing English 101 and Math 125 were observed among American Indian/Other Non-White (-7%) and unknown/declined to state (-2%) groups; however, these declines were small (2% since 2011) and the percentages are comparable to Black and Hispanic ethnic groups. College Plans for Improvement. LACCD experienced increases in completion of English 101 and Math 125 (or above) requirements in 3 and 6 years, and comparable increases in these rates were observed across age, gender, and low-income/financial aid status. To continue this positive trend, many colleges have started to align courses with student goals and continue curriculum development to shorten pathways to completion of English and math sequences. In addition, the District Student Equity Plan has focused on increasing services to Black and Hispanic groups, who lag behind other groups on various student success measures, including the completion of English 101 and Math 125 (or above) courses in 3 and 6 years. Page 29
36 Measure 2.4.3a Completion Rate (i.e., certificate, degree or transfer) in 3 Years By Age District Year Change Under 20 17% 15% 15% 12% 17% 0% % 8% 8% 10% 9% 1% % 8% 9% 9% 11% 2% 35 and Over 11% 8% 6% 9% 9% 2% Total 15% 14% 13% 12% 16% 1% Measure 2.4.3b Completion Rate (i.e., certificate, degree or transfer) in 6 Years By Age District Year Change Under 20 38% 38% 35% 33% 35% 3% % 28% 23% 20% 23% 4% % 28% 24% 21% 21% 4% 35 and Over 27% 27% 26% 22% 23% 4% Total 35% 35% 33% 30% 33% 2% Measure 2.4.3c Completion Rate (i.e., certificate, degree or transfer) in 3 Years By Gender District Year Change Female 15% 14% 13% 12% 17% 2% Male 15% 13% 13% 11% 15% 0% Total 15% 14% 13% 12% 16% 1% Measure 2.4.3d Completion Rate (i.e., certificate, degree or transfer) in 6 Years By Gender District Year Change Female 36% 36% 34% 31% 34% 2% Male 34% 35% 31% 29% 30% 4% Total 35% 35% 33% 30% 33% 2% Page 30
37 Measure 2.4.3e Completion Rate (i.e., certificate, degree or transfer) in 3 Years By Ethnicity District Year Change Asian 22% 21% 20% 17% 24% 2% Black 12% 13% 11% 12% 16% 4% Hispanic 11% 10% 9% 9% 12% 1% White 23% 23% 21% 17% 26% 3% American Indian/ Other Non-White 24% 14% 14% 9% 9% 15% Unknown/ Declined to State 19% 14% 13% 11% 15% 4% Total 15% 14% 13% 12% 16% 1% Measure 2.4.3f Completion Rate (i.e., certificate, degree or transfer) in 6 Years By Ethnicity District Year Change Asian 46% 48% 41% 39% 48% 2% Black 26% 26% 26% 24% 27% 1% Hispanic 29% 29% 27% 25% 27% 2% White 47% 49% 46% 41% 43% 4% American Indian/ Other Non-White 51% 50% 46% 43% 42% 9% Unknown/ Declined to State 39% 42% 37% 33% 33% 6% Total 35% 35% 33% 30% 33% 2% Measure 2.4.3g Completion Rate (i.e., certificate, degree or transfer) in 3 Years By Financial Aid (Low-Income) Status District Year Change Receiving No Financial Aid 16% 15% 15% 14% 18% 2% Receiving BOG Waiver only 13% 11% 11% 10% 15% 2% Receiving Pell Grant (w/ BOGW) 16% 14% 12% 11% 15% 1% Total 15% 14% 13% 12% 16% 1% Page 31
38 Measure 2.4.3h Completion Rate (i.e., certificate, degree or transfer) in 6 Years By Financial Aid (Low-Income) Status District Year Change Receiving No Financial Aid 36% 35% 31% 30% 34% 2% Receiving BOG Waiver only 29% 31% 28% 25% 29% 0% Receiving Pell Grant (w/ BOGW) 39% 39% 38% 33% 33% 6% Total 35% 35% 33% 30% 33% 2% Summary of Findings. The LACCD saw little change in the percentage of students who completed their program--a certificate, degree, or a transfer to a 4-year college--in 3 and 6 years. Since 2011, the completion rate in 3 years has only modestly increased (by 1%) and the completion rate in 6 years has slightly decreased (by 2%). To help identify achievement gaps, the completion rates were examined by age, gender, ethnicity, and low-income/financial aid status. Similar changes in completion rates were seen by age, gender, and financial aid status. However, there were some differences in completion rates among students who identified as American Indian/Other Non-White and who declined to state their ethnicity/had an unknown ethnicity. In 2015, the three-year completion rate for American Indian/Other Non-White students was 9%, which was 15% lower than completion rate in 2011; in this same time period, Asian, Black, Hispanic, and White ethnic groups all experienced small increases in their three-year completion rate. When examining the sixyear completion rates by ethnicity, only Asian and Black student groups experienced modest increases, 2% and 1% respectively. College Plans for Improvement. Although the LACCD experienced slight increases in three-year completion rates, the colleges will continue to employ multiple strategies to address the low completion rates in 3 and 6 year timeframes. For example, the colleges will assure that all new students are assessed, referred, and/or enrolled into first year experience programs. Programs like these, in addition to counseling departments, help increase the amount of information provided to students about completion options and how to best accomplish their goals. However, it is important to remember the student populations at various campuses and sometimes it may not be a realistic goal to complete a program in a 3- or 6-year timeframe, especially for students who are attending part time. Measure 2.4.4a Number of Certificates Awarded By Age College Year Change Under ,540 1,784 2,065 2,165 3,476 1, ,194 1,476 1,657 1,786 2,267 1, ,131 1,235 1,202 1, and Over District 3,968 4,734 5,339 5,601 8,080 4,112 Page 32
39 Measure 2.4.4b Number of Certificates Awarded By Gender College Year Change Female 2,307 2,643 2,998 3,180 4,665 2,358 Male 1,661 2,090 2,341 2,420 3,413 1,752 District 3,968 4,733 5,339 5,600 8,078 4,110 Measure 2.4.4c Number of Certificates Awarded By Ethnicity College Year Change Asian , Black Hispanic 1,897 2,349 2,725 2,946 4,268 2,371 White , American Indian/ Other Non-White Unknown/ Decline to State District 3,971 4,735 5,345 5,607 8,087 4,116 Measure 2.4.4d Number of Certificates Awarded By Financial Aid (Low-Income) Status College Year Change Receiving No Financial Aid 1,582 1,838 1,816 1,863 2, Receiving BOG Waiver only 1,351 1,661 1,937 1,981 2,681 1,330 Receiving Pell Grant (w/ BOGW) 1,037 1,234 1,592 1,762 2,933 1,896 District 3,970 4,733 5,345 5,606 8,085 4,115 Summary of Findings. Overall, LACCD saw a large increase in the number of certificates awarded since In fact, the number of certificates awarded in 2015 (8,400 Chancellor s Office Approved Certificates) grew to more than double the amount awarded in Although all groups experienced gains in these measures, the number of certificates awarded was examined by age, gender, ethnicity, and low-income/financial aid status in order to identify groups that are not experiencing the same level of gains. When examining the differences between age groups, students and experienced the largest increase in the number of certificates awarded. The data also show that the number of certificates awarded to females has increased at a higher Page 33
40 rate than males. In addition, the number of certificates awarded to Hispanics has dramatically increased (by 2,371) in 2015 when compared to other ethnic groups; these increases are likely due to the large proportion of Hispanic students attending LACCD colleges. Last, the data show that students receiving no financial aid had the least growth in certificate attainment, while students receiving a Pell Grant that includes the Board of Governor s Fee Waiver had the highest growth in the number of certificates awarded. It should also be noted that the number of certificates earned is not a count of individual students, but reflects the number of certificates awarded, as students may earn multiple certificates in their chosen area of study. College Plans for Improvement. Although LACCD saw growth in all groups, the colleges will continue to review their certificate programs regularly order to provide the community with curriculum that offer the most up-to-date skills and information needed by students to start a new career or advance in their current profession. This will help ensure that this positive trend continues. In addition, the continually tracking of outcomes by age, gender, ethnicity, and low-income/financial aid status will help in identifying achievement gaps. Goal 2, Objective 4 Conclusion. The LACCD plays an active role in helping identify achievement gaps in student outcomes. The data show that there are group differences in several measures, but that for the most part, trends for the various student outcome measures are consistent across age, gender, ethnicity, and lowincome/financial aid status. The one exception may be the outcomes for students that identify as American Indian/Other Non-White; this group of students saw the most decline in the percentage of students who completed 30 units in 3 years, completed 60 units in 3 years, completed English 101 and Math 125 (or above) in 3 years, and who completed their certificate, degree, or transferred in 3 years. It is important to note, however, that these seemingly large declines may be due to the fact that a relatively smaller proportion of students identify as American Indian/Other Non-White, when compared to other ethnic groups. The District has a student equity plan that helps ensure historically underrepresented groups in higher education have an equal opportunity for access, success, and transfer from any LACCD college. Through various analyses, the District has determined that the most common disproportionally impacted subgroups are African American, Hispanic, and Male students. The colleges have used several strategies to help increase equity in student outcomes for these students. Some examples include the enrollment of students into first- and second-year programs that provide extra support for students that may include supplemental instruction or participation in a student-mentor program. In addition, the professional development of faculty and staff that encompasses culturally-sensitive practices and knowledge about how to identify appropriate services for at-risk students may also impact student success in historically underrepresented groups in higher education. The LACCD plays an active role in helping increase performance of under-performing groups. Page 34
41 GOAL 3 Organizational Effectiveness Objective 1: Assess and improve district processes and services. Measure 1: Student satisfaction with district services Measure 2: College accreditation status Measure 3: Total Full Time Equivalent Student (FTES) Measure 4: Expenditures per FTES Measure 5: Average class size Measure 6: Fund balance Measure Student Satisfaction with District Services College Spring 2012 Fall 2014 Change Somewhat to Very Satisfied Not Satisfied Somewhat to Very Satisfied Not Satisfied Admissions & Records 75.0% 6.6% 87.4% 6.7% 12.4% Assessment & Placement Services 50.8% 5.7% 78.0% 7.2% 27.2% Bookstore 74.2% 9.5% 79.8% 13.0% 5.6% Business and Fiscal Office 61.0% 4.5% 70.1% 6.7% 9.1% Career and Employment Center 24.9% 3.8% 47.9% 5.5% 23.0% Child Care Center 13.6% 1.6% 39.1% 3.1% 25.5% Disabled Students Programs & Services 14.9% 1.9% 40.4% 2.9% 25.5% EOPS or CARE 22.4% 3.2% 46.5% 2.9% 24.1% Financial Aid Office 56.0% 10.3% 64.8% 16.5% 8.8% Food Services 44.7% 8.2% 53.6% 14.2% 8.9% General College Counseling Services 45.8% 9.0% 68.8% 11.9% 23.0% Health Center 28.7% 3.2% 55.1% 4.7% 26.4% Instructional or Computer Labs 59.1% 3.7% 66.4% 5.1% 7.3% International Students Program & Services 13.6% 1.6% 41.0% 3.5% 27.4% Library 67.5% 5.7% 83.7% 4.3% 16.2% On-campus Orientation 33.6% 3.9% 59.6% 6.0% 26.0% Online Orientation 28.5% 4.0% 52.6% 6.5% 24.1% Transfer Center 29.0% 3.9% 54.0% 5.7% 25.0% Tutoring Services 36.1% 4.1% 57.8% 5.8% 21.7% Veterans Office 12.5% 1.7% 34.2% 2.8% 21.7% District 39.6% 4.8% 59.0% 6.8% 19.4% Page 35
42 Summary of Findings. The LACCD experienced increases in student satisfaction with services from 2012 to In the Student Survey, the percentage of students that say they were somewhat to very satisfied with various services increased by an average of 19.4%. The library and EOPS/CARE services, in addition to experiencing higher proportions of student satisfaction, also decreased in the portion of students not satisfied with their services. Not only are there general levels of increased satisfaction, the data also show that a higher proportion of students are accessing services. For example, only 40.2% of the student surveyed had used the tutoring services on their campus in 2012; two years later, in 2014, that percentage rose to 63.6%. The same trend is present with the percentage of students using the campus child care center. In 2012, 15.2% of students surveyed were using the child care center on campus and that proportion rose to 42.2% in College Plans for Improvement. The trend in the data suggest that not only are students more satisfied with campus services than in previous years, but that more students are accessing available services on campus. The colleges plan to continue their focus on customer service and ensuring that students are aware of campus services. In order to continue to increase the level of student satisfaction of services, the district plans to survey students at more regular intervals. Measure College Accreditation Status College July 2011 July 2012 July 2013 July 2014 July 2015 July 2016 Number of Years Above FA-W Ratings City FA-N FA-N FA-N FA-N FA-N FA-RA 6 East FA-N FA-N FA-N FA-N FA-N FA-RA 6 Harbor FA-N FA-P FA-SR/RA FA-N FA-N FA-RA 5 Mission FA-N FA-N FA-W FA-SR/RA FA-N FA-RA 5 Pierce FA-N FA-N FA-RA FA-N FA-N FA-RA 6 Southwest FA-N FA-P FA-W FA-SR/RA FA-N FA-W 3 Trade FA-SR FA-N FA-N FA-N FA-N FA-RA 6 Valley FA-N FA-N FA-W FA-W FA-SR FA-RA 4 West FA-N FA-W FA-SR/RA FA-N FA-N FA-RA 5 Number of Colleges Above FA-W Rating Note. FA-N = Fully Accredited - No Action; FA-RA = Fully Accredited Reaffirmed; FA-SR = Fully Accredited - Sanction Removed; FA- SR/RA = Fully Accredited - Sanction Removed and Reaffirmed; FA-W = Fully Accredited Warning; FA-P = Fully Accredited Probation. Summary of Findings. In 2016, 8 out 9 colleges had an accreditation status above a Fully Accredited-Warning (FA-W) rating. During the 5-year span between 2011 and 2016, 5 colleges received a FA-W status or below: Los Angeles Harbor College (LAHC), Los Angeles Mission College (LAMC), Los Angeles Southwest College (LASC), Los Angeles Valley College (LAVC), and West Los Angeles College (WLAC). The 5 colleges all created plans that outlined specific measures to be taken and how to integrate those changes to the college systematically. Since their FA-W rating, LAHC, LAMC, LAVC, and WLAC colleges have had sanctions removed and have been reaffirmed. LASC was able to initially make changes and were reaffirmed in 2014 after 2 years of being on probation and being on a warning status. However, LASC again was rated FA-W in Page 36
43 College Plans for Improvement. The LACCD colleges understand the importance of accreditation and its role in encouraging the improvement of academic quality, institutional effectiveness, and student success. They will continue to participate in the accreditation process and be proactive in ensuring their colleges maintain high institutional standards. LASC, who currently has a FA-W accreditation status, has created a comprehensive plan and has been providing monthly updates to the Institutional Effectiveness & Student Success Committee on their progress towards addressing areas of concern for the Accrediting Commission for Community and Junior Colleges. Measure Full Time Equivalent Students College Year Change City 14,276 13,384 14,106 13,451 13,151 1,125 East 24,591 21,923 21,963 23,345 24, Harbor 7,193 6,531 7,153 6,747 7, Mission 6,355 5,899 6,097 6,503 6, Pierce 14,080 13,868 14,378 15,308 15,574 1,494 Southwest 5,008 4,900 5,149 5,428 5, Trade 12,434 11,656 12,019 12,716 13, Valley 12,231 12,401 13,042 13,338 13,424 1,193 West 6,781 6,774 7,000 7,310 7, District 103,529 97, , , ,601 4,072 Summary of Findings. The number of Full Time Equivalent Students (FTES) has increased since 2011 to 107,601 in Although there have been increases, the growth in FTES is smaller than expected. The modest growth rates are reflective of a national trend since 2010 that shows enrollment is falling nationwide. 5 The decline and slowed growth of FTES is partly due to improvement in the economy. Often, students go back to work, instead of staying in school, as the job market improves. In general, however, community colleges have experienced the greatest drop in enrollment rates. Some suggest that the decline is not only due to economic improvement, but also due to a perceived disconnect between college and employment. 6 College Plans for Improvement. The LACCD board has targeted an increase of 10% in the number of completions across all 9 colleges, which means that the number of enrollments would potentially increase. In addition to enhancing a culture of customer service at LACCD, the implementation of the Los Angeles College Promise Program (LACP), which will offer students in Los Angeles County a free year of community college, may also help increase both the number of students and the number of students that are attending full time Page 37
44 Measure College Expenditures per FTES College Year Change City $4,011 $4,104 $4,228 $4,468 $4,688 $677 East $3,755 $3,810 $4,182 $4,301 $4,442 $687 Harbor $4,057 $4,472 $4,412 $4,934 $5,165 $1,108 Mission $4,127 $4,501 $4,656 $4,537 $4,873 $746 Pierce $4,103 $3,946 $4,086 $4,053 $4,514 $411 Southwest $4,687 $5,009 $4,853 $5,057 $5,431 $744 Trade $3,992 $4,211 $4,400 $4,281 $4,514 $522 Valley $4,239 $4,229 $4,141 $4,101 $4,305 $66 West $4,272 $4,391 $4,743 $4,627 $4,792 $520 District $4,036 $4,148 $4,305 $4,371 $4,624 $588 Summary of Findings. College expenditures per FTES have increased since In 2015, the expenditures totaled $4,624.00, which was a $ higher than in The increase in expenditures per FTES since 2011 has been small (less than $600) and is low in comparison to other higher education institutions. College Plans for Improvement. The LACCD practices oversight and management of all financial resources and conducts external audits. The District also continually evaluates its oversight of financial aid, grants, externally funded programs, contracts, foundations, auxiliary organizations, and institutional investments and assets in order to make any necessary improvements. The colleges plan to continue to use funds efficiently to ensure students have the resources and courses available to successfully complete their educational goals. Measure Average Class Size College Year Change City East Harbor Mission Pierce Southwest Trade Valley West District Summary of Findings. The LACCD average class size has decreased since In 2015, the average class size was 35.2 students. This decrease is likely partially due to the decreases in enrollment across the District. Page 38
45 College Plans for Improvement. The LACCD board has targeted an increase of 10% in the number of completions across all 9 colleges, which means that average class size may potentially increase. In addition, the District has started to explore additional days and times that students may be interested in taking courses. Some colleges have started to offer courses outside the traditional times, offered late-start classes, and provided more courses online in order to make classes more accessible to non-traditional students and students who have more time obligations. Measure Fund Balance Year Change District 14.5% 13.1% 13.6% 13.4% 20.9% 6.4% Summary of Findings. The fund balance reflects the ending unrestricted general fund balance as a percentage of total expenditures. Since 2011, the District fund balance has increase to 20.9%. This suggests that the District has been able to increase the amount of money that is allocated to cover known or expected revenue shortfalls during the year. College Plans for Improvement. The LACCD has demonstrated its ability to maintain adequate reserves and continues to raise the fund balance to address future and unforeseen needs. The District will continue to monitor the expenditures used throughout the year in order to keep the fund balance at the appropriate proportion. Goal 3, Objective 1 Conclusion. The LACCD has been able to assess and improve several district processes and services. The trend in the data suggest that not only are students more satisfied with campus services than in previous years, but that more students are accessing services than in the past. Not only are student more content with their colleges, the data show that despite modest increases in expenditures per FTES, that the District s fund balance has increased since Although improvement in this objective was observed, it may be important in the future to include more consistent measures of satisfaction and to identify other metrics that may help identify the improvement of specific District processes, instead of the more global measures used in this evaluation. Ensuring that LACCD continues to improve organizational effectiveness will help the District maintain its high standards for operations and customer service. Page 39
46 Objective 2: Improve communications and governance throughout the district. Measure 1: Effective decision-making Measure 2: Participatory governance Measure 3: Overall rating of district-level governance Measure Effective Decision Making College Year Change Agree Disagree Agree Disagree Agree Disagree District-level decision making is effective in relation to budget development and resource allocation 38.6% 42.9% 30.2% 55.1% 39.4% 51.1% 0.8% District-level decision making is effective in relation to enrollment management and FTES target setting 49.5% 31.2% 29.8% 47.0% 53.0% 36.0% 3.5% District-level decision making is effective in relation to strategic planning and strategic goal setting 51.3% 26.4% 41.8% 40.8% 46.3% 38.1% 5.0% District-level decision making is effective in relation to Bond Program planning and oversight 44.7% 39.0% 25.4% 60.5% 28.7% 55.8% 16.0% District-level decision making is effective in relation to employee benefits (JLMBC) 66.3% 20.7% 56.7% 29.2% 68.9% 19.3% 2.6% Average Rating 50.1% 32.0% 36.8% 46.5% 47.3% 40.1% 2.8% Summary of Findings. The data suggest that the general ability of making decisions has declined slightly since 2010, with an average of 47.3% of survey respondents saying they agree that decision making is effective at the District level. The greatest decrease in satisfaction occurred when people were asked whether Districtlevel decision making was effective in relation to Bond Program planning and oversight. In , only 28.7% agreed with that statement, while more than half disagreed. Decisions regarding budget development and resource allocation were also rated as ineffective by more than half (51.1%). However, 53.0% said that District-level decision making was effective in relation to enrollment management and FTES target setting and 68.9% said decision making was effective in relation to employee benefits. Page 40
47 Measure Participatory Governance College Year Change Agree Disagree Agree Disagree Agree Disagree Decisions made through participatory governance at the district level are based on research & data 42.6% 25.8% 26.2% 37.2% 50.4% 28.1% 7.8% Decisions made through participatory governance at the district level are communicated effectively to all affected stakeholders 38.7% 47.6% 23.5% 58.5% 32.5% 57.7% 6.2% Decisions made through participatory governance at the district level are followed through on effectively 39.5% 33.3% 25.7% 41.0% 30.3% 51.5% 9.2% Average Ratings 40.3% 35.6% 25.1% 45.6% 37.7% 45.8% 2.6% Summary of Findings. About half of those surveyed (50.4%) endorsed that decisions made through participatory governance were based on research and data, which increased by 7.8% since However, only 32.5% endorsed that these decisions are communicated effectively to all affected stakeholders and 30.3% said that they agree that decisions made through participatory governance are followed through on effectively at the District level. The findings suggest that decisions made though participatory governance should be communicated more effectively to stakeholders and more follow up should be conducted to ensure decisions made are followed through on effectively. Measure Overall Rating of District-Level Governance College Year Change Agree Disagree Agree Disagree Agree Disagree The LACCD Board of Trustees supports participatory governance 68.3% 15.1% 39.2% 39.2% 46.4% 39.1% 21.9% The district/college administration support participatory governance at the district level 64.2% 16.7% 46.9% 31.5% 58.1% 30.2% 6.1% Overall, I feel that district-wide decision making is effective in supporting the district s mission and goals 56.2% 27.2% 34.8% 46.9% 40.9% 45.3% 15.3% Average Ratings 62.9% 19.7% 40.3% 39.2% 48.5% 38.2% 14.4% Summary of Findings. Overall ratings of district-level governance have decreased since In , less than half of respondents said that the LACCD Board of Trustees supported participatory governance (46.4%) and that they felt that district-wide decision making was effective in supporting the district s mission and goals (40.9%). The data suggest that the overall rating of participatory governance at the District level are low and it may be prudent to consider how participatory governance may be improved. Page 41
48 Plans for Improvement. It was discovered that not all governance bodies were presented with the survey results, which meant that various issues highlighted by the survey went unresolved. As part of the District s Accreditation Report, an action plan was developed to improve the participatory governance system at the District level and how to provide formal mechanisms for provided feedback. As part of this plan, the survey instrument used will be reviewed annually in order to update the appropriate questions by the District Planning and Accreditation Committee (DPAC). The office of Institutional Effectiveness will update the distribution list of user groups and conduct the survey biennially with a month-long data collection window. After collecting data and conducting analyses, a preliminary report of the District-level governance and decision making assessments will be compiled with input from DPAC. Once the report is finalized, the DPAC will present the findings to the Chancellor s Cabinet and governance committees. Goal 3, Objective 2 Conclusion. The findings were gathered from the LACCD District-Level Governance and Decision Making Assessments, which are conducted on a two-year cycle. The survey was administered to various administrators, district counsel groups, and several committees throughout the LACCD. The data show decisions made are based on research and data and effective decision making in relation to enrollment management, FTES target setting, and employee benefits are strengths of District-level governance system. In contrast, overall ratings of District-level governance, how decisions are communicated and followed through on, and effective decision making in relation to budget development, strategic planning, and Bond Program planning may be considered weakness, with low ratings observed in However, actions plans were developed outlining the process to be followed when conducting these assessments, which included a formal mechanism to provide feedback to the Chancellor s Cabinet and governance committees. Objective 3: Improve employee development opportunities. Measure 1: Staff development expenditures Summary of Findings. Unfortunately, there is no reliable data available for the amount spent in staff development expenditures. Although limited data are available for expenditures according to Functional Area 6750 and the faculty/staff development fund, the college data show a great deal of variability in the amount of money spent in general and from year to year. Because the data could not be audited or validated, they are not reported. Plans for Improvement. It is difficult to track the amount of staff development expenditures across the district because the funds come from different sources and each department at every college chooses how to allocate those funds locally. If improving staff development is deemed an important goal for the District, it may be prudent to develop a consistent business practice to track staff development expenditures. Goal 3, Objective 3 Conclusion. The LACCD is committed to investing in professional development opportunities for faculty, staff, and administrators. In the next District Strategic Plan, the focus on investment for professional development opportunities will continue to be an objective. The goal would be to enhance work performance, broaden skills for leadership and career advancement, leverage academic programs, and allow for effective and clear career pathways for all employees. It is also advisable to create a consistent method of tracking the District s progress towards this goal in the next strategic plan. Page 42
49 GOAL 4 Resources and Collaboration Objective 1: Develop and diversify sources of revenue. Measure 1: Actual expenditures for other specially funded programs Measure Actual Expenditures for Other Specially Funded Programs College Year Change City $3,095,167 $3,702,595 $4,139,006 $4,432,837 $5,019,799 $1,924,632 East $5,325,590 $5,161,898 $4,679,175 $4,740,367 $7,692,251 $2,366,661 Harbor $3,299,737 $3,187,631 $3,644,687 $4,320,582 $5,837,037 $2,537,300 Mission $3,049,835 $3,091,278 $2,473,141 $2,386,614 $2,730,841 $318,994 Pierce $1,379,506 $1,253,469 $1,694,474 $1,720,058 $2,715,208 $1,335,702 Southwest $4,562,385 $4,302,463 $4,892,672 $4,791,566 $4,576,020 $13,635 Trade $5,252,600 $4,922,539 $3,613,101 $5,193,474 $6,902,063 $1,649,463 Valley $7,085,782 $5,785,420 $5,582,126 $5,713,528 $6,083,230 $1,002,552 West $5,604,356 $5,801,033 $6,072,925 $6,812,335 $7,009,969 $1,405,613 ESC $4,635,484 $2,345,210 $3,770,566 $3,204,058 $3,453,205 $1,182,279 Total $43,290,443 $39,553,538 $40,561,872 $43,315,418 $52,019,623 $8,729,180 Summary of Findings. Specially Funded Programs represent those programs or activities that are supported by an external funding source, such as money received from a grant. Overall, the District saw an increase in the amount of expenditures used for other Specially Funded Programs since In 2015, the total expenditures were $52,019,623.00, which is $8,729, higher than in Plans for Improvement. The District practices and plans to continue oversight and management of all financial resources, including its Specially Funded Programs (SFP). This is partially done by having a dedicated SFP accountant assigned to fiscal monitoring and oversight, which helps establish policies and procedures to ensure compliance with all applicable rules and regulations. In addition, Specially Funded Programs undergo annual external audits to determine compliance with regulations. Goal 4, Objective 1 Conclusion. The LACCD encourages all college personnel to identify potential sources of external funding, especially as it relates to getting more services and resources that buttress student success. The District has been able to secure more external funds and the amount of actual expenditures in 2015 was high for Specially Funded Programs, $52,019, The colleges and the District will continue to develop proposals and submit applications for programs that will benefit its students. Page 43
50 Objective 2: District and college Foundations will significantly increase external resources in order to support the District and colleges. Measure 1: Funds raised (annual and cumulative). Summary of Findings. Unfortunately, data were not available regarding the amount of funds raised by the Foundations at the various colleges and at the District. Because the various foundations are primarily staffed by volunteers, including their accountants, accurate and not up-to-date information regarding the amount of funds raised were not available and were not reported here. The foundations operate more independently than other departments, and they are not bound by the same accountability and reporting requirements. Plans for Improvement. If increasing the amount of external resources is an important focus for the District, it may be prudent to develop a process to consistently track the funds raised by the various foundations in the future. Because Foundations work more independently than other departments within the District, collaborating will play a more important role to ensure that the Foundations have enough resources and that goals are met for securing additional funds to support the LACCD. Goal 4, Objective 2 Conclusion. The LACCD foundation is charged with supplementing and finding scholarship opportunities for students. The work of the foundation often involves identifying and soliciting funds from in the private and philanthropic sectors. Their work in directing comprehensive fund-raising programs at the colleges and the District is invaluable and allows for the support of new initiatives to meet programmatic needs that are not funded or poorly funded. In June 2017, the LACCD Foundation webpage was under construction. It may be important to ensure the website is available and includes ways to donate directly to the LACCD. In addition, it may be imperative to create business processes to help account for the amount of funds raised annually if increasing the amount of funds raised is an important goal for the District. Objective 3: Increase business and community partnerships to support innovation and student learning. Measure 1: Number and type of community/business partnerships Summary of Findings. Unfortunately, there is no centralized office or place that documents the number and types of community and business partnerships established and maintained by the colleges or the District. Because of this, the data are not reported here in the evaluation report. Plans for Improvement. If increasing the number of partnerships is an area of focus for the District, it may be important to create a business process in the future for collecting information related to the community and business partnerships established and maintained. Starting to document these business and community partnerships may help track the District s progress in establishing new relationships and maintaining old ones. Goal 4, Objective 3 Conclusion. The LACCD encourages all college personnel to identify potentially beneficial partnerships within the community. Although the LACCD and its colleges collaborate a great deal and have many community partnerships and formal relationships with a multitude of organizations, having some way to document these collaborations formally across the District may be a valuable way to measure our impact in the community. This is especially important because students thrive when programs are relevant and are supplemented by strong business partnerships that provide additional expertise about the knowledge and skills needed when students enter the work force. Page 44
51 Summary of Findings The LACCD has made great strides during this District Strategic Plan (DSP). Since 2011, the District has been able to improve student success, maintain high standards for academic programs, and maintain fiscal accountability. The LACCD has made good progress in Goal 1, which focuses on improving equitable access and helping students attain important early educational momentum. Specifically, the District has experienced increases in the percentage of new students who complete the matriculation process. Since 2011, the percentage of new students completing English and math assessments before or during the first term, completing orientation, and creating an academic plan have all increased by 5% to 14%. The District also saw overall increases in the percentage of new students successfully completing at least one English and math class and in persistence from Fall to Spring and from Fall to Fall. The gains in these measures are partially due to the increased efforts by colleges to provide current and accurate information to students, to make the assessment process easier, and to streamline the orientation process, which have been integral ways to ensure new students quickly complete their assessment and matriculation process. The LACCD has also made progress in Goal 2, which focuses on providing a learner-centered educational environment, helping students attain their educational goals, and increasing the equity of achievement in various student outcomes. There were several gains in measures of active learning/project learning and in measures of self-efficacy/self-directed learning since 2012; the increases in these measures suggest that the colleges effort to focus on the use of technology and professional development for faculty has been constructive. Gains in providing a learner-centered environment may also be partially reflected in the improvement of student outcomes since In 2015, gains were observed in the percentage of a new student cohort completing 30 and 60 units in 3 years, the percentage of a new student cohort completing English 101 and Math 125 (or above) in 3 and 6 years, and the completion rate (i.e., certificate, degree, or transfer) in 3 years. In addition, the LACCD has been able to increase the number of students who complete career-focused certificates in a timely manner and help students realize higher earnings as a result of their educational experience at our colleges. As the findings show, the number of certificates awarded by LACCD has increased dramatically; in 2015, 8,400 certificates were awards across the nine colleges. Last, the District has played an active role in helping identify achievement gaps in student outcomes. The data show that there are group differences in several measures, but that for the most part, trends for the various student outcome measures are consistent across age, gender, ethnicity, and low-income/financial aid status. It should be noted that the District has a student equity plan that helps ensure historically underrepresented groups in higher education have an equal opportunity for access, success, and transfer from any LACCD college, and the colleges have used several strategies to help increase equity in student outcomes for these students. The District s progress in Goal 3 measures has been mixed; this goal focused on improving organizational effectiveness through data-informed planning and decision-making, process assessment, and professional development. Although increases were observed in satisfaction with District services, the total Full Time Equivalent Students (FTES), and the fund balance, there were other measures that worsened since 2011, which include the number of colleges that have an accreditation status above Fully-Accredited-Warning (FA- W), average class size, and the expenditures per FTES. In addition, data regarding effective decision making, Page 45
52 participatory governance, and the overall rating of the District-level governance suggested declines in satisfaction with the District-level governance. Although improvement in this objective was observed, it may be important in the future to include more consistent measures of satisfaction and to identify other metrics that may help identify the improvement of specific District processes, instead of the more global measures used in this evaluation. Ensuring that LACCD continues to improve organizational effectiveness will help the District maintain its high standards for operations and customer service. Goal 4 of the DSP focused on increasing and diversifying sources of revenue in order to achieve and maintain fiscal stability and to support District initiatives and focused on enhancing and maintaining mutually beneficial external partnerships with business, labor, industry, and other community and civic organizations in the greater Los Angeles area. Unfortunately, it was difficult to measure the progress made by the District in these areas. For example, data were not available for measures of the amount of funds raised by the foundation and the number and types of community/business partnerships established and maintained. Because of this, the data are not reported here in the evaluation report. However, there was data available regarding the actual expenditures for Specially Funded Programs (SFP), which represented programs or activities supported by an external funding source. Overall, the District saw an increase of $8,729, in the amount of expenditures used for other SFP since The amount of actual expenditures in 2015 was high for Specially Funded programs, $52,019, The colleges and the District will continue to develop proposals and submit applications for programs that will benefit its students. Overall, the LACCD has seen much growth, especially in the areas of improving learner-centered learning environments, ensuring students attain important early educational momentum points, and improving student outcomes. The District will also continue to identify areas of growth, which include assessing and improving District process and services, improving communications and governance throughout the District, and documenting partnerships and external resources. Recommendations The LACCD has made great strides since the initial implementation of the current DSP. The progress, however, has been uneven and the implementation of the DSP could be improved in the future. The following recommendations should be considered during the development of the next DSP: Operationally define measures (i.e., identify specific and observable events that can be tracked over time) Develop a business process for collecting new information that is not already endemic to LACCD s regular reporting cycles Ensure that data are available for measures at regular intervals (e.g., annually or biennially) Select targets/goals for each measure in order to measure progress Continue the collaboration and frequent communication between the District Planning Committee, District Research Committee, and District leadership It may also be prudent to compile preliminary information regarding the DSP at more regular intervals. Although a comprehensive evaluation, such as this one, provides valuable information, having some of the data available earlier may have helped the District Planning Committee identifying some potential areas that may require additional support in order to meet and exceed District goals. Page 46
53 Looking Forward to the District Strategic Plan The District Planning Committee (DPC) is charged with the development and coordination of a comprehensive District Strategic Plan. The committee s central values during the planning process include vision, accountability, inclusivity, and creativity. The aim is to develop a plan that lays out the vision for the District that includes defined metrics and targets in order to evaluate LACCD s progress toward achieving institutional goals. The intent is to seek the input of all those contributing to the welfare of LACCD and those impacted by the District, with the hope of seeking creative solutions to the barriers that face our students and institutions. While the DPC will develop the plan, the DSP will be reviewed and approved by the District Board of Trustees, Chancellor, Presidents Council, Cabinet, Academic Senate, Shared Governance Committees, and the unions. The revised DSP will be a five-year plan that includes regular reviews. A six-stage planning process, outlined below, was used in the development of the DSP. Stage I Evaluation Complete evaluation of current District Strategic Plan Review of College Plan alignment Review of goals for currency Stage II Data Inquiry Analysis of known data Additional inquiry points Planning question (Internal Engagement Groups) Public forums Stage III Goal Setting & Collective Inquiry Compile analysis reports Establish draft goals (DPC) Inquiry on draft goals (Internal and External Engagement Groups) Stage IV Metrics & Targets Draft metrics and tragets (DPC and DRC) Vetting through Internal Engagement Groups Stage V Plan Development Develop plan Stage VI Collective Feedback & Approval Vetting of complete plan (Public comment and External Engagement Groups) Approval through shared governance Board approval Page 47
54 Appendix A List of Tables 1. Measure 1.1.1: Participation Rate in Underserved Areas Measure 1.1.2: Percentage of Eligible Students Receiving Pell Grant Measure 1.2.1a: Percentage of New Students Completing an English Assessment Before or in the First Term Measure 1.2.1b: Percentage of New Students Completing a Math Assessment Before or in the First Term Measure 1.2.2: Percentage of New Students Completing Orientation Measure 1.2.3: Percentage of New Students Creating an Academic Plan 8 7. Measure 1.3.1: Percentage of New Students Successfully Completing at Least One English and Math Class in their First Year Measure 1.3.2a: Persistence Fall to Spring Measure 1.3.2b: Persistence Fall to Fall Measure 2.1.1a: Measure of Active Learning/Project Learning Measure 2.1.1b: Measure of Student Engagement In and Out of Class Measure 2.1.1c: Measure of Self-Efficacy/Self-Directed Learning Measure 2.1.2: Measure of How Technology is Being Used to Improve Student Learning and Engagement Measure 2.2.1a: Percentage of New Student Cohort Completing 30 units in 3 Years Measure 2.2.1b: Percentage of New Student Cohort Completing 60 units in 3 Years Measure 2.2.2a: Percentage of New Student Cohort Completing English 101 & Math 125 (or above) in 3 Years Measure 2.2.2b: Percentage of New Student Cohort Completing English 101 & Math 125 (or above) in 6 Years Measure 2.2.3a: Completion Rate (i.e., certificate, degree or transfer) in 3 Years Measure 2.2.3b: Completion Rate (i.e., certificate, degree or transfer) in 6 Years Measure 2.3.1: Number of Certificates Awarded Measure 2.3.2a: Graduation Rates of Full-Time, First-Time, Degree/Certificate-Seeking Undergraduates with 150% of Normal Time to Completion Measure 2.3.2b: Median Time to Degree Measure 2.3.3: Student Success Scorecard Skill Builder Metric Measure 2.4.1a: Percentage of New Student Cohort Completing 30 units in 3 Years By Age.. 24 Page 48
55 25. Measure 2.4.1b: Percentage of New Student Cohort Completing 60 units in 3 Years By Age Measure 2.4.1c: Percentage of New Student Cohort Completing 30 units in 3 Years By Gender Measure 2.4.1d: Percentage of New Student Cohort Completing 60 units in 3 Years By Gender Measure 2.4.1e: Percentage of New Student Cohort Completing 30 units in 3 Years By Ethnicity Measure 2.4.1f: Percentage of New Student Cohort Completing 60 units in 3 Years By Ethnicity Measure 2.4.1g: Percentage of New Student Cohort Completing 30 units in 3 Years By Financial Aid (Low-Income) Status Measure 2.4.1h: Percentage of New Student Cohort Completing 60 units in 3 Years By Financial Aid (Low-Income) Status Measure 2.4.2a: Percentage of New Student Cohort Completing English 101 & Math 125 (or above) in 3 Years By Age Measure 2.4.2b: Percentage of New Student Cohort Completing English 101 & Math 125 (or above) in 6 Years By Age Measure 2.4.2c: Percentage of New Student Cohort Completing English 101 & Math 125 (or above) in 3 Years By Gender Measure 2.4.2d: Percentage of New Student Cohort Completing English 101 & Math 125 (or above) in 6 Years By Gender Measure 2.4.2e: Percentage of New Student Cohort Completing English 101 & Math 125 (or above) in 3 Years By Ethnicity Measure 2.4.2f: Percentage of New Student Cohort Completing English 101 & Math 125 (or above) in 6 Years By Ethnicity Measure 2.4.2g: Percentage of New Student Cohort Completing English 101 & Math 125 (or above) in 3 Years By Financial Aid (Low-Income) Status Measure 2.4.2h: Percentage of New Student Cohort Completing English 101 & Math 125 (or above) in 6 Years By Financial Aid (Low-Income) Status Measure 2.4.3a: Completion Rate (i.e., certificate, degree or transfer) in 3 Years By Age Measure 2.4.3b: Completion Rate (i.e., certificate, degree or transfer) in 6 Years By Age Measure 2.4.3c: Completion Rate (i.e., certificate, degree or transfer) in 3 Years By Gender Measure 2.4.3d: Completion Rate (i.e., certificate, degree or transfer) in 6 Years By Gender Measure 2.4.3e: Completion Rate (i.e., certificate, degree or transfer) in 3 Years By Ethnicity Measure 2.4.3f: Completion Rate (i.e., certificate, degree or transfer) in 6 Years By Ethnicity.. 31 Page 49
56 46. Measure 2.4.3g: Completion Rate (i.e., certificate, degree or transfer) in 3 Years By Financial Aid (Low-Income) Status Measure 2.4.3h: Completion Rate (i.e., certificate, degree or transfer) in 6 Years By Financial Aid (Low-Income) Status Measure 2.4.4a: Number of Certificates Awarded By Age Measure 2.4.4b: Number of Certificates Awarded By Gender Measure 2.4.4c: Number of Certificates Awarded By Ethnicity Measure 2.4.4d: Number of Certificates Awarded By Financial Aid (Low-Income) Status Measure 3.1.1: Student Satisfaction with District Services Measure 3.1.2: College Accreditation Status Measure 3.1.3: Full Time Equivalent Students Measure 3.1.4: College Expenditures per FTES Measure 3.1.5: Average Class Size Measure 3.1.6: Fund Balance Measure 3.2.1: Effective Decision Making Measure 3.2.2: Participatory Governance Measure 3.2.3: Overall Rating of District-Level Governance Measure 4.1.1: Actual Expenditures for Other Specially Funded Programs.. 43 Page 50
57 LOS ANGELES COMMUNITY COLLEGE DISTRICT District Strategic Plan Report Scorecard Goals, Objectives, and Measures 2015 Goal 1. Access and Preparation for Success Change Since 2011 Status Objective 1: Ensure equitable access to education District Participation Rate % N/A N/A Percentage of Eligible Students Receiving Pell Grant 66% -5% Objective 2: Increase the percentage of new students who complete the matriculation process 1.2.1a Percentage of New Students Completing an English Assessment in the First Term or Before 78% +6% 1.2.1b Percentage of New Students Completing an Math Assessment in the First Term or Before 79% +5% Percentage of New Students Completing Orientation 72% +14% Percentage of New Students Creating an Academic Plan 77% +11% Objective 3: Increase the percentage of new students successfully completing at least one English and Math class in their first year and persisting to subsequent terms Percentage of New Students Successfully Completing at Least One English and Math 26% +9% 1.3.2a Persistence Fall to Spring 89% +3% 1.3.2b Persistence Fall to Fall 75% +1% Goal 2. Teaching and Learning for Success Objective 1: Provide a learner-centered learning environment a Measure of Active Learning / Project Learning 69% +4% 2.1.1b Measure of Student Engagement in and out of Class 19% -1% 2.1.1c Measure of Self-efficacy / Self-directed Learning 78% +6% Measure of How Technology is Being Used to Improve Student Learning and Engagement 66% N/A N/A Objective 2: Improve student outcomes a Percentage of New Student Cohort Completing 30 Units in 3 Years 63% +4% 2.2.1b Percentage of New Student Cohort Completing 60 units in 3 Years 29% +2% 2.2.2a Percentage of New Student Cohort Successfully Completing English 101 and Math 125 (or above) in 3 Years 28% +5% 2.2.2b Percentage of New Student Cohort Successfully Completing English 101 and Math 125 (or above) in 6 Years 34% +3% 2.2.3a Completion Rate (i.e., certificate, degree, or transfer) in 3 Years 16% +1% 2.2.3b Completion Rate (i.e., certificate, degree, or transfer) in 6 Years 33% -2% Change from Prior Years: = Improvement = Decline 1 District participation rate is a new measure and data are only available for the academic year. 2 Data from the student survey in years 2012 and 2014 was used, which means the change in scores only reflects a 2-year difference. In the case of measure 2.1.2, the question was only asked once in Current 3-year data is from the cohort and 6-year data is from the cohort.
58 LOS ANGELES COMMUNITY COLLEGE DISTRICT District Strategic Plan Report Scorecard Goals, Objectives, and Measures 2015 Change Since 2011 Status Objective 3: Increase the number of students completing a certificate in a timely manner Number of certificates awarded 4 8,400 +4, a Graduation Rates of Full-Time, First-Time, Degree/Certificate- Seeking Students within 150% of Normal Time to Completion 23% +6% 2.3.2b Median time to degree Student Success Scorecard Builder Metric 18.5% % Goal 3. Organizational Effectiveness Objective 1: Assess and improve district process and services Satisfaction with District services 6 59% +19.4% College accreditation status (# of colleges above FA-W rating) Total Full Time Equivalent Student (FTES) 107,601 +4, Expenditures per FTES $4,624 +$ Average class size Fund balance 20.9% +6.4% Objective 2: Improve communications and governance throughout the district Effect decision making 47.3% -2.8% Participatory governance 37.7% -2.6% Overall rating of District-level governance 48.5% -14.4% Objective 3: Improve employee development opportunities Staff development expenditures 8 N/A N/A N/A Goal 4. Resources and Collaboration Objective 1: Develop and diversify sources of revenue Actual expenditures for Other Specially Funded Programs $52,019,623 +$8,729,180 Objective 2: District and foundations will significantly increase external resources in order to support the District and colleges Funds raised 9 N/A N/A N/A Objective 3: Increase business and community partnerships to support innovation and student learning Number and Types of Community/Business Partnerships 10 N/A N/A N/A Change from Prior Years: or = Improvement or = Decline 4 These are the number of Chancellor s Office Approved Certificates. 5 The Skill Builder Metric is a new measure captured by the state and 18.5% is the rate from cohort. No data were available for the and academic years. 6 Data from the student survey in years 2012 and 2014 was used, which means the change in scores only reflects a 2-year difference. 7 Data from the biennial LACCD District-Level Governance and Decision Making Assessment completed in 2010, 2012, and Staff development expenditures require additional analysis to improve data accuracy and consistency and are not reported. 9 Funds raised through foundations require additional analysis to improve data accuracy and consistency and are not reported. 10 The number and types of business partnerships requires additional analysis to improve data accuracy and consistency and are not reported.

59 DISTRICT STRATEGIC PLAN Progress Report and Planning Activities Institutional Effectiveness and Student Success Committee May 24, 2017
60 2 Overview of District Strategic Plan: Development Activities and Process I II III IV V VI Activities DSP Evaluation Data Inquiry Development of Goals and Objectives Development of Metrics and Targets Final Plan Development Feedback and Approvals Status In Consultation In Process Planned for Summer-Fall 2017
61 3 Background on District Strategic Plan (DSP) Contained 4 goals and 13 objectives Approved by Board in Feb Allowed for the development of districtwide priorities Served as a planning framework for the colleges
62 4 I DSP: Evaluation EPIE compiled data on plan metrics and College Effectiveness Reports over the period EPIE and District Planning Committee developed a Draft District Strategic Plan Evaluation Report Vetted through the District Planning Committee and District Research Committee Analyzed outcomes data on plan metrics Analyzed validity of metrics Obtained qualitative input from colleges on plan outcomes Developed recommendations for DSP Developed District Effectiveness Report Scorecard and Comprehensive Evaluation Report
63 I DSP Evaluation: Summary of DSP Outcomes Focus is on Districtwide Outcomes Metrics in which the District Improved Percentage of students completing matriculation process New students successfully completing at least one English and math class in their first year Persistence (Fall to Spring and Fall to Fall) New students completing 30 & 60 units New students completing English 101 & Math 125 (3 & 6 years) Amount of specially funded revenue Metrics in which the District Declined Completion rates (6 years) Expenditures per FTES Average Class Size Effectiveness of district-wide governance 5
64 I DSP Evaluation: Example of Outcomes 6
65 7 II DSP: Data Inquiry Board s Annual Planning Meeting (August 2016) provided focus areas and Board goals: Student Completion (10 pct. pt. increase) Improve Customer Service Full day planning retreat facilitated by Governance Institute for Student Success (GISS) at LAMC in Oct EPIE conducted DSP planning forums at each college (Nov March 2017) and compiled results for use by District Planning Committee in goal development
66 8 III DSP: Proposed Goals Goal 1: We will increase college going for the Los Angeles region through enhanced outreach to community and educational partners and expanded access to academic programs that meet community and student needs Objective 1: We will expand educational opportunities to local high school students by increasing the number of courses offered through dual enrollment Objective 2: We will fully implement the LA College Promise and will seek to expand the promise to additional school districts and municipalities in the service area Objective 3: We, in partnership with Los Angeles Regional Adult Education Consortium, will increase educational opportunities to nontraditional students through the expansion of noncredit adult education courses focused on skills improvement and vocational training
67 9 III DSP: Proposed Goals Goal 2: We will develop a premier learning environment that places students as the first priority in the institution and effectively supports students in attaining educational goals Objective 1: We will have an excellent campus climate by improving student services, providing a safe learning environment, and by establishing a standard for customer service Objective 2: We will create an environment that is respectful to the needs of diverse populations and that embraces the diversity of opinions found in a global society Objective 3: We will increase fulltime enrollment for students through the development of flexible programs focused on working students and students with barriers to attending traditionally scheduled programs
68 10 III DSP: Proposed Goals Goal 2 (continued): Objective 4: We will review and refine curriculum and programs to ensure that they are responsive to student needs and meet the economic, industry, and societal needs of the region Objective 5: We will provide facilities and technologies to effectively serve and connect with the modern student and enhance regular and effective communication Objective 6: We will increase access to those traditionally underrepresented in higher education by assisting students in gaining access to financial aid and ensuring that all students, whether inperson or online, receive orientation, multiple measures assessment, and educational planning Objective 7: We will increase student persistence and successful course completion through effective practices
69 11 III DSP: Proposed Goals Goal 3: We will increase student completion to exceed state-wide performance measures and increase attainment of milestones indicative of academic success Objective 1: We will decrease time to completion by enhancing academic and student support programs Objective 2: We will increase completion of degrees and certificates Objective 3: We will increase the number of students transferring to four-year institutions Objective 4: We will increase career and job placement rates by enhancing business and industry partnerships, internships, and employment opportunities Objective 5: We will increase equity in the attainment of student milestones
70 12 III DSP: Proposed Goals Goal 4: We will improve organizational effectiveness through streamlined processes, minimized duplication of efforts, and enhanced communication and training Objective 1: We will invest in professional development opportunities for faculty, staff, and administrators to enhance work performance, broaden skills for leadership and career advancement, leverage academic programs, and allow for effective and clear career pathways for all employees Objective 2: We will improve recruiting, hiring, orientation and evaluation processes, and improve the customer service provided to all employees Objective 3: We will improve processes to increase responsiveness to and within colleges, limit barriers, and accelerate completion of required business processes and tasks Objective 4: We will use state-of-the-art technology to improve communication, including the development of an effective website that assists students, employees, and the community in interacting with the District Objective 5: We will revise all District policies and procedures to implement the Community College League of California model policy
71 13 III DSP: Proposed Goals Goal 5: We will improve fiscal integrity through enhanced resource development, institutional advancement, and effective use of existing resources Objective 1: We will enhance communication, support, and collaboration surrounding grant development processes for curricular and student support programs Objective 2: We will develop community partnerships that can assist the District in achieving its mission and enhance student success by providing additional support to students Objective 3: We will enhance the District and College foundations and improve alumni relations leading to the development of endowments from which additional resources for students and academic and support programs can be drawn
72 14 III DSP: Proposed Goals Goal 5 (continued): Objective 4: We will effectively use District and College resources and implement position control to support the ongoing improvements of academic and student support programs Objective 5: We will improve the resource allocation processes to be integrated with District strategic plan Objective 6: We will effectively plan and use resources to build and maintain District and College facilities and infrastructure in support of the academic and student support programs Objective 7: We will develop and implement districtwide standards in information technology, facilities, and human resources that apply to all colleges
73 15 IV DSP: Development of Metrics and Targets DSP measures are being recommended by District Research Committee (DRC) DSP will incorporate measures from existing accountability systems Data Down-Bottom Up Approach Preliminary targets will be developed by EPIE and DRC and go through a vetting process Improvements in momentum points needed to attain Board s completion goal (10 pct. pt. increase) will be estimated
74 16 V DSP: Final DSP Development DSP will incorporate: Input received from Board and college constituencies Recommendations resulting from evaluation of DSP DSP will include: An updated mission statement Goals and Objectives One or more metrics associated with each objective Key measures identified through accreditation and state and federal accountability systems Targets associated with each metric
75 17 VI DSP: Feedback and Approvals Finalize evaluation of DSP Continue to vet mission statement, plan, metrics, and targets through internal and external constituencies Continue to gather external input from business, education and civic groups Finalize goals, objectives, metrics, and targets in DSP Provide an opportunity for Board input/direction at Committee of the Whole Obtain College, SAC (Student Affairs Committee), Cabinet, and Board approvals (Sept.-October 2017)

76 Questions and Feedback 18
77 District Strategic Plan Alignment Goal Objective Proposed Measure Target Data Source Goal 1: We will increase college going rate for the Los Angeles region through enhanced outreach to community and educational partners and expanded access to academic programs that meet community and student needs. Objective 1: We will expand educational opportunities to local high school students by increasing the number of courses offered through dual enrollment. Objective 2: We, in partnership with Los Angeles Regional Adult Education Consortium will expand educational opportunities to nontraditional students through the expansion of noncredit adult education courses focused on skills improvement and vocational training. Objective 3: We will fully implement the LA College Promise by offering all graduates of the Los Angeles Unified School Districts and local charter schools free tuition and will seek to expand the promise to additional school districts and municipalities in the service area. Objective 4: We will increase access to those traditionally underrepresented in higher education by assisting students in gaining access to financial aid and ensuring all students receive orientation, multiple measures assessment and educational planning. Measure 1.1.1: Number of courses offered through dual enrollment Measure 1.1.2: Number and percentage of students who are dual enrolled Measure 1.2.1: Number of noncredit adult education courses Measure 1.2.2: Number and percentage of students who are enrolled in noncredit adult education courses Measure 1.3.1: Number and percentage of first year LA College Promise students Measure 1.3.2: Number of school districts served by LA College Promise program Measure 1.4.1: Number and percentage of students receiving financial aid Measure 1.4.2: Number and percentage of new students completing services in Assessment, Orientation, and Counseling SIS/PeopleSoft SIS/PeopleSoft SIS/PeopleSoft SIS/PeopleSoft SIS/PeopleSoft SIS/PeopleSoft DataMart SIS/PeopleSoft Page 1 of 12
78 Goal Objective Proposed Measure Target Data Source There was no direct measure of enrollment or college going rate for all students, perhaps consider adding a measure/objective to capture enrollments? Objective: Increase the college going rate for the Los Angeles Region Measure: Enrollment rate Measure: College going rate DataMart Enrollment and College Data Reports (CCCCO) Goal 2: We will develop a premier learning environment that places students as the first priority in the institution and effectively supports students in attaining educational goals. Objective 1: We will improve campus climate by improving student services, providing a safe learning environment and by establishing a standard for customer service. May need to clarify this objective to reflect what the focus/intent of this objective is? Included in the measures for this objective are items related to customer service and to safety on campus. Measure 2.1.1: Satisfaction rates with student services (Admissions and Records, Assessment and Placement Services, Associated Student Organization/Union, Athletics, Bookstore, Business and Fiscal Office, CalWORKs, Career and Employment Center, Child Care Center, College Sheriff, Disabled Student Programs and Services, EOPS or CARE, Financial Aid Office, Food Services, Foster Youth, General College Counseling Services, Health Center, Instructional or Computer Labs, International Student Program and Services, Library, On-campus Orientation, Online Orientation, PUENTE, Transfer Center, Tutoring Services, Umoja, and Veterans Office) May consider including only a selection of student services Measure 2.1.2: To what extent do you agree with the statement, I feel safe and secure at this college? Survey Options: Very Satisfied, Somewhat Satisfied, Not Satisfied, Not Applicable Student Survey Survey Options: Strongly Agree, Agree, Disagree, Strongly Disagree, Not Applicable Student Survey Page 2 of 12
79 Goal Objective Proposed Measure Target Data Source Objective 2: We will increase fulltime enrollment for all students through the development of flexible programs focused on working students and other students with barriers to attending traditionally scheduled programs. This objective may be more appropriate in Goal 1 that focuses on access to college programs. Objective 3: We will develop community partnerships that can assist the District in achieving its mission and enhance student success by providing additional support to students. Objective 4: We will create an environment that is respectful to the needs of diverse populations and that embraces the diversity of opinions found in a global society. Measure 2.1.3: To what extent do you agree with the statement, this college is free of safety hazards? Measure 2.1.4: To what extent do you agree with the statement, parking lots are safe, well lighted, and well maintained? Measure 2.2.1: Percentage of students enrolled full time Measure 2.2.3: Number of degree programs offered online Measure 2.2.4: Number of courses offered online Possible Measure 2.3.1?: Number and types of District partnerships Questions for Colleges: Who on campus or what office keeps track of these types of measures? Measure 2.4.1: At this college, how often do you engage with students who differ from you in terms of their religious beliefs, political opinions, or ethnic background? Measure 2.4.2: My experience at this college, in and out of class, has improved my ability to understand people of other racial, cultural, or Page 3 of 12 Survey Options: Strongly Agree, Agree, Disagree, Strongly Disagree, Not Applicable Survey Options: Strongly Agree, Agree, Disagree, Strongly Disagree, Not Applicable Survey Options: Often, Sometimes, Seldom, Never Survey Options: Very much, Quite a Bit, Some, Very Little Student Survey Student Survey DataMart SIS/PeopleSoft SIS/PeopleSoft This is a measure that no one, to our knowledge, keeps track of. Student Survey Student Survey
80 Goal Objective Proposed Measure Target Data Source religious backgrounds? Objective 5: We will review and refine curriculum and programs to ensure that they are responsive to student needs and meeting the economic, industry, and societal needs of the region. Measure 2.4.3: Campus Climate Questions. Rate the general climate towards students at your campus along the following dimension: Hostile to Friendly Measure 2.4.4: Campus Climate Questions. Rate the general climate towards students at your campus along the following dimension: Impersonal to Caring Measure 2.4.5: Campus Climate Questions. Rate the general climate towards students at your campus along the following dimension: Intolerant to Diversity to Tolerant to Diversity Measure 2.4.6: Campus Climate Questions. Rate the general climate towards students at your campus along the following dimension: Dangerous to Safe Measure 2.5.3: Number of archived courses Page 4 of 12 Survey Options: 1 (Hostile) to 6 (Friendly) Scale Survey Options: 1 (Impersonal) to 6 (Caring) Scale Survey Options: 1 (Intolerant to Diversity) to 6 (Tolerant to Diversity) Scale Survey Options: 1 (Dangerous) to 6 (Safe) Scale CalMHSA Survey (questions can be added to Student Survey) CalMHSA Survey (questions can be added to Student Survey) CalMHSA Survey (questions can be added to Student Survey) CalMHSA Survey (questions can be added to Student Survey) There are other measures that may help capture this objective, such as number of outreach events or other questions related to campus climate. Questions for campuses: Do you complete an annual campus climate survey? Is this measure similar to a goal in your college s strategic plan? Is there someone on campus who keeps track of campus events or outreach efforts? Measure 2.5.1: Number of new SIS/PeopleSoft courses offered Measure 2.5.2: Number of new SIS/PeopleSoft programs offered SIS/PeopleSoft
81 Goal Objective Proposed Measure Target Data Source This type of objective that suggests the completion of a progress (such as, review the curriculum) is difficult to measure as it seems to be a one-time event (as it is currently written). The measures listed do not directly capture the objective, but are attempting to capture something tangible that is a result of this objective and that is an ongoing. Objective 6: We will utilize facilities and technology to connect with the modern student and enhance regular and effective communication. Measure 2.5.4: Number of archived programs Questions for colleges: How frequently is this currently done? What is the process for reviewing the curriculum? Measure 2.6.1: In general, to what extend do you agree with the statement, my instructors adequately use available technology in and out of the classroom? Survey Options: Strongly Agree, Agree, Disagree, Strongly Disagree, I don t know SIS/PeopleSoft Student Survey Measure 2.6.2: How often do you use , social media, or text messaging to communicate with an instructor? Survey Options: Often, Sometimes, Seldom, Never, Not Applicable Student Survey Measure 2.6.3: How often do you use , social media, text messaging, or this college s website to keep informed about college events? Survey Options: Often, Sometimes, Seldom, Never, Not Applicable Student Survey This may be a good place to add a measure related to the implementation of PeopleSoft. Although it is unclear exactly what type of information we may have available, but perhaps number of student notifications sent or number of checklist items generated for students? Objective 7: We will employ effective Measure 2.7.1: Persistence rate, Fall to Spring SIS/PeopleSoft Page 5 of 12
82 Goal Objective Proposed Measure Target Data Source Goal 3: We will increase the student completion to exceed the state median and improve all milestones indicative of academic success. practices to increase student persistence and successful course completion. Objective 1: We will enhance academic and student support programs to decrease time to completion. Objective 2: We will increase completion of degrees and certificates. Objective 3: We will increase the number of students transferring to fouryear institutions. Objective 4: We will enhance business and industry partnerships to increase internship and employment opportunities for students. The intent of this object was unclear, so the measures chosen reflected CTE outcomes and not the creation of partnerships. Measure 2.7.2: Persistence rate, Fall to Fall Measure 2.7.3: Successful course completion rates Measure 3.1.1: Completion rates Measure 3.1.2: Median time to complete a degree Measure 3.1.3: Median time to complete a certificate Measure 3.2.1: Number of degrees conferred Measure 3.2.1: Number of certificates conferred Measure 3.3.1: Number of students who transfer to a 4-year institution Measure 3.4.1: Percentage of students completing more than eight units in CTE courses Measure 3.4.2: Number of CTE Skills Certificates awarded Measure 3.4.3: Number of CTE Certificates of Achievement awarded Measure 3.4.4: Number of students placed in jobs or internships after completing CTE programs Measure 3.4.5: Median percentage change in wages for student who Page 6 of 12 SIS/PeopleSoft IEPI Scorecard SIS/PeopleSoft SIS/PeopleSoft SIS/PeopleSoft SIS/PeopleSoft DataMart Scorecard Scorecard Scorecard Annual CTE Outcomes Survey Scorecard
83 Goal Objective Proposed Measure Target Data Source completed higher level CTE coursework (Skills Builder) Goal 4: We will improve organizational effectiveness through streamlined processes, minimized duplication of efforts and enhanced communication and training. Objective 1: We will invest in professional development opportunities for faculty, staff, and administrators to enhance work performance, broaden skills for leadership and career advancement, leverage academic programs, and allow for effective and clear career pathways for all employees. Objective 2: We improve recruiting, hiring, and evaluation processes to include enhanced customer service and the implementation of a comprehensive orientation, with a goal of becoming the employer of choice. The objective is hard to measure directly as it is related to improving a process. Included in the measures are only outcomes that can be tracked over time. We may need to explore other sources of information. Measure 4.1.1: Funds allocated and spent for professional development Measure 4.1.2: Tuition reimbursement funds distributed to employees Measure 4.1.3: Number of employees reclassified to a higher position I am unsure if this is possible or tracked Possible Measure 4.1.4?: Number and types of professional development opportunities for faculty, staff, and administrators Questions for Colleges: How are professional development opportunities tracked? Measure 4.2.1: Number of new hires Measure 4.2.2: Percentage of employee evaluations completed annually Human Resources Human Resources Human Resources This is a measure that no one, to our knowledge, keeps track of. Human Resources Human Resources Question for Colleges: Is there a survey done for people recently hired to LACCD? How do colleges get feedback about the hiring process? Page 7 of 12
84 Goal Objective Proposed Measure Target Data Source Objective 3: We will improve processes to increase responsiveness to and within colleges, limit barriers, and accelerate completion of required business processes and tasks. The measures only include measures that are available for the ESC, it is still unknown what information we can track for the colleges. Measure 4.3.1: The office responds to my queries or requests in a timely manner. (Chancellor s Office, Deputy Chancellor s Office, ADA Compliance Administration, Business Services, Diversity Programs and Services, Information Technology, Board of Trustees, Attendance Accounting, Curriculum Support, Dolores Huerta Institute, Institutional Effectiveness, Student Success, CalWORKs, Workforce Development, Accounts Payable, Budget and Management Analysis, Central Financial Aid, General Accounting, Internal Audit, Payroll, Bond Programs, Facilities, Real Estate Program, Employee Relations, Employment Services, Operations, Risk Management, Total Wellness Program, General Counsel, Personnel Commission) May consider including only a selection of ESC departments Measure 4.3.2: The office keeps me informed about the progress of my inquiries or requests. Measure 4.3.3: The office explains issues in terms that are understandable. Measure 4.3.4: I am satisfied with the performance of the office overall. Survey Options: Strongly Disagree, Disagree, Neutral, Agree, Strongly Agree Survey Options: Strongly Disagree, Disagree, Neutral, Agree, Strongly Agree Survey Options: Strongly Disagree, Disagree, Neutral, Agree, Strongly Agree Survey Options: Strongly Disagree, Disagree, Neutral, Agree, Strongly Agree ESC Services Survey ESC Services Survey ESC Services Survey ESC Services Survey Question for Colleges: Do you ask customer service questions during your program review? Objective 4: We will use current technology to improve communication, Measure 4.4.1: To what extent do you agree with the statement, I can easily Survey Options: Strongly Agree, Agree, Student Survey Page 8 of 12
85 Goal Objective Proposed Measure Target Data Source including the development of a dynamic web presence that assists students, employees and the community with collaborating with the District and developing a shared message. The objective is hard to measure directly, so measures that reflect a web presence were included. Objective 5: We will revise all District policies and procedures to implement the Community College League of California model policy. find the information I need on the college website? Measure 4.4.2: To what extent do you agree with the statement, information on the college website is current and accurate? Measure 4.4.3: Number of colleges with a social media presence (Facebook, Instagram, Twitter, etc.) and number of followers Disagree, Strongly Disagree Survey Options: Strongly Agree, Agree, Disagree, Strongly Disagree Student Survey Internet The measures above only reflect engagement with the student, but not with employees and communities collaborating with the District. There is no current way, that we are aware of, to measure this. Perhaps questions may be added to a staff survey or program reviews? Measure 4.5.1: Number of policies General Counsel reviewed in the current cycle The objective is hard to measure directly as the revision of policies and procedures appear to be a one-time event. Instead measures listed attempt to capture the outcomes of this review process. Measure 4.5.2: Policies were posted on-line and were easily accessible Internet Goal 5: We will enhance fiscal integrity through enhanced resource development, Objective 1: We will enhance communication, support and collaboration surrounding grant development processes in support of curricular and student support programs. Measure 5.1.1: Number and amount of grants awarded Finance Page 9 of 12
86 Goal Objective Proposed Measure Target Data Source institutional advancement, and effective use of existing resources. It is difficult to directly measure enhancements of communication, support, and collaboration. The measures listed are related to the number of grants received. Objective 2: We will enhance the District and College foundations and improve alumni relations leading to the development of endowments from which additional resources for students and academic and support programs can be drawn. Measure 5.1.2: Budget allocated for specially funded programs Measure 5.2.1: Foundation annual financial and income statement Finance Annual financial statement and specially funded programs Foundations It is difficult to directly measure enhancements of communication, support, and collaboration. The measures listed are related to the number of grants received. Objective 3: We will effectively use District and College resources and implement position control to support the ongoing improvements of academic and student support programs. It is difficult to measure effect use of resources, so the measures included reflect how funds are used relating to classes. Possible Measure 5.2.3?: Foundation activities related to endowment, fundraising, and scholarship award activity Question to Colleges: Do your foundations track their activities or events they host? Is that information available somewhere? Measure 5.3.4: Expenditures per FTE This is a measure that no one, to our knowledge, keeps track of. Final Budget Document Financial Accountability Measures Attendance & Accountability Financial Accountability Measures Page 10 of 12
87 Goal Objective Proposed Measure Target Data Source Objective 4: We will improve the resource allocation processes to be integrated with District strategic plan. Measure 5.3.5: Average class size Measure 5.3.6: Fund balance Databook- Accountability Final Budget Document Perhaps this objective is better placed in Goal 4, which focuses on organizational effectiveness. It is also difficult to measure a one-time event on an ongoing basis. What will the integrated strategic plan yield? This information may provide some insight on which measures to choose, unless the desired measure is simply the completion of the integrated District Strategic Plan. Objective 5: We will effectively plan and use resources to build and maintain District and College facilities and infrastructure in support of the academic and student support programs. It is difficult to measure effect use of resources, so the measures included will reflect the condition of facilities and a measure of facility utilization. Measure 5.5.1: To what extent do you agree with the statement, buildings are clean and well maintained? Measure 5.5.2: To what extent do you agree with the statement, restrooms are clean and well maintained? Measure 5.5.3: To what extent do you agree with the statement, the grounds and public areas are clean and well maintained? Survey Options: Strongly Agree, Agree, Disagree, Strongly Disagree, Not Applicable Survey Options: Strongly Agree, Agree, Disagree, Strongly Disagree, Not Applicable Survey Options: Strongly Agree, Agree, Disagree, Strongly Disagree, Not Applicable Student Survey Student Survey Student Survey Page 11 of 12
88 Goal Objective Proposed Measure Target Data Source Measure 5.5.4: To what extent do you agree with the statement, learning facilities (equipment, classrooms, and labs) are adequate and up-to-date? Measure 5.5.5: To what extent do you agree with the statement, there are enough labs and study spaces to meet my needs? Measure 5.5.6: The capitalization (cap) rate (the ratio of Net Operating Income to property asset value) Survey Options: Strongly Agree, Agree, Disagree, Strongly Disagree, Not Applicable Survey Options: Strongly Agree, Agree, Disagree, Strongly Disagree, Not Applicable Student Survey Student Survey Facilities Objective 6: We will develop and implement districtwide standards in information technology, facilities, and human resources that apply to all colleges. Possible Measure 5.6.1?: Accreditation status IEPI Website This comment is similar to one for Objective 4. Perhaps this objective is better placed in Goal 4, which focuses on organizational effectiveness. It is also difficult to measure a one-time event on an ongoing basis. What results will the new standards yield? This information may provide some insight on which measures to choose, unless the desired measure is simply the completion of the new, districtwide standards. Possible Measure 5.6.2?: Overall audit status IEPI Website Page 12 of 12
89 EDUCATIONAL PROGRAMS AND INSTITUTIONAL EFFECTIVENESS Executive Summary June 21, 2017 Institutional Effectiveness Partnership Initiative Year 3 Goals Framework: SB 852 and SB 860, passed in late 2014, required the California Community Colleges Chancellor s Office to develop, and for the Board of Governors of the California Community Colleges to adopt, a framework of indicators to measure student performance and outcomes, accreditation status, fiscal viability, and programmatic compliance with state and federal guidelines. This legislation was implemented through the CCCCO s Institutional Effectiveness Partnership Initiative, which developed specific measures for each performance area. The statutes also required colleges and districts to adopt short-term (1 year) and long-term (6 years) goals for all measures and, as a condition for receipt of Student Success and Support Program funds, to submit goals to the CCCCO by June 15, Targets for the following indicators were required for Year-Three : Accreditation Status, Fund Balance, Audit Findings, Successful Course Completion, and Unprepared Students. Targets for Successful Course Completion, Unprepared Students, and (optional) additional indicators were developed by the colleges following local planning and collegial consultation processes. Targets for Fund Balance and Audit Findings were developed and consulted district-wide and then presented to the Board s Budget and Finance Committee on April 19, Accreditation College 1 Year 6 Years June 2016 City Fully Accredited (FA) No Action Fully Accredited (FA) No Action Page 1 of 2 Fully Accredited (FA) Reaffirmed East FA No Action FA No Action FA Reaffirmed Harbor FA No Action FA No Action FA Reaffirmed Mission FA No Action FA No Action FA Reaffirmed Pierce FA No Action FA No Action FA Reaffirmed Southwest FA Sanction Removed FA No Action FA Warning Trade FA No Action FA No Action FA Reaffirmed Valley FA No Action FA No Action FA Reaffirmed West FA No Action FA No Action FA Reaffirmed Fiscal Viability Indicator 1 Year 6 Years Fund Balance 10% 10% 20.9% Audit Opinion Financial Statement Unmodified Unmodified Audit Findings State Compliance Unmodified Unmodified Federal Award / Compliance Unmodified Unmodified
90 Successful Course Completion Rate College 1 Year 6 Years City East Harbor Mission Pierce Southwest Trade Valley West Average Required College Choice (Indicator focused on Unprepared Students) Indicator College 1 Year 6 Years Completion Rate: Unprepared for College Remedial Rate: Math City Harbor Pierce Valley West Average East Mission Southwest Trade Average Optional College Choice Indicator College 1 Year 6 Years City Completion Rate: Overall Harbor Valley City Remedial Rate: English East Southwest Trade Remedial Rate: Math City Remedial Rate: ESL City Page 2 of 2

91 EDUCATIONAL PROGRAMS AND INSTITUTIONAL EFFECTIVENESS Institutional Effectiveness Partnership Initiative Year 3 Goals Framework: Summary of Year 3 Goals by College June 21, 2017
92 EDUCATIONAL PROGRAMS AND INSTITUTIONAL EFFECTIVENESS Institutional Effectiveness Partnership Initiative Year 3 Goals Framework: Los Angeles City College Indicator Term Goal Rationale for Goal Fully Accredited Short-Term: 1 year Reaffirm accreditation based on Spring 2016 visit Accreditation Status 1 No Action Fully Accredited Long-Term: 6 years Maintain accreditation status No Action Successful Course Completion Rate 2 Short-Term: 1 year 66.0% Highest of 5 year college average or last year rates Long-Term: 6 years 69.1% Highest of 5 year state average or last year college rates Required College Choice: Choose one student achievement measure and set goals Completion Rate: Unprepared for College 3 Short-Term: 1 year 34.9% Highest of 5 year college average or last year rates Long-Term: 6 years 40.5% Highest of 5 year state average or last year college rates Indicator Term Goal Rationale for Goal Optional College Goals: Choose from list of optional goals or develop any indicator and provide a narrative of the result Completion Rate: College Overall 3 Short-Term: 1 year 36.9% Highest of 5 year college average or last year rates Long-Term: 6 years 48.2% Highest of 5 year state average or last year college rates Remedial Rate: Math 3 Short-Term: 1 year 28.8% Highest of 5 year college average or last year rates Long-Term: 6 years 30.7% Highest of 5 year state average or last year college rates Remedial Rate: English 3 Short-Term: 1 year 44.9% Highest of 5 year college average or last year rates Long-Term: 6 years 44.9% Highest of 5 year state average or last year college rates Remedial Rate: ESL 3 Short-Term: 1 year 22.7% Highest of 5 year college average or last year rates Long-Term: 6 years 27.2% Highest of 5 year state average or last year college rates Approved by: COMPASS (05/22/2017); SPC (05/24/2017) 1 Based on ACCJC status as reported at 2, 3 Based on years data provided by CCCCO Datamart and populated at
93 EDUCATIONAL PROGRAMS AND INSTITUTIONAL EFFECTIVENESS Institutional Effectiveness Partnership Initiative Year 3 Goals Framework: East Los Angeles College Indicator Term Goal Rationale for Goal Accreditation Status 1 Short-Term: 1 year Fully Accredited No Action Reaffirm accreditation based on Spring 2016 visit. Long-Term: 6 years Fully Accredited No Action Maintain accredited status. Short-Term: 1 year 72% With the previous short-term goal met, the college revised Successful Course Completion Rate 2 both goals up 1% with the intention of progressively Long-Term: 6 years 75% improving on this measure. Required College Choice: Choose one student achievement measure and set goals Short-Term: 1 year 34.2% The short-term goal was revised to the overall state average for this measure. Remedial Rate: Math 3 This measure was held at 35% as the college evaluates its Long-Term: 6 years 35% innovative programs related to Math, such as the First Year Experience and Math Advancement Program. Indicator Term Goal Rationale for Goal Optional College Goals: Choose from list of optional goals or develop any indicator and provide a narrative of the result Short-Term: 1 year 46.9% The short-term goal was revised to the overall state average for this measure. The College s English Department has implemented a Remedial Rate: English 3 number of innovative practices over the last few years and is Long-Term: 6 years 48% currently exploring how to accelerate students through the sequence. This measure was set well above the outcomes from the past five years. 1 Based on ACCJC status as reported at 2, 3 Based on years data provided by CCCCO Datamart and populated at
94 EDUCATIONAL PROGRAMS AND INSTITUTIONAL EFFECTIVENESS Institutional Effectiveness Partnership Initiative Year 3 Goals Framework: Los Angeles Harbor College Indicator Term Goal Rationale for Goal Fully Accredited - Short-Term: 1 year Reaffirm accreditation based on Spring 2016 visit Accreditation Status 1 No Action Fully Accredited - Long-Term: 6 years Maintain accredited status No Action Successful Course Completion Rate 2 Short-Term: 1 year 66.2 % Institution-Set Standard for Long-Term: 6 years 72.0 % Institution-Set Goal set for Required College Choice: Choose one student achievement measure and set goals Completion Rate: Unprepared for College 3 Short-Term: 1 year 35.8 % 5-year average - Harbor Student Success Scorecard Long-Term: 6 years 40.5 % 5-year average - Statewide Student Success Scorecard Indicator Term Goal Rationale for Goal Optional College Goals: Choose from list of optional goals or develop any indicator and provide a narrative of the result Completion Rate - Overall 3 Short-Term: 1 year 41.0 % 5-year average - Harbor Student Success Scorecard Long-Term: 6 years 48.2 % 5-year average - Statewide Student Success Scorecard 1 Based on ACCJC status as reported at 2, 3 Based on years data provided by CCCCO Datamart and populated at
95 Accreditation Status 1 EDUCATIONAL PROGRAMS AND INSTITUTIONAL EFFECTIVENESS Institutional Effectiveness Partnership Initiative Year 3 Goals Framework: Los Angeles Mission College Indicator Term Goal Rationale for Goal Short-Term: 1 year Long-Term: 6 years Fully Accredited No Action Fully Accredited No Action Short-Term: 1 year 65% LAMC's accreditation was reaffirmed following the Spring 2016 visit, with a follow-up report due in October The College plans to once again have its accreditation reaffirmed after the submission of this follow-up report. According to the 7-year accreditation cycle, LAMC will be visited by the ACCJC again in spring 2023 for a comprehensive review. The College plans to have its accreditation reaffirmed as a result of that visit. In three out of the last five years (including the most recent year), LAMC s successful course completion rate has been below 65%. Thus the College feels that attaining 65% on this measure (the next integer percentage point) is a reasonable one-year goal. Last year, as part of the College s review of its performance Successful Course Completion Rate 2 on its institution-set standards, LAMC set a goal to achieve a 67% successful course completion rate (the District s Long-Term: 6 years 67% average rate) within 6 years. This year, the College approved continuation of this 6-year goal of 67%, as the College s performance on this indicator has only increased 0.1% in the last year and thus the College feels that a 2% increase over six years is a reasonable goal. Required College Choice: Choose one student achievement measure and set goals Over the last five cohort years, this rate has been increasing Remedial Rate: Math 3 Short-Term: 1 year 33% for LAMC (it is currently at 32.0%). The College has attained its previous one-year goal (of 30%) and anticipates that its performance will continue to increase due to its 1 Based on ACCJC status as reported at 2, 3 Based on years data provided by CCCCO Datamart and populated at
96 EDUCATIONAL PROGRAMS AND INSTITUTIONAL EFFECTIVENESS Indicator Term Goal Rationale for Goal continued efforts to accelerate the remedial math sequence and to make math course scheduling and materials more convenient for students. The College has set a revised oneyear goal of 33%, which reflects a 1% increase over its current performance and a 3% increase over its prior oneyear goal. Parallel to its planned 2% increase over its one-year goal in successful course completion rate in six years, LAMC previously set a goal to increase an additional 2% in its remedial math rate in six years over its one-year goal. This year, after thorough consultation with the math department, the College again approved setting its new six-year goal on this indicator to be a 2% increase over its new one-year goal. While it is anticipated that some students will receive higher math placements due to the Multiple Measures Assessment Project (MMAP) and that this may affect the remedial math rate in the future, we are not yet sure of exactly how this will Remedial Rate: Math 3 Long-Term: 6 years 35% affect the remedial math rate indicator. For example, while students may place into higher levels of remedial math due to MMAP (which could lead to increases in this rate because these students will have shorter math sequences to complete), these students may be less successful at higher levels of math due to having less foundational coursework (which could negatively impact this rate). Thus for now, while the effects of the MMAP are still being determined and the optimal parameters for MMAP are still being established for LAMC s student population, the College has set a conservative goal to increase 3% over its current performance on this indicator over the next six years. 1 Based on ACCJC status as reported at 2, 3 Based on years data provided by CCCCO Datamart and populated at
97 EDUCATIONAL PROGRAMS AND INSTITUTIONAL EFFECTIVENESS Institutional Effectiveness Partnership Initiative Year 3 Goals Framework: Pierce College Indicator Term Goal Rationale for Goal Accreditation Status 1 Short-Term: 1 year Fully Accredited No Action Maintain current status. Long-Term: 6 years Fully Accredited No Action Maintain current status. Short-Term: 1 year 68.4% Increase by 0.5 percent from the Fall 2016 baseline rate of 68.1 percent. This goal s growth rate mirrors the annual course success growth rate established in the LAPC Strategic Successful Course Completion Rate 2 Master Plan. Increase by 0.5 percent each year for an overall increase of Long-Term: 6 years 70.2% 1.8 percent from the fall 2016 baseline rate of 68.1 percent. This goal s growth rate mirrors the annual course success growth rate established in the LAPC Strategic Master Plan. Completion Rate: Unprepared for College 3 Required College Choice: Choose one student achievement measure and set goals Short-Term: 1 year 50% Long-Term: 6 years 55.2% Increase by two percent from the baseline rate of 49 percent. This goal s growth rate mirrors the annual unprepared for college completion growth rate established in the LAPC Strategic Master Plan. Increase by two percent each year for an overall increase of 5.2% from the baseline rate of 49 percent. This goal s growth rate mirrors the annual unprepared for college completion growth rate established in the LAPC Strategic Master Plan. 1 Based on ACCJC status as reported at 2, 3 Based on years data provided by CCCCO Datamart and populated at
98 EDUCATIONAL PROGRAMS AND INSTITUTIONAL EFFECTIVENESS Institutional Effectiveness Partnership Initiative Year 3 Goals Framework: Los Angeles Southwest College Indicator Term Goal Rationale for Goal Accreditation Status 1 Short-Term: 1 year Fully Accredited - Sanction Removed Accreditation based on Spring 2016 visit. Long-Term: 6 years Fully Accredited - No Action Maintain accredited status. Successful Course Completion Rate 2 Short-Term: 1 year 61% Basic Skills (BS) Transformation Grant will support student success through intervention programs. Long-Term: 6 years 66% Institutionalization of FYE program and BS Transformation Grant. Required College Choice: Choose one student achievement measure and set goals Remedial Rate: Math 3 Short-Term: 1 year 16.5% BS Transformation Grant, creation of Developmental Ed Pathways, more student support services. Long-Term: 6 years 19.0% BS Transformation Grant, creation of Developmental Ed Pathways, more student support services. Indicator Term Goal Rationale for Goal Optional College Goals: Choose from list of optional goals or develop any indicator and provide a narrative of the result BS Transformation Grant, creation of Developmental Ed Short-Term: 1 year 25.5% Remedial Rate: English 3 Pathways, more student support services. BS Transformation Grant, creation of Developmental Ed Long-Term: 6 years 28.0% Pathways, more student support services. 1 Based on ACCJC status as reported at 2, 3 Based on years data provided by CCCCO Datamart and populated at
99 EDUCATIONAL PROGRAMS AND INSTITUTIONAL EFFECTIVENESS Institutional Effectiveness Partnership Initiative Year 3 Goals Framework: Los Angeles Trade-Technical College Indicator Term Goal Rationale for Goal Fully Accredited- Short-Term: 1 year Accreditation Status 1 No Action Fully Accredited- Long-Term: 6 years Maintain accredited status No Action Reaffirm accreditation based on Spring 2016 visit and follow-up report Successful Course Completion Rate 2 Short-Term: 1 year 69% 0.7% increase from current rate of 68.3%. Long-Term: 6 years 75% % increase each year to reach 75% in year 6 Required College Choice: Choose one student achievement measure and set goals 12.4% is 0.5% higher than 2017 Scorecard rate (11.9%); this Short-Term: 1 year 12.4% new Year 1 goal originally was set as a goal for 2021 when IEPI goals first reported Remedial Rate: Math 3 New goal represents an increase of 0.5% each year (as Long-Term: 6 years 14.9% decided during goal setting), to reach 14.9% in Year 6; revised goal is higher than previous goal (as established for and ) Indicator Term Goal Rationale for Goal Optional College Goals: Choose from list of optional goals or develop any indicator and provide a narrative of the result 29.8% is 0.5% higher than 2017 Scorecard rate (29.3%); this Short-Term: 1 year 29.8% short-term goal exceeds previous Year 6 goal set in Remedial Rate: English 3 Long-Term: 6 years 32.3% New goal calculated on an increase of 0.5% each year (as decided during goal setting); revised goal is higher than previous goal (as established for and ) Note: One-year as projected to be reported on 2018 Scorecard; Six-year goals Scorecard, respectively as indicated by IEPI Fact Sheet 1 Based on ACCJC status as reported at 2, 3 Based on years data provided by CCCCO Datamart and populated at
100 EDUCATIONAL PROGRAMS AND INSTITUTIONAL EFFECTIVENESS Institutional Effectiveness Partnership Initiative Year 3 Goals Framework: Los Angeles Valley College Indicator Term Goal Rationale for Goal Accreditation Status 1 Short-Term: 1 year Fully Accredited - No Action Long-Term: 6 years Fully Accredited - No Action Short-Term: 1 year 69.22% In alignment with the LAVC Educational Master Plan, the college is focused on improving the course completion rate and progress through momentum points in order to achieve those goals. Goal is higher than three out of five years of data. We have Successful Course Completion Rate 2 trended down the last two years. Methodology - current plus ½ standard deviation annually (.42% annually) Long-Term: 6 years 71.32% Current campus initiatives are being scaled to increase early interventions and place students on the appropriate pathway through assessment, orientation and appropriate education plans. Goal is higher than all prior years of data. Required College Choice: Choose one student achievement measure and set goals Completion Rate: Unprepared for College 3 Short-Term: 1 year 38.09% 1 Based on ACCJC status as reported at 2, 3 Based on years data provided by CCCCO Datamart and populated at In alignment with the LAVC Educational Master Plan, the Basic Skills Initiative, the student Equity Plan and SSSP Plan, the college is focused on improving the completion rate and progress through momentum points for underprepared populations. Goal is higher than three out of five years of reported data. Outcomes have fluctuated in recent years, with the most recent year being an outlier. Methodology - average plus ⅓ standard deviation each year (.38% annually using prior sd).
101 EDUCATIONAL PROGRAMS AND INSTITUTIONAL EFFECTIVENESS Indicator Term Goal Rationale for Goal Current campus initiatives are being scaled to increase early interventions and place students on the appropriate pathway Long-Term: 6 years 40.01% through assessment, orientation and appropriate education plans. Goal is higher than four of five reported years of data. Indicator Term Goal Rationale for Goal Optional College Goals: Choose from list of optional goals or develop any indicator and provide a narrative of the result In alignment with the LAVC Educational Master Plan, the college is focused on improving the overall completion rate and progress through momentum points in order to achieve Completion Rate - Overall 3 Short-Term: 1 year 44% those goals. Goal is higher than 3 of five years of reported data. Outcomes have fluctuated in recent years, with the most recent year being an outlier. Methodology - average plus ½ standard deviation each year (.23% annually using prior sd.) Long-Term: 6 years 45.14% Goal is higher than four of five years of reported data. Based on the data and analysis, some members of the College community have concerns about reaching and maintaining these goals. In particular, Academic Senate and AFT Faculty Guild expressed the following concerns: We have set our aspirational goals exceptionally high. We recognize that gains this large are extremely unlikely, even with our dedication to improving outcomes and efforts to achieve large gains (such as through our recently adopted statistic pathway). In fact, we teach our students that these kinds of extraordinary differences should always be questioned, as they are extremely rare in real-life situations. Outcomes of this magnitude require additional resources and funds that allow for wide-ranging improvements in services (e.g. smaller class sizes, imbedded tutors and supplemental instruction, and comprehensive counseling). We are not opposed to setting aspirational goals, but we must acknowledge that they need to be pursued within an evidence-based framework, which includes additional monetary and human resources. 1 Based on ACCJC status as reported at 2, 3 Based on years data provided by CCCCO Datamart and populated at
102 EDUCATIONAL PROGRAMS AND INSTITUTIONAL EFFECTIVENESS Institutional Effectiveness Partnership Initiative Year 3 Goals Framework: West Los Angeles College Indicator Term Goal Rationale for Goal Accreditation Status 1 Short-Term: 1 year Fully Accredited - No Action Maintain accredited status Long-Term: 6 years Fully Accredited - No Action Maintain accredited status Successful Course Completion Rate 2 Short-Term: 1 year 67% Examination of 10 years of data; comparison with district, peer group rates Long-Term: 6 years 71% Examination of 10 years of data; comparison with district, peer group rates Required College Choice: Choose one student achievement measure and set goals Completion Rate: Unprepared for College 2 Short-Term: 1 year 36% Examination of 10 years of data; comparison with district, peer group rates Long-Term: 6 years 41% Examination of 10 years of data; comparison with district, peer group rates 1 Based on ACCJC status as reported at 2, 3 Based on years data provided by CCCCO Datamart and populated at
103 file:///c:/users/pearlmy/appdata/local/temp/da585fbd-b e-9fd1-8d683ce5adfb.h... Page 1 of 3 6/28/2017 Los Angeles Community College District District Planning and Accreditation Committee Self-Evaluation Survey 2014 Please help the Committee by providing feedback on how well it is addressing issues related to district-wide planning, institutional effectiveness, accountability, and accreditation efforts. Coordinate college and district-wide planning activities of the colleges related to Strategic planning Coordinate college and district-wide planning activities of the colleges related to Educational master planning Coordinate college and district-wide planning activities of the colleges related to Program review Facilitate sharing effective practices related to institutional effectiveness and planning Coordinate district-wide accreditation efforts Formulate and revise the District Strategic Plan Assess effectiveness of the District Strategic Plan Coordinate Board Institutional Effectiveness and accountability reports Did the Committee successfully fulfill each of its stated charges during the past year? Yes No What obstacles or problems have hindered Committee function?
104 file:///c:/users/pearlmy/appdata/local/temp/da585fbd-b e-9fd1-8d683ce5adfb.h... Page 2 of 3 6/28/2017 What changes should be made in Committee composition, function, or charge to enhance its effectiveness? What additional goals should the Committee establish for the coming year? Reset Submit Los Angeles Community College District District Planning and Accreditation Committee Self-Evaluation Survey 2014 Please enter your username: Please enter your password: Reset Login Los Angeles Community College District District Planning and Accreditation Committee Self-Evaluation Survey 2014
105 file:///c:/users/pearlmy/appdata/local/temp/da585fbd-b e-9fd1-8d683ce5adfb.h... Page 3 of 3 6/28/2017 Thank you for completing this survey. District Planning and Accreditation Committee website
106
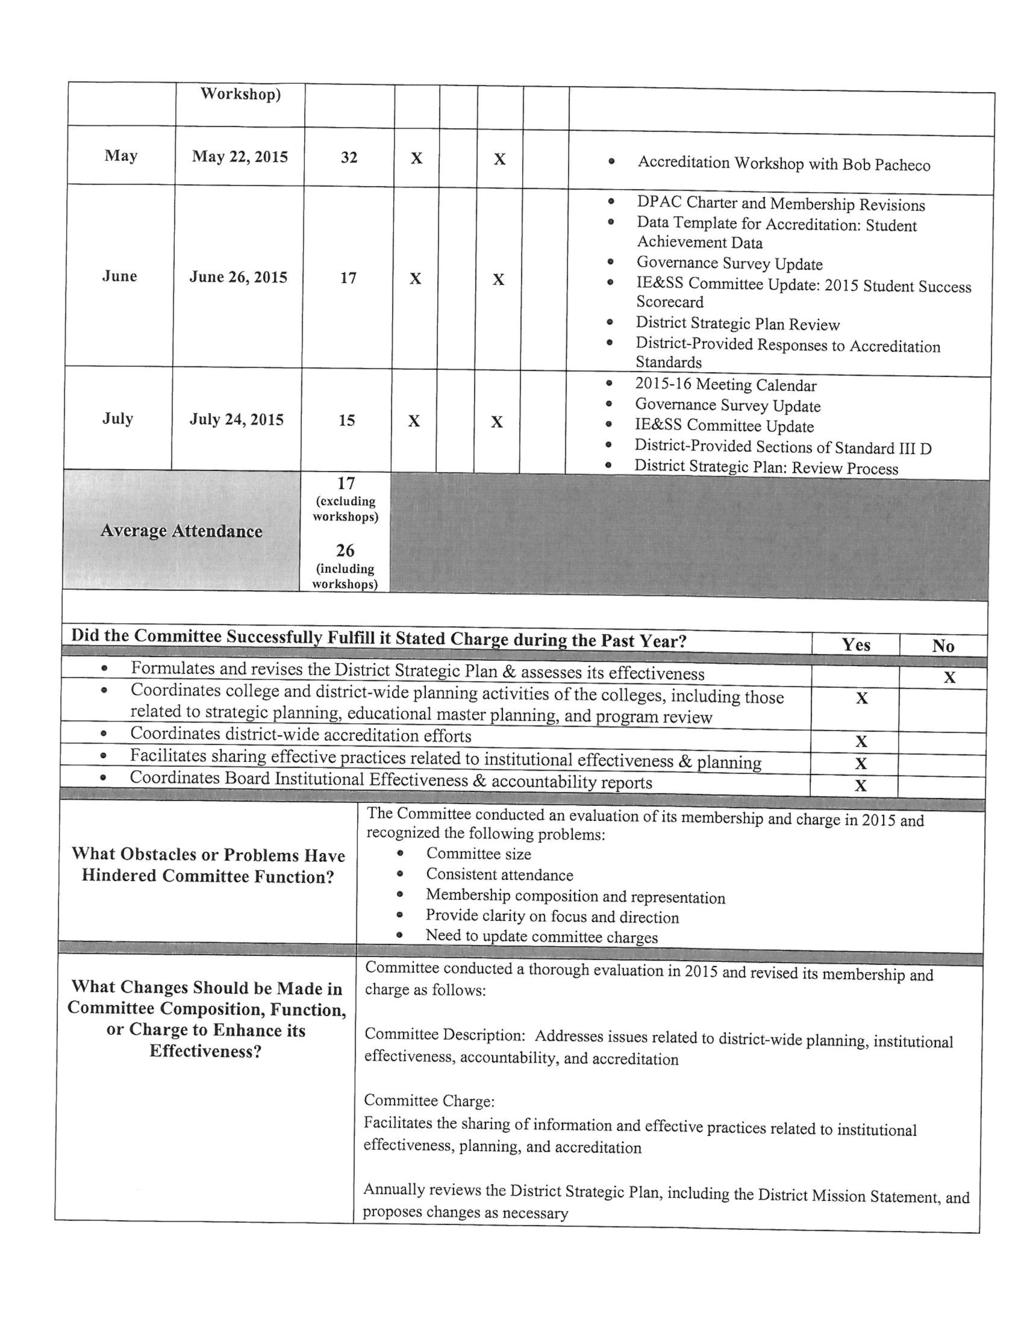
107
State Budget Update February 2016
 State Budget Update February 2016 2016-17 BUDGET TRAILER BILL SUMMARY The Budget Trailer Bill Language is the implementing statute needed to effectuate the proposals in the annual Budget Bill. The Governor
AB104 Adult Education Block Grant. Performance Year:
 AB104 Adult Education Block Grant Performance Year: 2015-2016 Funding source: AB104, Section 39, Article 9 Version 1 Release: October 9, 2015 Reporting & Submission Process Required Funding Recipient Content
Volunteer State Community College Strategic Plan,
 Volunteer State Community College Strategic Plan, 2005-2010 Mission: Volunteer State Community College is a public, comprehensive community college offering associate degrees, certificates, continuing
Executive Summary. Laurel County School District. Dr. Doug Bennett, Superintendent 718 N Main St London, KY
 Dr. Doug Bennett, Superintendent 718 N Main St London, KY 40741-1222 Document Generated On January 13, 2014 TABLE OF CONTENTS Introduction 1 Description of the School System 2 System's Purpose 4 Notable
California s Bold Reimagining of Adult Education. Meeting of the Minds September 6, 2017
 California s Bold Reimagining of Adult Education Meeting of the Minds September 6, 2017 Adult Education in California Historically CDE State Run Program $750M (est) Ten Program Areas K12 Districts / County
State Improvement Plan for Perkins Indicators 6S1 and 6S2
 State Improvement Plan for Perkins Indicators 6S1 and 6S2 Submitted by: Dr. JoAnn Simser State Director for Career and Technical Education Minnesota State Colleges and Universities St. Paul, Minnesota
California Professional Standards for Education Leaders (CPSELs)
") Standard 1 STANDARD 1: DEVELOPMENT AND IMPLEMENTATION OF A SHARED VISION Education leaders facilitate the development and implementation of a shared vision of learning and growth of all students. Element
Standard 1 STANDARD 1: DEVELOPMENT AND IMPLEMENTATION OF A SHARED VISION Education leaders facilitate the development and implementation of a shared vision of learning and growth of all students. Element
This Access Agreement is for only, to align with the WPSA and in light of the Browne Review.
 University of Essex Access Agreement 2011-12 The University of Essex Access Agreement has been updated in October 2010 to include new tuition fee and bursary provision for 2011 entry and account for the
Program Change Proposal:
 Program Change Proposal: Provided to Faculty in the following affected units: Department of Management Department of Marketing School of Allied Health 1 Department of Kinesiology 2 Department of Animal
VOL VISION 2020 STRATEGIC PLAN IMPLEMENTATION
 VOL VISION 2020 STRATEGIC PLAN IMPLEMENTATION CONTENTS Vol Vision 2020 Summary Overview Approach Plan Phase 1 Key Initiatives, Timelines, Accountability Strategy Dashboard Phase 1 Metrics and Indicators
Intervention in Struggling Schools Through Receivership New York State. May 2015
 Intervention in Struggling Schools Through Receivership New York State May 2015 The Law - Education Law Section 211-f and Receivership In April 2015, Subpart E of Part EE of Chapter 56 of the Laws of 2015
University of Essex Access Agreement
 University of Essex Access Agreement Updated in August 2009 to include new tuition fee and bursary provision for 2010 entry 1. Context The University of Essex is academically a strong institution, with
Envision Success FY2014-FY2017 Strategic Goal 1: Enhancing pathways that guide students to achieve their academic, career, and personal goals
 Strategic Goal 1: Enhancing pathways that guide students to achieve their academic, career, and personal goals Institutional Priority: Improve the front door experience Identify metrics appropriate to
Data Glossary. Summa Cum Laude: the top 2% of each college's distribution of cumulative GPAs for the graduating cohort. Academic Honors (Latin Honors)
") Institutional Research and Assessment Data Glossary This document is a collection of terms and variable definitions commonly used in the universities reports. The definitions were compiled from various
Institutional Research and Assessment Data Glossary This document is a collection of terms and variable definitions commonly used in the universities reports. The definitions were compiled from various
This Access Agreement is for only, to align with the WPSA and in light of the Browne Review.
 University of Essex Access Agreement 2011-12 The University of Essex Access Agreement has been updated in October 2010 to include new tuition fee and bursary provision for 2011 entry and account for the
Public School Choice DRAFT
 Public School Choice DRAFT Why Public School Choice? The educational ecosystem continues to see different types of schools and instructional choices being offered by private schools, charter organizations,
SUPPORTING COMMUNITY COLLEGE DELIVERY OF APPRENTICESHIPS
 The apprenticeship system is evolving to meet the needs of today s and tomorrow s economy. The two significant goals that have emerged involve broadening the roles of apprenticeship partners and increasing
Teach For America alumni 37,000+ Alumni working full-time in education or with low-income communities 86%
 About Teach For America Teach For America recruits, trains, and supports top college graduates and professionals who make an initial commitment to teach for two years in urban and rural public schools
Basic Skills Plus. Legislation and Guidelines. Hope Opportunity Jobs
 Basic Skills Plus Legislation and Guidelines Hope Opportunity Jobs Page 2 of 7 Basic Skills Plus Legislation When the North Carolina General Assembly passed the 2010 budget bill, one of their legislative
TACOMA HOUSING AUTHORITY
 TACOMA HOUSING AUTHORITY CHILDREN s SAVINGS ACCOUNT for the CHILDREN of NEW SALISHAN, Tacoma, WA last revised July 10, 2014 1. SUMMARY The Tacoma Housing Authority (THA) plans to offer individual development
LATTC Program Review Instructional -Department Level
 LATTC Program Review 2011-2012 Instructional -Department Level Department: Apprenticeship Participated Faculty/Staff: William Elarton-Apprenticeship Director LATTC Bob Hudachek - JATC 501 Operating Engineers
Los Angeles City College Student Equity Plan. Signature Page
 Los Angeles City College Student Equity Plan Signature Page Los Angeles Community College Los Angeles City College President, Board of Trustees Date District Chancellor: College President: Academic Senate
Los Angeles Healthcare Competencies to Careers Consortium (LA H3C) Overview. Michelle Cheang, Dean Los Angeles Trade- Technical College
 Overview. Michelle Cheang, Dean Los Angeles Trade- Technical College") Los Angeles Healthcare Competencies to Careers Consortium (LA H3C) Overview Michelle Cheang, Dean Los Angeles Trade- Technical College Today s Agenda Program Strategies & Deliverables Consortium Outcome
Los Angeles Healthcare Competencies to Careers Consortium (LA H3C) Overview Michelle Cheang, Dean Los Angeles Trade- Technical College Today s Agenda Program Strategies & Deliverables Consortium Outcome
The University of North Carolina Strategic Plan Online Survey and Public Forums Executive Summary
 The University of North Carolina Strategic Plan Online Survey and Public Forums Executive Summary The University of North Carolina General Administration January 5, 2017 Introduction The University of
Graduation Initiative 2025 Goals San Jose State
 Graduation Initiative 2025 Goals San Jose State Metric 2025 Goal Most Recent Rate Freshman 6-Year Graduation 71% 57% Freshman 4-Year Graduation 35% 10% Transfer 2-Year Graduation 36% 24% Transfer 4-Year
Governors and State Legislatures Plan to Reauthorize the Elementary and Secondary Education Act
 Governors and State Legislatures Plan to Reauthorize the Elementary and Secondary Education Act Summary In today s competitive global economy, our education system must prepare every student to be successful
Title II of WIOA- Adult Education and Family Literacy Activities 463 Guidance
 Title II of WIOA- Adult Education and Family Literacy Activities 463 Guidance This narrative is intended to provide guidance to all parties interested in the Oklahoma AEFLA competition to be held in FY18
Math Pathways Task Force Recommendations February Background
 Math Pathways Task Force Recommendations February 2017 Background In October 2011, Oklahoma joined Complete College America (CCA) to increase the number of degrees and certificates earned in Oklahoma.
State Parental Involvement Plan
 A Toolkit for Title I Parental Involvement Section 3 Tools Page 41 Tool 3.1: State Parental Involvement Plan Description This tool serves as an example of one SEA s plan for supporting LEAs and schools
Northwest-Shoals Community College - Personnel Handbook/Policy Manual 1-1. Personnel Handbook/Policy Manual I. INTRODUCTION
 Northwest-Shoals Community College - Personnel Handbook/Policy Manual 1-1 Personnel Handbook/Policy Manual I. INTRODUCTION Northwest-Shoals Community College - Personnel Handbook/Policy Manual 1-2 I. INTRODUCTION
ÉCOLE MANACHABAN MIDDLE SCHOOL School Education Plan May, 2017 Year Three
 ÉCOLE MANACHABAN MIDDLE SCHOOL 2015-2019 School Education Plan May, 2017 Year Three MESSAGE FROM SCHOOL PRINCIPAL In support of Rocky View Schools vision to ensure students are literate and numerate and
Access Center Assessment Report
 Access Center Assessment Report The purpose of this report is to provide a description of the demographics as well as higher education access and success of Access Center students at CSU. College access
GRADUATE STUDENTS Academic Year
 Financial Aid Information for GRADUATE STUDENTS Academic Year 2017-2018 Your Financial Aid Award This booklet is designed to help you understand your financial aid award, policies for receiving aid and
Strategic Plan SJI Strategic Plan 2016.indd 1 4/14/16 9:43 AM
 Strategic Plan SJI Strategic Plan 2016.indd 1 Plan Process The Social Justice Institute held a retreat in December 2014, guided by Starfish Practice. Starfish Practice used an Appreciative Inquiry approach
Mary Washington 2020: Excellence. Impact. Distinction.
 1 Mary Washington 2020: Excellence. Impact. Distinction. Excellence in the liberal arts has long been the bedrock of the University s educational philosophy. UMW boldly asserts its belief that the best
Barstow Community College NON-INSTRUCTIONAL
 Barstow Community College NON-INSTRUCTIONAL PROGRAM REVIEW (Refer to the Program Review Handbook when completing this form) SERVICE AREA/ ADMINISTRATIVE UNIT: Transfer and Career Planning Center Academic
Xenia Community Schools Board of Education Goals. Approved May 12, 2014
 Xenia Community Schools of Education Goals Approved May 12, 2014 Pro Tem Priorities Improved Communication Goals Strategies Measureable Actions Timing *Clarify and understand who we serve, how we serve
Trends & Issues Report
 Trends & Issues Report prepared by David Piercy & Marilyn Clotz Key Enrollment & Demographic Trends Options Identified by the Eight Focus Groups General Themes 4J Eugene School District 4J Eugene, Oregon
2015 Annual Report to the School Community
 2015 Annual Report to the School Community Narre Warren South P-12 College School Number: 8839 Name of School Principal: Rob Duncan Name of School Council President: Greg Bailey Date of Endorsement: 23/03/2016
STUDENT EXPERIENCE a focus group guide
 STUDENT EXPERIENCE a focus group guide September 16, 2016 Overview Participation Thank you for agreeing to participate in an Energizing Eyes High focus group session. We have received research ethics approval
The following resolution is presented for approval to the Board of Trustees. RESOLUTION 16-
 1. Adoption of Wright State 2016 Campus Completion Plan The following resolution is presented for approval to the Board of Trustees. RESOLUTION 16- WHEREAS, Section 3345.81 of the Ohio Revised Code requires
Self Assessment. InTech Collegiate High School. Jason Stanger, Director 1787 Research Park Way North Logan, UT
 Jason Stanger, Director 1787 Research Park Way North Logan, UT 84341-5600 Document Generated On June 13, 2016 TABLE OF CONTENTS Introduction 1 Standard 1: Purpose and Direction 2 Standard 2: Governance
Core Strategy #1: Prepare professionals for a technology-based, multicultural, complex world
 Wright State University College of Education and Human Services Strategic Plan, 2008-2013 The College of Education and Human Services (CEHS) worked with a 25-member cross representative committee of faculty
EDUCATIONAL ATTAINMENT
 EDUCATIONAL ATTAINMENT By 2030, at least 60 percent of Texans ages 25 to 34 will have a postsecondary credential or degree. Target: Increase the percent of Texans ages 25 to 34 with a postsecondary credential.
Braiding Funds. Registered Apprenticeship
 Braiding Funds to Support Registered Apprenticeship Michigan Works! Annual Conference Mt. Pleasant, MI October 3, 2016 Today s Session Moderator: Marcia Black-Watson, Michigan Talent Investment Agency
Massachusetts Department of Elementary and Secondary Education. Title I Comparability
 Massachusetts Department of Elementary and Secondary Education Title I Comparability 2009-2010 Title I provides federal financial assistance to school districts to provide supplemental educational services
Early Warning System Implementation Guide
 Linking Research and Resources for Better High Schools betterhighschools.org September 2010 Early Warning System Implementation Guide For use with the National High School Center s Early Warning System
Strategic Planning Guide
 Chandler-Gilbert Estrella Mountain GateWay Glendale Mesa Paradise Valley Phoenix Rio Salado Scottsdale South Mountain Maricopa Skill Center SouthWest Skill Center Strategic Planning Guide 1 Table of Contents
Master of Science (MS) in Education with a specialization in. Leadership in Educational Administration
 in Education with a specialization in. Leadership in Educational Administration") Master of Science (MS) in Education with a specialization in Leadership in Educational Administration Effective October 9, 2017 Master of Science (MS) in Education with a specialization in Leadership in
Master of Science (MS) in Education with a specialization in Leadership in Educational Administration Effective October 9, 2017 Master of Science (MS) in Education with a specialization in Leadership in
FORT HAYS STATE UNIVERSITY AT DODGE CITY
 FORT HAYS STATE UNIVERSITY AT DODGE CITY INTRODUCTION Economic prosperity for individuals and the state relies on an educated workforce. For Kansans to succeed in the workforce, they must have an education
Basic Skills Initiative Project Proposal Date Submitted: March 14, Budget Control Number: (if project is continuing)
") Basic Skills Initiative Project Proposal 2016-2017 Date Submitted: March 14, 2016 Check One: New Proposal: Continuing Project: X Budget Control Number: (if project is continuing) Control # 87-413 - EOPS
Basic Skills Initiative Project Proposal 2016-2017 Date Submitted: March 14, 2016 Check One: New Proposal: Continuing Project: X Budget Control Number: (if project is continuing) Control # 87-413 - EOPS
The Teaching and Learning Center
 The Teaching and Learning Center Created in Fall 1996 with the aid of a federal Title III grant, the purpose of LMC s Teaching and Learning Center (TLC) is to introduce new teaching methods and classroom
November 6, Re: Higher Education Provisions in H.R. 1, the Tax Cuts and Jobs Act. Dear Chairman Brady and Ranking Member Neal:
 The Honorable Kevin Brady The Honorable Richard Neal Chairman Ranking Member Ways and Means Committee Ways and Means Committee United States House of Representatives United States House of Representatives
Albemarle County Public Schools School Improvement Plan KEY CHANGES THIS YEAR
 2013-2014 Albemarle County Public Schools School Improvement Plan KEY CHANGES THIS YEAR Three SIP Goals 1. Student Learning Goal (w/d2015 as strategy) 2. Climate/Culture Goal 3. PD Goal (Consider support
Institution-Set Standards: CTE Job Placement Resources. February 17, 2016 Danielle Pearson, Institutional Research
 Institution-Set Standards: CTE Job Placement Resources February 17, 2016 Danielle Pearson, Institutional Research Standard 1.B.3 states: The institution establishes institution-set standards for student
Strategic Planning for Retaining Women in Undergraduate Computing
 for Retaining Women Workbook An NCWIT Extension Services for Undergraduate Programs Resource Go to /work.extension.html or contact us at es@ncwit.org for more information. 303.735.6671 info@ncwit.org Strategic
Connecting to the Big Picture: An Orientation to GEAR UP
 Connecting to the Big Picture: An Orientation to GEAR UP About the National Council for Community and Education Partnerships (NCCEP) Our mission is to build the capacity of communities to ensure that underserved
Bethune-Cookman University
 Bethune-Cookman University The Independent Colleges and Universities of Florida Community College Articulation Manual 2012-2013 1 BETHUNE-COOKMAN UNIVERSITY ICUF ARTICULATION MANUAL GENERAL ADMISSION PROCEDURES
OFFICE OF ENROLLMENT MANAGEMENT. Annual Report
 2014-2015 OFFICE OF ENROLLMENT MANAGEMENT Annual Report Table of Contents 2014 2015 MESSAGE FROM THE VICE PROVOST A YEAR OF RECORDS 3 Undergraduate Enrollment 6 First-Year Students MOVING FORWARD THROUGH
School Data Profile/Analysis
 School Year: 2011 School District: Cedar Springs Public Schools School Name: R1TS Principal: Mr Dave Schlump Building Code: 09743 School Data Profile/Analysis School Data Profile/Analysis Contents School
UNIVERSITY OF MASSACHUSETTS MINUTES OF THE MEETING OF THE ADVANCEMENT COMMITTEE
 UNIVERSITY OF MASSACHUSETTS AMHERST BOSTON DARMOUTH LOWELL WORCESTER MINUTES OF THE MEETING OF THE ADVANCEMENT COMMITTEE Wednesday, ; 12:00 p.m. Lowell/Dartmouth Room 225 Franklin Street 33rd Floor Boston,
ACADEMIC ALIGNMENT. Ongoing - Revised
 ACADEMIC ALIGNMENT Sandra Andrews December 2012 Erin Busscher, John Dersch, William Faber, Lorraine Fortuna, Laurie Foster, Wilfred Gooch, Fiona Hert, Diane Patrick, Paula Sullivan and Vince James Part
Spring Valley Academy Credit Flexibility Plan (CFP) Overview
 Overview") Overview Ohio Senate Bill 311 allows alternate pathways for those students who are eligible to receive high school credit through the use of Credit Flexibility Plans (CFPs). Spring Valley Academy students
Overview Ohio Senate Bill 311 allows alternate pathways for those students who are eligible to receive high school credit through the use of Credit Flexibility Plans (CFPs). Spring Valley Academy students
Nearing Completion of Prototype 1: Discovery
 The Fit-Gap Report The Fit-Gap Report documents how where the PeopleSoft software fits our needs and where LACCD needs to change functionality or business processes to reach the desired outcome. The report
Curricular Reviews: Harvard, Yale & Princeton. DUE Meeting
 Curricular Reviews: Harvard, Yale & Princeton DUE Meeting 3 March 2006 1 Some Numbers for Comparison Undergraduates MIT: 4,066 1,745 engineering majors (plus 169 Course 6 MEng) 876 science majors 128 humanities,
HIGHLAND HIGH SCHOOL CREDIT FLEXIBILITY PLAN
 HIGHLAND HIGH SCHOOL CREDIT FLEXIBILITY PLAN TABLE OF CONTENTS Overview 1 Eligible Credit Flexibility Plans 2 Earned Credit from Credit Flexibility Plans 2 Student Athletes 3 Application Process 3 Final
2020 Strategic Plan for Diversity and Inclusive Excellence. Six Terrains
 2020 Strategic Plan for Diversity and Inclusive Excellence Six Terrains The University of San Diego 2020 Strategic Plan for Diversity and Inclusive Excellence identifies six terrains that establish vision
Cooking Matters at the Store Evaluation: Executive Summary
 Cooking Matters at the Store Evaluation: Executive Summary Introduction Share Our Strength is a national nonprofit with the goal of ending childhood hunger in America by connecting children with the nutritious
The Dropout Crisis is a National Issue
 2012 ANNUAL REPORT The Dropout Crisis is a National Issue Thirty percent of U.S. students drop out of high school, with dropout rates exceeding 50% in poor urban communities. Students who dropout face
World s Best Workforce Plan
 2017-18 World s Best Workforce Plan District or Charter Name: PiM Arts High School, 4110-07 Contact Person Name and Position Matt McFarlane, Executive Director In accordance with Minnesota Statutes, section
Comprehensive Student Services Program Review
 Comprehensive Student Services Program Review 2014-2015 Extended Opportunity Programs & Services (EOPS) and Cooperative Agencies Resources for Education (CARE) Mission Statement: Mt. San Jacinto College
Albany Technical College Overview Goals Student Success and Implementation Team Conclusion Next Steps...
 ?33333 Dr. Josephine Reed-Taylor Chief Academic Officer Technical College System of Georgia 1800 Century Place, NE Atlanta, Georgia 30345-4304 December 2015 Contents Albany Technical College... 8 Overview...
TRENDS IN. College Pricing
 2008 TRENDS IN College Pricing T R E N D S I N H I G H E R E D U C A T I O N S E R I E S T R E N D S I N H I G H E R E D U C A T I O N S E R I E S Highlights 2 Published Tuition and Fee and Room and Board
SCHOOL EXEC CONNECT WEST ST. PAUL-MENDOTA HEIGHTS-EAGAN AREA SCHOOLS SUPERINTENDENT SEARCH FOCUS GROUP FEEDBACK January 12, 2017
 SCHOOL EXEC CONNECT WEST ST. PAUL-MENDOTA HEIGHTS-EAGAN AREA SCHOOLS SUPERINTENDENT SEARCH FOCUS GROUP FEEDBACK January 12, 2017 The School Board of the West St. Paul-Mendota Heights-Eagan Area Schools
Multiple Measures Assessment Project - FAQs
 Multiple Measures Assessment Project - FAQs (This is a working document which will be expanded as additional questions arise.) Common Assessment Initiative How is MMAP research related to the Common Assessment
MINUTES. Kentucky Community and Technical College System Board of Regents. Workshop September 15, 2016
 Board Members Present: Ms. Ellen R. Braden Mr. Robert G. Cooper Ms. Lisa V. Desmarais Dr. Angela Fultz Dr. Gail R. Henson Mr. Montre ale L. Jones Ms. Mary R. Kinney Mr. Barry K. Martin CALL TO ORDER MINUTES
Testimony to the U.S. Senate Committee on Health, Education, Labor and Pensions. John White, Louisiana State Superintendent of Education
 Testimony to the U.S. Senate Committee on Health, Education, Labor and Pensions John White, Louisiana State Superintendent of Education October 3, 2017 Chairman Alexander, Senator Murray, members of the
Procedures for Academic Program Review. Office of Institutional Effectiveness, Academic Planning and Review
 Procedures for Academic Program Review Office of Institutional Effectiveness, Academic Planning and Review Last Revision: August 2013 1 Table of Contents Background and BOG Requirements... 2 Rationale
Adult Education ACCE Presentation. Neil Kelly February 2, 2017
 Adult Education ACCE Presentation Neil Kelly February 2, 2017 Agenda The Adult Education Universe Data and Accountability System Adult Education Funding California Dreaming Adult Education Big Picture
Title Columbus State Community College's Master Planning Project (Phases III and IV) Status COMPLETED
 Status COMPLETED") The Higher Learning Commission Action Project Directory Columbus State Community College Project Details Title Columbus State Community College's Master Planning Project (Phases III and IV) Status COMPLETED
The Higher Learning Commission Action Project Directory Columbus State Community College Project Details Title Columbus State Community College's Master Planning Project (Phases III and IV) Status COMPLETED
Comprehensive Program Review Report (Narrative) College of the Sequoias
 College of the Sequoias") Program Review - Child Development Comprehensive Program Review Report (Narrative) College of the Sequoias Program Review - Child Development Prepared by: San Dee Hodges, Rebecca Griffith, Gwenette Aytman
Program Review - Child Development Comprehensive Program Review Report (Narrative) College of the Sequoias Program Review - Child Development Prepared by: San Dee Hodges, Rebecca Griffith, Gwenette Aytman
Executive Summary. Gautier High School
 Pascagoula School District Mr. Boyd West, Principal 4307 Gautier-Vancleave Road Gautier, MS 39553-4800 Document Generated On January 16, 2013 TABLE OF CONTENTS Introduction 1 Description of the School
GUIDE TO EVALUATING DISTANCE EDUCATION AND CORRESPONDENCE EDUCATION
 GUIDE TO EVALUATING DISTANCE EDUCATION AND CORRESPONDENCE EDUCATION A Publication of the Accrediting Commission For Community and Junior Colleges Western Association of Schools and Colleges For use in
The Condition of College & Career Readiness 2016
 The Condition of College and Career Readiness This report looks at the progress of the 16 ACT -tested graduating class relative to college and career readiness. This year s report shows that 64% of students
Program Guidebook. Endorsement Preparation Program, Educational Leadership
 Program Guidebook Endorsement Preparation Program, Educational Leadership The Endorsement Preparation Program in Educational Leadership is a competency-based degree program that prepares students at the
Graduate Division Annual Report Key Findings
 Graduate Division 2010 2011 Annual Report Key Findings Trends in Admissions and Enrollment 1 Size, selectivity, yield UCLA s graduate programs are increasingly attractive and selective. Between Fall 2001
Implementing an Early Warning Intervention and Monitoring System to Keep Students On Track in the Middle Grades and High School
 Implementing an Early Warning Intervention and Monitoring System to Keep Students On Track in the Middle Grades and High School National High School Center Facilitator: Joseph Harris, Ph.D. Presenters:
District Consultation Council Meeting. April 24, :00 p.m. Anaheim Campus Room 105 AGENDA
 District Consultation Council Meeting April 24, 2017 2:00 p.m. Anaheim Campus Room 105 Videoconferencing of the meeting will be available at Cypress College Complex Room 405 and the Fullerton College President
SECTION I: Strategic Planning Background and Approach
 JOHNS CREEK HIGH SCHOOL STRATEGIC PLAN SY 2014/15 SY 2016/17 APPROVED AUGUST 2014 SECTION I: Strategic Planning Background and Approach In May 2012, the Georgia Board of Education voted to make Fulton
Davidson College Library Strategic Plan
 Davidson College Library Strategic Plan 2016-2020 1 Introduction The Davidson College Library s Statement of Purpose (Appendix A) identifies three broad categories by which the library - the staff, the
MIDTERM REPORT. Solano Community College 4000 Suisun Valley Road Fairfield, California
 MIDTERM REPORT Solano Community College 4000 Suisun Valley Road Fairfield, California 94534-3197 Submitted to the Accrediting Commission for Community and Junior Colleges Western Association of Schools
Chart 5: Overview of standard C
 Chart 5: Overview of standard C Overview of levels of achievement of the standards in section C Indicate with X the levels of achievement for the standards as identified by each subject group in the table
DRAFT Strategic Plan INTERNAL CONSULTATION DOCUMENT. University of Waterloo. Faculty of Mathematics
 University of Waterloo Faculty of Mathematics DRAFT Strategic Plan 2012-2017 INTERNAL CONSULTATION DOCUMENT 7 March 2012 University of Waterloo Faculty of Mathematics i MESSAGE FROM THE DEAN Last spring,
university of wisconsin MILWAUKEE Master Plan Report
 university of wisconsin MILWAUKEE Master Plan Report 2010 introduction CUNNINGHAM 18 INTRODUCTION EMS CHEMISTRY LAPHAM 19 INTRODCUCTION introduction The University of Wisconsin-Milwaukee (UWM) is continually
Denver Public Schools
 2017 Candidate Surveys Denver Public Schools Denver School Board District 4: Northeast DPS District 4 - Introduction School board elections offer community members the opportunity to reflect on the state
Higher Education. Pennsylvania State System of Higher Education. November 3, 2017
 November 3, 2017 Higher Education Pennsylvania s diverse higher education sector - consisting of many different kinds of public and private colleges and universities - helps students gain the knowledge
Director, Ohio State Agricultural Technical Institute
 Director, Ohio State Agricultural Technical Institute The Ohio State University invites applications and nominations for the position of Director, Ohio State Agricultural Technical Institute (Ohio State
PROPOSAL FOR NEW UNDERGRADUATE PROGRAM. Institution Submitting Proposal. Degree Designation as on Diploma. Title of Proposed Degree Program
 PROPOSAL FOR NEW UNDERGRADUATE PROGRAM Institution Submitting Proposal Degree Designation as on Diploma Title of Proposed Degree Program EEO Status CIP Code Academic Unit (e.g. Department, Division, School)
EXECUTIVE SUMMARY. Online courses for credit recovery in high schools: Effectiveness and promising practices. April 2017
 EXECUTIVE SUMMARY Online courses for credit recovery in high schools: Effectiveness and promising practices April 2017 Prepared for the Nellie Mae Education Foundation by the UMass Donahue Institute 1