Contents Executive Summary... 1 Higher Education: An Investment in Our Future... 2 Background of Master Plan... 2 Closing the Gap
|
|
|
- Margaret Armstrong
- 5 years ago
- Views:
Transcription
1
2 Contents Executive Summary... 1 Higher Education: An Investment in Our Future... 2 Background of Master Plan... 2 Closing the Gap Attainment Goal Supporting Goals... 4 GOAL 1: Raise completion and graduation rates of colleges and universities by 10%... 4 GOAL 2: By fall 2018, increase the enrollment of adult students, age 25 to 54, by 75%... 7 GOAL 3: Raise the attainment rates of underserved student groups in the state by 10%... 8 GOAL 4: Improve College Affordability through Effective Resource Allocation... 9 Making Strides Funding Formula Goals of Productivity Funding Overview of Metrics State Outcomes Change in Outcomes for 2-Year Colleges Change in Outcomes for 4-Year Universities Outside Trends Which May Impact Productivity Outcomes Model Refinement Best Practices Academic Affairs Policies Academic/Student Affairs Partnerships Faculty Affairs Student Affairs Institutional Change Summary Institution Level Agency Level Financial Aid Highlights ArFuture Academic Challenge On the Horizon Legislative Agenda... 17
3 Governor s Distinguished Scholarship Needs-Based Aid Higher Education Classification and Compensation Act Health Education Grant Fund Master Plan Appendices Institutional Snap Shots Closing the Gap Awards... 33
4 Executive Summary In 2015, the Arkansas Higher Education Coordinating Board approved Closing the Gap 2020: A Master Plan for Higher Education. Since that time, Department of Higher Education and public institutions of higher learning in Arkansas have implemented a number of strategies to reach the goals set out in the plan. Contained in this report is the progress made toward the stated goals and a look to the future of Arkansas higher education. 1
5 Higher Education: An Investment in Our Future Background of Master Plan Closing the Gap 2020: A Master Plan for Arkansas Higher Education, was presented to the Arkansas Higher Education Coordinating Board on October 30, The five year planning cycle adopted in this plan is a critical component in the long-term objective to reach the 2025 goal of a 60% post-secondary attainment rate in Arkansas, increasing from the current estimate of 43.4%. The objective of this five-year plan for Arkansas higher education is to increase educational attainment by 2020 in order to close the gap between workforce needs and attainment levels. Progress will be measured by comparing the percentage of Arkansans holding a certificate or degree, as determined by U.S. census estimates, to the workforce skills needs, as determined by job projections in the publication Recovery: Job Growth and Education Requirements through Through implementation strategies resulting from this plan related to adult enrollments, minority student enrollments, student preparedness and student completion, Arkansas institutions will close this attainment gap by increasing the total number of credentials awarded annually by 40% over those of the academic year. However, as the projected workforce needs summarized below indicate, these increases should not be evenly distributed across all credential levels. The greatest needs indicated by employment projections are technical certificates, followed by associate s degrees, then bachelor degrees. 2

6 Closing the Gap 2020 The five year planning cycle adopted in this plan is a critical component in the long-term objective to reach the 2025 goal of a 60% post-secondary attainment rate in Arkansas, increasing from the current estimate of 43.4% Attainment Goal Arkansas s long-term objective is to reach the 2025 goal of 60% post-secondary attainment rate. Despite our statewide decrease in enrollment, our institutions of higher education have managed a 13.3% increase in the number of credentials awarded since In the past five years, Arkansas higher education has seen a 12.9% increase in career and technical certificates, and a 14.3% increase in the number of students receiving a Bachelor s degree. The following chart is an indication that despite the struggles with enrollment the nation and our institutions are experiencing, our institutions are succeeding and continue to work hard toward our statewide attainment goal. 3
. These rates were calculated using first-time entering cohorts beginning in academic year 2009-10, which produced a 23.")
.")
.")
7 2020 Supporting Goals GOAL 1: Raise completion and graduation rates of colleges and universities by 10% The 4-Year institutions have seen a considerable 10% increase in their 100% graduation rate (graduated on-time with Bachelor s degree in four years). These rates were calculated using first-time entering cohorts beginning in academic year , which produced a 23.7% graduation rate, ending with the academic year cohort from which improved to a 33.4% on-time graduation rate. The 150% graduation rate has seen growth as well. Between the and the academic years the 4-year institutions experienced a 4.2% growth in the 150% graduation rate (graduated in six-years with Bachelor s degree). With this 10% improvement to the 100% graduation rate and the increase in the 150% graduation rate, the 4-Year institutions are meeting the expectations of goal 1. The 2-Year colleges have seen a solid 7% increase in their 100% graduation rate (graduated on-time with Associate degree in two years). These rates were calculated using first-time entering cohorts beginning in academic year , which produced a 13.6% graduation rate, ending with academic year which improved to a 20.5% on-time graduation rate. The 2- Year colleges experienced a 6.5% increase in their 150% graduation rate from the cohort to the cohort. If the 2-year colleges continue the same upward trend, the 10% goal could be met in two years. 4

8 Another objective of goal 1 is to reduce the percentage of students needing remediation and the time it takes to complete remedial requirements. In 2017, the Arkansas Higher Education Coordinating Board changed the state s placement policy so that institutions can establish their own placement criteria in an effort to improve student success and reduce remediation time. The original placement policy, which had been in place since 1989, was based solely on students meeting specific placement exam (ACT, SAT, Asset, Compass, etc.) score requirements. The new student placement policy allows institutions to evaluate prior student success data and develop placement models that provide appropriate justification for student course placements. The results of the change in policy are significant. The chart indicates a significant decline in remediation rates for both the 4- year and 2-year institutions. The 4- year universities have seen an 8.7% decline and the 2-year colleges have seen a dramatic 14.7% decrease in remediation rates between Fall 2013 and Fall The statewide remediation rate has dropped from 43.2% to 30.5%. As with all changes in policy, ADHE will continue to monitor to ensure the intent of the change is working and will lead to more academically underserved students receiving their college degrees. Goal 1 also outlined the importance of raising first-year retention rates of students to SREB regional averages. The following tables provide both the retention rate and the persistence rate. The following table contains data for the 4-year institutions. The data indicate a considerable improvement and closing of the retention rate gap between Arkansas s retention rates and that of the other SREB states when comparing the Fall 2010 and Fall 2015 cohorts. The SREB retention rate of 78% for the Fall 2010 cohort improved only slightly to 79% for the Fall 2015 cohort, while the Arkansas retention rate increased from 68% for the Fall 2010 cohort to 73% for the Fall 2015 cohort. This was the most significant improvement of all seven SREB states with retention rates below the SREB average. The 4-year universities also showed the largest improvement in closing the persistence rate gap when comparing those same cohorts of all eight SREB states with persistence rates below the SREB average. The Fall 2010 cohort persistence rate of 76% was 9% lower than the SREB 5


9 average persistence rate of 85%. By the Fall 2015 cohort the gap had closed to just 4%, as the Arkansas persistence rate was 81% and the SREB rate was 85%. Also notable is how stagnant the average retention rate is for SREB states contiguous to Arkansas, while the Arkansas 4-year institution retention rate has increased 5% between the Fall 2010 and Fall 2015 cohorts. The contiguous state persistence rate has actually declined 2% while Arkansas has seen a 5% increase that brings us up to the 81% persistence rate equal to that of those states. All states contiguous to Arkansas are included in these rates except for Missouri, which is not member of the SREB. The 4-year universities have had tremendous success in closing both the retention and persistence rate gaps with SREB regional averages. With these successes, the 4-year universities have met another expectation of goal 1. The following table contains data for the 2-year colleges. The SREB retention rate of 58% for the Fall 2010 cohort improved only slightly to 59% for the Fall 2015 cohort, while the Arkansas retention rate increased from 50% for the Fall 2010 cohort to 53% for the Fall 2015 cohort. This closed the retention rate gap by 2%. The Arkansas 2-year college Fall 2010 cohort persistence rate of 54% was 10% lower than the SREB average persistence rate of 64%. By the Fall 2015 cohort, the gap had closed to 7%, as the Arkansas persistence rate was 58% and the SREB rate was 65%. The average retention rate for SREB states contiguous to Arkansas increased from 52% to 53%, while the Arkansas 2-year colleges saw a 3% increase between the Fall 2010 and Fall 2015 cohorts. This 3% increase, from 50% to 53%, closed the gap completely. The Arkansas 2-year colleges have had success in closing both the retention and persistence rate gaps with SREB regional averages. 6
10 GOAL 2: By fall 2018, increase the enrollment of adult students, age 25 to 54, by 75% Considering the decline in the unemployment rate in Arkansas over the last five years, it is not surprising the number of adult students attending our colleges and universities has declined as well. Our focus going forward needs to be on how to effectively communicate the value of higher education to the adult student population, and to encourage at least part-time enrollment in college courses. 7

11 GOAL 3: Raise the attainment rates of underserved student groups in the state by 10% In order to raise the attainment rates of our underserved student groups, there must be an increase in enrollment for those groups. Our Productivity Funding Model recognizes blacks and Hispanics as underserved race categories, and rewards institutions for successfully serving these students. According to the most recent college-going rate data, there has been a 4.4% increase in the college-going rate for Hispanic students for the past three years. To improve service to our academically underserved student population, the Arkansas Higher Education Coordinating Board changed the state s placement policy so that institutions can establish their own placement criteria in an effort to improve student success and reduce remediation time. Institutions have developed multiple measures placement policies which establish a hierarchy of measures that can be utilized to determine students readiness for college-level curriculum. This change of policy has resulted in fewer students requiring remediation, which will shorten their time to degree completion. This change in policy should increase the number of academically underserved students who persist and receive their degree, however, the policy has not been in place long enough to produce any data for evaluation. For more information, see the remediation section under goal 1. 8

12 GOAL 4: Improve College Affordability through Effective Resource Allocation ADHE has worked to improve college affordability through several initiatives. Productivity funding metrics for affordability and efficiency o Affordability Metrics focus on reducing tuition burden on students by focusing on the completion of credentials on time and on schedule. As can be seen in the chart below, the average number of credit hours at completion of a bachelor s degree has been trending downward since o Efficiency Metrics incentivize institutions to reallocate spending to focus on students and maximize efficiency and effectiveness. Encouraging collaboration between two-year and four-year institutions to provide seamless transfer and reduce credit hours for transfer students. Changed our placement policy so that institutions can establish their own placement plans in an effort to improve and reduce remediation time. o This reduces cost of remediation to the institutions. o It also reduces cost to the students as they are taking fewer courses over a shorter amount of time. 9
13 Making Strides Funding Formula Goals of Productivity Funding Productivity-based funding is a mechanism to align institutional funding with statewide priorities for higher education by incentivizing progress toward statewide goals as identified in Closing the Gap At the same time, such models encourage accountability to students and policymakers by focusing on the success of students through the achievement of their educational goals. The new funding model is built around a set of shared principles developed by institutions and aligned with goals and objectives for post-secondary attainment in our state. The guiding principles of the model include: student-centered, outcomes based measures, collaboration across institutions, supporting institutional mission, clarity and simplicity of the formula structure, flexibility to be adaptable, and financial stability and transition to the current model. Overview of Metrics The Productivity Funding Model has two categories of metrics: effectiveness and affordability. The effectiveness category includes metrics measuring credentials, progression, gateway course success, and transfer. *The Credentials metric is weighted at 32% of the model and measures credentials awarded to students with consideration given to credentials earned by students who contribute to closing the attainment gap of underserved populations in Arkansas, as well as credentials that will help meet state workforce needs. *The Progression metric is weighted at 24% of the model and measures the progress a student makes towards a credential. The metric includes the average number of pre-set progression goals met by concurrent and undergraduate students with consideration given to progression goals met by students who contribute to closing the gap of underserved populations in Arkansas. *Gateway Course Success is weighted at 12% of the model and measures the number of successfully completed gateway courses in math, English, and reading by academically prepared and academically underserved concurrent and undergraduate students. *The transfer metric is weighted at 12% of the model and measures undergraduate students who transfer from a two-year college to a four-year university. Two-year colleges are measured on the number of Associate degree completers or students who complete 30+ hours of ACTS courses who successfully transfer to an in-state four-year university. Four-year universities are measured on the number of students who enter their institution as a transfer student and successfully complete a baccalaureate degree. 10
14 The affordability category includes metrics measuring time to degree and credits at completion of students who complete Associate and/or Bachelor's degrees. *The Time to Degree metric is 10% of the model and measures students completing an Associate or Bachelor's degree at or near on-time. This metric only measures students who entered that institution as a first-time entering, full-time, degree-seeking undergraduate. "On-time" completion is defined as 24 months for an Associate degree and 48 months for a Bachelor's degree, with exceptions made for programs requiring additional time due to outside accreditation requirements. *The credits at completion metric is 10% of the model and measures the number of students completing an Associate or Bachelor's degree at or near the minimum number of credit hours required for that credential. The minimum number of credit hours required for a credential is based on 60 hours for an Associate degree and 120 hours for a Bachelor's degree, with exceptions made for programs requiring additional credit hours due to outside accreditation requirements. Once the effectiveness and affordability categories are measured, these scores may be adjusted for Diseconomies of Scale (2-year colleges) or funds spent on Research (4-year universities). Each institution will also receive an adjustment for efficiency of +/-2%. The efficiency adjustments are the Core Expense Ratio and the Faculty to Administration Salary Ratio. *The Core Expense Ratio is intended to encourage resource allocations with maximize spending in areas that directly impact student success and achievement of institutional mission. This adjustment uses IPEDS Financial data. This ratio is compared to ratios of SREB institutions within the same Carnegie classification as the institution. *The Faculty to Administration Salary Ratio is intended to encourage efficient use of administrative positions to support institutional mission. This adjustment uses IPEDS Financial data. This ratio is compared to ratios of SREB institutions within the same Carnegie classification as the institution. 11

15 State Outcomes The first year of the Productivity Model compared outcomes from Academic Years to outcomes from Academic Years In this first year of the Productivity Model, public institutions demonstrated an overall increase in productivity of 1.71%. The second year of the Productivity Model compared outcomes from Academic Years to outcomes from Academic Years In the second year of the Productivity Model, public institutions demonstrated an overall increase in productivity of 1.34%. Change in Outcomes for 2-Year Colleges In comparing the baseline of the first year of the productivity funding model to the comparative years of the second year of the model, two-year colleges show mixed results in changes within the metrics. Two-year colleges show the greatest positive percent change in the Time to Degree and Credits at Completion metrics of the Affordability category. These institutions show the greatest negative percent change in the Gateway Course Success Metric. 2-Year College Percent Change in Productivity Metric Scores: Baseline of Year 1 - Comparative of Year % % % % -5.00% 0.00% 5.00% 10.00% 15.00% 20.00% 25.00% -0.82% -3.87% Credentials Progression % Gateway Transfer 2.99% Time to Degree 18.68% Credits at Completion 9.82% 12
16 Change in Outcomes for 4-Year Universities In comparing the baseline of the first year of the Productivity Funding Model to the comparative years of the second year of the model, four-year universities show primarily positive changes within the metrics. As with the two-year colleges, the four-year universities show the greatest positive percent change in Time to Degree and Credits at Completion, while also showing the greatest negative percent change in the Gateway Course Success metric. 4-Year University Percent Change in Productivity Metric Scores: Baseline of Year 1 - Comparative of Year % % -5.00% 0.00% 5.00% 10.00% 15.00% 20.00% Credentials 8.89% Progression 4.95% % Gateway Transfer 0.64% Time to Degree Credits at Completion 15.78% 15.36% When analyzing the changes within the Efficiency adjustments, those measures have remained stable. Outside Trends Which May Impact Productivity Outcomes "Total college enrollment declined almost 7 percent nationwide between fall 2010 and fall 2015." SREB 2017 Fact Book on Higher Education Entering Students by Institution Type in Arkansas Fall 2012 Fall 2013 Fall 2014 Fall 2015 Fall Year Colleges 4-Year Universities Total Entering Students - Public Institutions Linear (Total Entering Students - Public Institutions) In Arkansas, total college enrollment declined 3.5 percent in this same time period. This decline is also reflected in declining entering class size which may be impacting such metrics within the formula as the Gateway Course Success metric. Lower entering class sizes may result in fewer students taking and therefore succeeding in gateway courses. 13
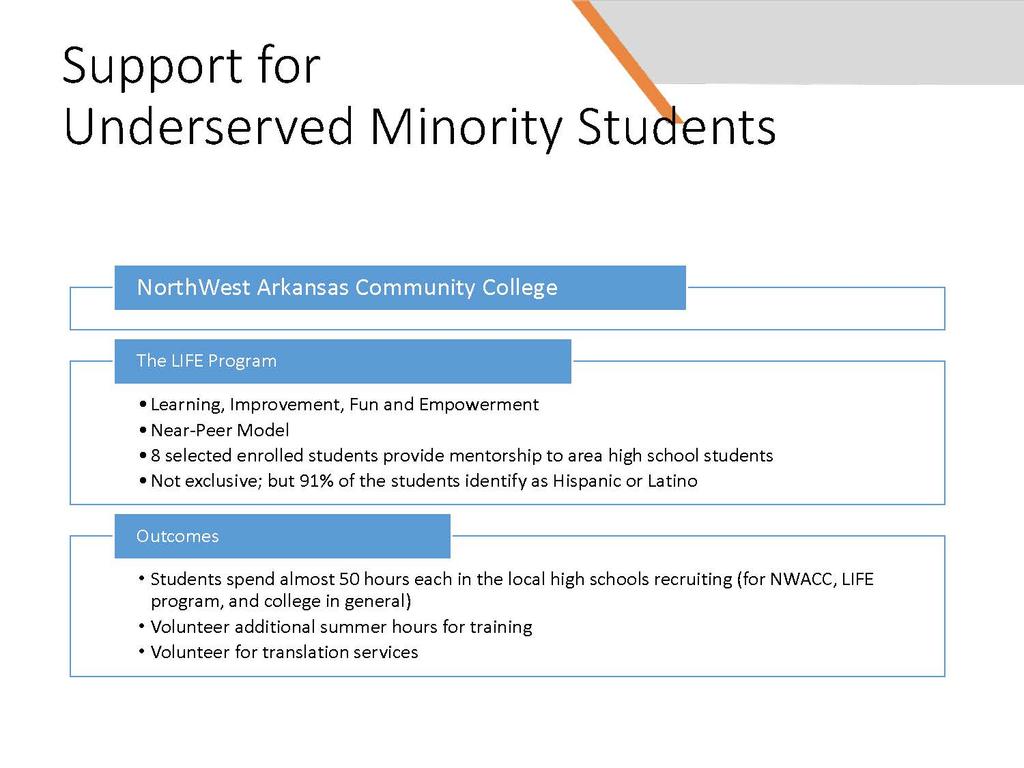
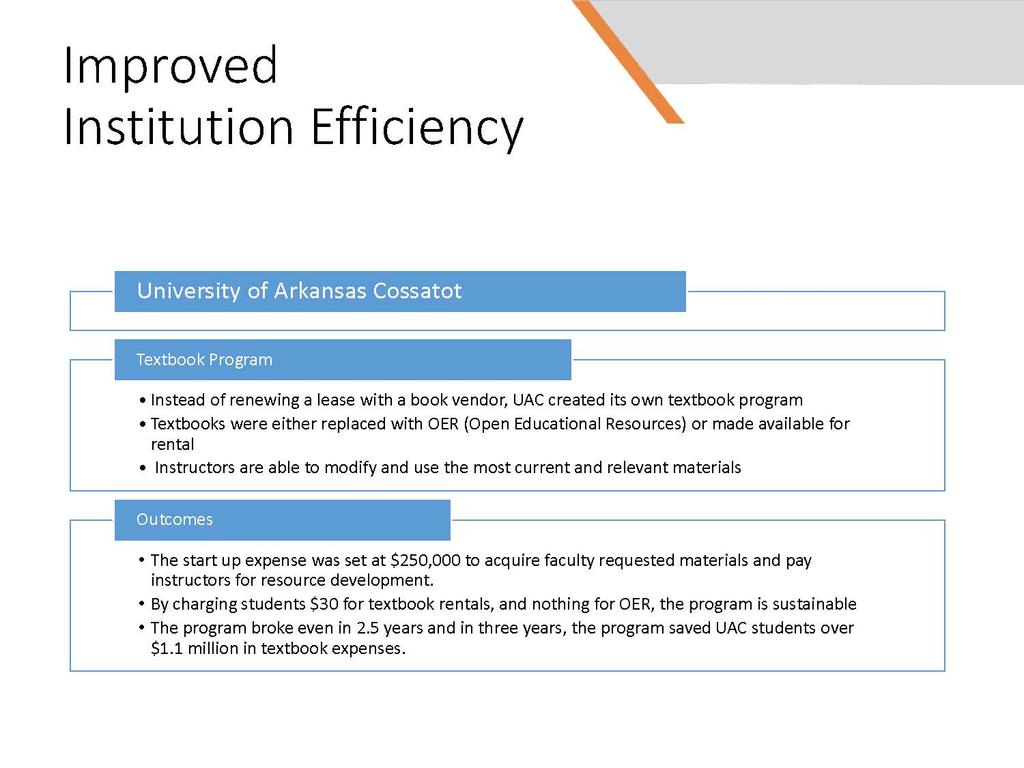
17 Model Refinement Statute dictates that the productivity model be regularly reviewed to refine and guard against unintended consequences. With two iterations complete, ADHE and the institutional workgroup are currently considering minor changes to the model including modifications to weights and scaling, diseconomies and research adjustments, and additional contingencies plans for incentive distribution scenarios. Any such changes will go through the rule making process prior to implementation. Best Practices The 40 institutions within Arkansas, have adopted/and or expanded the following institutional initiatives to support Closing the Gap 2020: Academic Affairs Policies Corequisite curriculum to reduce remediation rates 15 to finish within academic programs Requiring students to have an academic plan or map via career pathways Reduction in academic program credit hours to reflect requirements within ACT 747 (i.e. associate degree programs to 60 hours, baccalaureate degree program to 120 hours) Development of common course numbering to strengthen transfer between institutions Academic/Student Affairs Partnerships Concurrent programs with High-Schools 2+2 agreements between institutions Automated degree/certificate conferral utilizing reverse transfer Regional partnerships between institutions to support college readiness Faculty Affairs Faculty seminars and workshops on corequisite curriculum in gateway courses Training on faculty advising and mentoring within academic departments Training on tools/approaches to assess student learning (e.g., capstone projects, e-portfolios, rubrics) Coordination of students academic advising by faculty and campus advisors Student Affairs Mandatory new student orientation Career services and career counseling services for all students Implementation of early-alert systems to signal when students are struggling and set in motion appropriate support mechanisms Offering student success coaching programs for students Development of First Year Experience (FYE) and/or student success courses 14
18 Institutional Change Summary Institution Level For FY19 Institutions of Higher Education saw an increase in Operating Budgets of $50,612,660 from an FY18 total of $3,098,074,132 to planned budgets for FY19 totaling $3,148,686,792. In FY19 Institutions budgeted 905 more positions than were filled in FY18. Of the total of 39,955 authorized institutional positions, 32,518 were budgeted for FY19. Only 31,613 were filled in FY18. State Funding for the Institutions increased in FY19 by $15,304,253. This was aided by the Governor s recommended $9,404,113 increase in state general revenue funds recommended in the new productivity funding model. The remaining increase was due to an increased distribution of Educational Excellence Trust Fund revenue over FY18. Following the Governor s request to hold in state undergraduate tuition flat for FY19, all 4 year institutions had no increase in this area. However, the 4 year universities did increase their mandatory fees which resulted in an average increase of 3.2% in tuition and fee costs over FY18. For the 2 year colleges, the Governor requested to hold tuition increases to the CPI index of 2.1%. All of the institutions complied with this request, but after adding mandatory fee increases to this the total change from FY18 was 3.02%. Agency Level For FY19, Agency personnel was budgeted at continuing level from FY18. ADHE is currently operating with 34 of the 45 authorized and budgeted positions filled. State funding for operations and grants remained the same as FY18. The only change in agency budget was a reallocation of spending authority within the scholarships and grants to better align with demand. Financial Aid Highlights ArFuture ArFuture is a grant program aimed at increasing access to post-secondary education and providing all students an opportunity to climb the academic ladder. Although not a scholarship based on need there is not a merit requirement so students who were eligible for need based aid could still be eligible for ArFuture as well. The program was established at the end of the 2017 General Session creating a short roll out to students. This timeline resulted in a low initial number of applicants. In its first award year ArFuture saw 431 awards with an average of $ % white, 16% black, 6% Hispanic, 1% 2 or more races, 15% unknown of which were students 25 years or older (34%) - 25% of funding went to those 25 or older. - Average income is $35, students 25 or over failed to accept ArFuture (25%) 15
19 The expectation is for this to grow going forward as students learn of the availability of funds and have sufficient time to apply. In the Fall of 2018 alone, 269 students were awarded an average of $1,849 each. - 59% white, 13% unknown, 20% black, 1% Hispanic, 1% Asian, 4% 2 or more races - 75% of awards were to students 25 and older students 25 or over failed to accept ArFuture (17%) Academic Challenge In the academic year, 91.8 million dollars were awarded to almost 35,000 students: -4,353 of those students were non traditional - 1,973 were 25 or older (45%) - 37% of funding went to was 89%. - Demographics: - Male: Female: Unknown: 190 -White: Black: Asian: 48 - American Indian/ Alaska Native: 49 - Native Hawaiian or Pacific Islander: 47 - Two or more: 99 - No response/unknown:
20 On the Horizon Legislative Agenda Governor s Distinguished Scholarship The Governor s Distinguished scholarship is rapidly depleting ADHE s student aid fund. Additional revenue must be identified or caps placed on the number of recipients. Transfer existing fund balance of approximately $1.1 million dollars from Private Career Education Student Protection Fund to Higher Education Grant Fund to alleviate strain on GDS Require PCE to maintain $200,000 for student protection and transfer any additional funds to ADHE student aid fund Amend legislation to allow GDS to stack with Arkansas Challenge funds. Current legislation prohibits stacking. The original intent was to prevent supplanting however ADHE now spends double the amount on GDS as it did at the inception of the lottery. Supplanting could remain a restriction but lottery proceeds are adequate to allow stacking. Needs-Based Aid WIG and Go! were exceedingly unsuccessful aid programs and were eliminated in the 2017 session. Funds from these programs were reallocated to ArFuture. Arkansas is now one of very few states without some type of needs-based program Convene a task-force to design a new needs-based program that leverages federal SNAP/ENT matching dollars and existing social services Leverage services from partner state agencies and federal programs to efficiently and effectively administer successful needs-based programs Enabling legislation could direct ADHE to develop such a program for implementation in FY20 Higher Education Classification and Compensation Act In the 2017 legislative session, institutions of higher education were excluded from the statewide classification and compensation revisions and permitted to continue operating under the previous code. Since that time, a workgroup of higher ed human resource leaders have completed a review of the Act and are suggesting extensive clean-up language to eliminate pieces that do not apply to higher education. Examples include the elimination of titles not used in higher education, raising lower level pay grades to minimum wage, and providing for a uniform evaluation process. The result will be a much more concise Act that is applicable to classified employees across all of the state institutions of higher education. 17
21 Health Education Grant Fund The Health Education Grant program has demand that outpaces funding. A limited number of slots are available for a growing number of applicants and at an increasing cost per student. In addition, participants do not have incentive to return to Arkansas once they complete their training. The proposed bill will make the Arkansas Higher Education Health Grant Fund sustainable. A fund balance of approximately $7 million will accrue over time with the same investment (approximately $5 million annually) in the medical loan program. Phase out slot program and transition to loan repayment Honor commitments to students currently in contracted slots Reallocate budgeted funds to loan repayment programs Students would apply for loan repayment upon returning to the state for practice Loan repayment would follow similar criteria to teacher loan repayment programs Master Plan 2025 With Closing the Gap 2020: A Master Plan set to expire, ADHE will begin the development of a new strategic plan in early Strategies developed in for the current goals will be built upon in order to make additional gains toward the 2025 attainment goal. 18
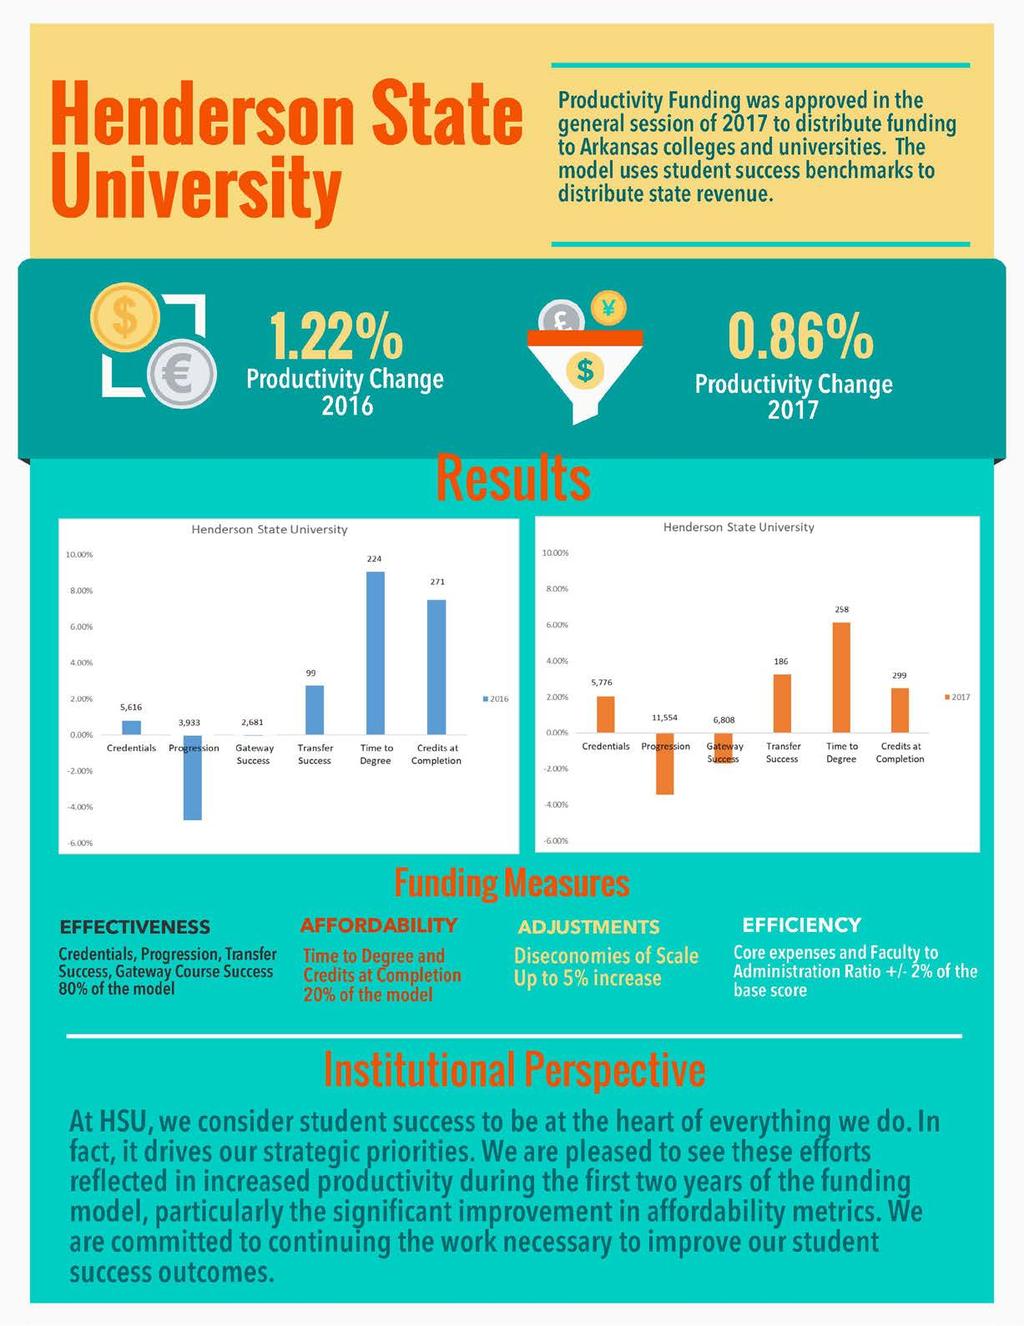
22 Appendices Institutional Snap Shots The following snap shots are visual summaries of how each institution fared in the first two years of the productivity model. The percentage indexes represented along the top of the visual are indicative of the increase or decrease in the ability of the institution to meet the outcomes. Although the percentages are related to funding, they do not represent a certain percentage lost or gained of actual dollars. The first chart is the fiscal year 2016 data and the second represents fiscal year The numbers contained within the charts are actual raw counts for each metric, while the bar represents the percentage change from the baseline three-year average. Each institution was offered an opportunity to speak to any opportunities for growth and future plans regarding student success in the last section. 19
23 1
24 2
25 3
26 4
27 5
28 6
29 7
30 8
31 9
32 10
33 11
34 12
35 13
36 14
37 15
38 16
39 17
40 18
41 19
42 20
43 21
44 22
45 23
46 24
47 25
48 26
49 27
50 28
51 29
52 30
53 31
54 32

55 Closing the Gap Awards 33
56 34
57 35
58 36
59 37
State Budget Update February 2016
 State Budget Update February 2016 2016-17 BUDGET TRAILER BILL SUMMARY The Budget Trailer Bill Language is the implementing statute needed to effectuate the proposals in the annual Budget Bill. The Governor
EDUCATIONAL ATTAINMENT
 EDUCATIONAL ATTAINMENT By 2030, at least 60 percent of Texans ages 25 to 34 will have a postsecondary credential or degree. Target: Increase the percent of Texans ages 25 to 34 with a postsecondary credential.
Trends in Tuition at Idaho s Public Colleges and Universities: Critical Context for the State s Education Goals
 1 Trends in Tuition at Idaho s Public Colleges and Universities: Critical Context for the State s Education Goals June 2017 Idahoans have long valued public higher education, recognizing its importance
Status of Women of Color in Science, Engineering, and Medicine
 Status of Women of Color in Science, Engineering, and Medicine The figures and tables below are based upon the latest publicly available data from AAMC, NSF, Department of Education and the US Census Bureau.
Financing Education In Minnesota
 Financing Education In Minnesota 2016-2017 Created with Tagul.com A Publication of the Minnesota House of Representatives Fiscal Analysis Department August 2016 Financing Education in Minnesota 2016-17
Educational Attainment
 A Demographic and Socio-Economic Profile of Allen County, Indiana based on the 2010 Census and the American Community Survey Educational Attainment A Review of Census Data Related to the Educational Attainment
Data Glossary. Summa Cum Laude: the top 2% of each college's distribution of cumulative GPAs for the graduating cohort. Academic Honors (Latin Honors)
") Institutional Research and Assessment Data Glossary This document is a collection of terms and variable definitions commonly used in the universities reports. The definitions were compiled from various
Institutional Research and Assessment Data Glossary This document is a collection of terms and variable definitions commonly used in the universities reports. The definitions were compiled from various
NATIONAL CENTER FOR EDUCATION STATISTICS
 NATIONAL CENTER FOR EDUCATION STATISTICS Palm Desert, CA The Integrated Postsecondary Education Data System (IPEDS) is the nation s core postsecondary education data collection program. It is a single,
Iowa School District Profiles. Le Mars
 Iowa School District Profiles Overview This profile describes enrollment trends, student performance, income levels, population, and other characteristics of the public school district. The report utilizes
Higher Education Six-Year Plans
 Higher Education Six-Year Plans 2018-2024 House Appropriations Committee Retreat November 15, 2017 Tony Maggio, Staff Background The Higher Education Opportunity Act of 2011 included the requirement for
Suggested Citation: Institute for Research on Higher Education. (2016). College Affordability Diagnosis: Maine. Philadelphia, PA: Institute for
. College Affordability Diagnosis: Maine. Philadelphia, PA: Institute for") MAINE Suggested Citation: Institute for Research on Higher Education. (2016). College Affordability Diagnosis: Maine. Philadelphia, PA: Institute for Research on Higher Education, Graduate School of Education,
MAINE Suggested Citation: Institute for Research on Higher Education. (2016). College Affordability Diagnosis: Maine. Philadelphia, PA: Institute for Research on Higher Education, Graduate School of Education,
Student Mobility Rates in Massachusetts Public Schools
 Student Mobility Rates in Massachusetts Public Schools Introduction The Massachusetts Department of Elementary and Secondary Education (ESE) calculates and reports mobility rates as part of its overall
https://secure.aacte.org/apps/peds/print_all_forms.php?view=report&prin...
 1 of 35 4/25/2012 9:56 AM A» 2011 PEDS» Institutional Data inst id: 3510 Institutional Data A_1 Institutional Information This information will be used in all official references to your institution. Institution
Volunteer State Community College Strategic Plan,
 Volunteer State Community College Strategic Plan, 2005-2010 Mission: Volunteer State Community College is a public, comprehensive community college offering associate degrees, certificates, continuing
Governors and State Legislatures Plan to Reauthorize the Elementary and Secondary Education Act
 Governors and State Legislatures Plan to Reauthorize the Elementary and Secondary Education Act Summary In today s competitive global economy, our education system must prepare every student to be successful
Connecting to the Big Picture: An Orientation to GEAR UP
 Connecting to the Big Picture: An Orientation to GEAR UP About the National Council for Community and Education Partnerships (NCCEP) Our mission is to build the capacity of communities to ensure that underserved
Strategic Plan Dashboard Results. Office of Institutional Research and Assessment
 29-21 Strategic Plan Dashboard Results Office of Institutional Research and Assessment Binghamton University Office of Institutional Research and Assessment Definitions Fall Undergraduate and Graduate
University of Arizona
 Annual Report Submission View Questionnaire (Edit) University of Arizona Annual Report Submission for the year 2009. Report has been submitted 1 times. Report was last submitted on 11/30/2009 7:12:09 PM.
READY OR NOT? CALIFORNIA'S EARLY ASSESSMENT PROGRAM AND THE TRANSITION TO COLLEGE
 READY OR NOT? CALIFORNIA'S EARLY ASSESSMENT PROGRAM AND THE TRANSITION TO COLLEGE Michal Kurlaender University of California, Davis Policy Analysis for California Education March 16, 2012 This research
Moving the Needle: Creating Better Career Opportunities and Workforce Readiness. Austin ISD Progress Report
 Moving the Needle: Creating Better Career Opportunities and Workforce Readiness Austin ISD Progress Report 2013 A Letter to the Community Central Texas Job Openings More than 150 people move to the Austin
Shelters Elementary School
 Shelters Elementary School August 2, 24 Dear Parents and Community Members: We are pleased to present you with the (AER) which provides key information on the 23-24 educational progress for the Shelters
Frank Phillips College. Accountability Report
 Frank Phillips College Accountability Report January 2016 Accountability System, January 2016 1 of 22 Participation - Key Measures Enrollment 1. Fall Headcount (Unduplicated) Fall 2000 Fall 2014 Fall 2015
EDUCATIONAL ATTAINMENT
 EDUCATIONAL ATTAINMENT By 2030, at least 60 percent of Texans ages 25 to 34 will have a postsecondary credential or degree. Target: Increase the percent of Texans ages 25 to 34 with a postsecondary credential.
Raw Data Files Instructions
 Raw Data Files Instructions Colleges will report the above information for students in the Main Cohort for each of the reporting timeframes and the system will calculate the sub cohorts and metrics based
Governor s Office of Budget, Planning and Policy and the Legislative Budget Board. Texas A&M University - Corpus Christi
 LEGISLATIVE APPROPRIATIONS REQUEST For Fiscal Years 212 and 213 Submitted to the Governor s Office of Budget, Planning and Policy and the Legislative Budget Board by Texas A&M University - Corpus Christi
In 2010, the Teach Plus-Indianapolis Teaching Policy Fellows, a cohort of early career educators teaching
 Introduction Dollars and Sense: Elevating the teaching profession by leveraging talent In 2010, the Teach Plus-Indianapolis Teaching Policy Fellows, a cohort of early career educators teaching in low-income
Best Colleges Main Survey
 Best Colleges Main Survey Date submitted 5/12/216 18::56 Introduction page 1 / 146 BEST COLLEGES Data Collection U.S. News has begun collecting data for the 217 edition of Best Colleges. The U.S. News
The following resolution is presented for approval to the Board of Trustees. RESOLUTION 16-
 1. Adoption of Wright State 2016 Campus Completion Plan The following resolution is presented for approval to the Board of Trustees. RESOLUTION 16- WHEREAS, Section 3345.81 of the Ohio Revised Code requires
November 6, Re: Higher Education Provisions in H.R. 1, the Tax Cuts and Jobs Act. Dear Chairman Brady and Ranking Member Neal:
 The Honorable Kevin Brady The Honorable Richard Neal Chairman Ranking Member Ways and Means Committee Ways and Means Committee United States House of Representatives United States House of Representatives
File Print Created 11/17/2017 6:16 PM 1 of 10
 Success - Key Measures Graduation Rate: 4-, 5-, and 6-Year 9. First-time, full-time entering, degree-seeking, students enrolled in a minimum of 12 SCH their first fall semester who have graduated from
Invest in CUNY Community Colleges
 Invest in Opportunity Invest in CUNY Community Colleges Pat Arnow Professional Staff Congress Invest in Opportunity Household Income of CUNY Community College Students
About the College Board. College Board Advocacy & Policy Center
 15% 10 +5 0 5 Tuition and Fees 10 Appropriations per FTE ( Excluding Federal Stimulus Funds) 15% 1980-81 1981-82 1982-83 1983-84 1984-85 1985-86 1986-87 1987-88 1988-89 1989-90 1990-91 1991-92 1992-93
Trends & Issues Report
 Trends & Issues Report prepared by David Piercy & Marilyn Clotz Key Enrollment & Demographic Trends Options Identified by the Eight Focus Groups General Themes 4J Eugene School District 4J Eugene, Oregon
Facts and Figures Office of Institutional Research and Planning
 Facts and Figures 2008-2009 Office of Institutional Research and Planning Office of Institutional Research Fall 2009 Facts at a Glance Credit Headcount Enrollments Headcount Ethnicity Headcount Percent
Undergraduates Views of K-12 Teaching as a Career Choice
 Undergraduates Views of K-12 Teaching as a Career Choice A Report Prepared for The Professional Educator Standards Board Prepared by: Ana M. Elfers Margaret L. Plecki Elise St. John Rebecca Wedel University
DRAFT VERSION 2, 02/24/12
 DRAFT VERSION 2, 02/24/12 Incentive-Based Budget Model Pilot Project for Academic Master s Program Tuition (Optional) CURRENT The core of support for the university s instructional mission has historically
SCICU Legislative Strategic Plan 2018
 The primary objective of the South Carolina Independent Colleges and Universities Legislative Strategic Plan is to establish an agenda and course of action for a program of education and advocacy on matters
AB104 Adult Education Block Grant. Performance Year:
 AB104 Adult Education Block Grant Performance Year: 2015-2016 Funding source: AB104, Section 39, Article 9 Version 1 Release: October 9, 2015 Reporting & Submission Process Required Funding Recipient Content
Transportation Equity Analysis
 2015-16 Transportation Equity Analysis Each year the Seattle Public Schools updates the Transportation Service Standards and bus walk zone boundaries for use in the upcoming school year. For the 2014-15
Trends in College Pricing
 Trends in College Pricing 2009 T R E N D S I N H I G H E R E D U C A T I O N S E R I E S T R E N D S I N H I G H E R E D U C A T I O N S E R I E S Highlights Published Tuition and Fee and Room and Board
Higher Education. Pennsylvania State System of Higher Education. November 3, 2017
 November 3, 2017 Higher Education Pennsylvania s diverse higher education sector - consisting of many different kinds of public and private colleges and universities - helps students gain the knowledge
Cooper Upper Elementary School
 LIVONIA PUBLIC SCHOOLS http://cooper.livoniapublicschools.org 215-216 Annual Education Report BOARD OF EDUCATION 215-16 Colleen Burton, President Dianne Laura, Vice President Tammy Bonifield, Secretary
House Finance Committee Unveils Substitute Budget Bill
 April 28, 2017 House Finance Committee Unveils Substitute Budget Bill On Tuesday, April 25, the House Finance Committee adopted a substitute version of House Bill 49, the budget bill for Fiscal Years (FY)
Graduate Division Annual Report Key Findings
 Graduate Division 2010 2011 Annual Report Key Findings Trends in Admissions and Enrollment 1 Size, selectivity, yield UCLA s graduate programs are increasingly attractive and selective. Between Fall 2001
College and Career Ready Performance Index, High School, Grades 9-12
 Dr. John D. Barge, State School Superintendent Making Education Work for All of Georgia s Students College and Career Ready Performance Index, High School, Grades 9-12 CONTENT MASTERY (END of COURSE TESTS
Personnel Administrators. Alexis Schauss. Director of School Business NC Department of Public Instruction
 Personnel Administrators Alexis Schauss Director of School Business NC Department of Public Instruction Delivering Bad News in a Good Way Planning Allotments are NOT Allotments Budget tool New Allotted
VOL VISION 2020 STRATEGIC PLAN IMPLEMENTATION
 VOL VISION 2020 STRATEGIC PLAN IMPLEMENTATION CONTENTS Vol Vision 2020 Summary Overview Approach Plan Phase 1 Key Initiatives, Timelines, Accountability Strategy Dashboard Phase 1 Metrics and Indicators
1.0 INTRODUCTION. The purpose of the Florida school district performance review is to identify ways that a designated school district can:
 1.0 INTRODUCTION 1.1 Overview Section 11.515, Florida Statutes, was created by the 1996 Florida Legislature for the purpose of conducting performance reviews of school districts in Florida. The statute
Creating Collaborative Partnerships: The Success Stories and Challenges
 Creating Collaborative Partnerships: The Success Stories and Challenges Community College Center of Excellence Building a World Class Workforce Through Community College Partnerships Cari Mallory National
PUBLIC INFORMATION POLICY
 CALIFORNIA STATE POLYTECHNIC UNIVERSITY, POMONA Landscape Architecture College of Environmental Design PUBLIC INFORMATION POLICY Landscape Architecture Accreditation Board (LAAB) accredited programs are
New Jersey Institute of Technology Newark College of Engineering
 New Jersey Institute of Technology Newark College of Engineering AND IN ELECTRICAL AND COMPUTER ENGINEERING Program Review Last Update: Nov. 23, 2005 MISSION STATEMENTS DOCTOR OF PHILOSOPHY IN ELECTRICAL
The number of involuntary part-time workers,
 University of New Hampshire Carsey School of Public Policy CARSEY RESEARCH National Issue Brief #116 Spring 2017 Involuntary Part-Time Employment A Slow and Uneven Economic Recovery Rebecca Glauber The
The Condition of College & Career Readiness 2016
 The Condition of College and Career Readiness This report looks at the progress of the 16 ACT -tested graduating class relative to college and career readiness. This year s report shows that 64% of students
Basic Skills Plus. Legislation and Guidelines. Hope Opportunity Jobs
 Basic Skills Plus Legislation and Guidelines Hope Opportunity Jobs Page 2 of 7 Basic Skills Plus Legislation When the North Carolina General Assembly passed the 2010 budget bill, one of their legislative
Strategic Planning Guide
 Chandler-Gilbert Estrella Mountain GateWay Glendale Mesa Paradise Valley Phoenix Rio Salado Scottsdale South Mountain Maricopa Skill Center SouthWest Skill Center Strategic Planning Guide 1 Table of Contents
FORT HAYS STATE UNIVERSITY AT DODGE CITY
 FORT HAYS STATE UNIVERSITY AT DODGE CITY INTRODUCTION Economic prosperity for individuals and the state relies on an educated workforce. For Kansans to succeed in the workforce, they must have an education
ILLINOIS DISTRICT REPORT CARD
 -6-525-2- HAZEL CREST SD 52-5 HAZEL CREST SD 52-5 HAZEL CREST, ILLINOIS and federal laws require public school districts to release report cards to the public each year. 2 7 ILLINOIS DISTRICT REPORT CARD
Financial aid: Degree-seeking undergraduates, FY15-16 CU-Boulder Office of Data Analytics, Institutional Research March 2017
 CU-Boulder financial aid, degree-seeking undergraduates, FY15-16 Page 1 Financial aid: Degree-seeking undergraduates, FY15-16 CU-Boulder Office of Data Analytics, Institutional Research March 2017 Contents
ILLINOIS DISTRICT REPORT CARD
 -6-525-2- Hazel Crest SD 52-5 Hazel Crest SD 52-5 Hazel Crest, ILLINOIS 2 8 ILLINOIS DISTRICT REPORT CARD and federal laws require public school districts to release report cards to the public each year.
Executive Summary. Laurel County School District. Dr. Doug Bennett, Superintendent 718 N Main St London, KY
 Dr. Doug Bennett, Superintendent 718 N Main St London, KY 40741-1222 Document Generated On January 13, 2014 TABLE OF CONTENTS Introduction 1 Description of the School System 2 System's Purpose 4 Notable
Math Pathways Task Force Recommendations February Background
 Math Pathways Task Force Recommendations February 2017 Background In October 2011, Oklahoma joined Complete College America (CCA) to increase the number of degrees and certificates earned in Oklahoma.
Basic Skills Initiative Project Proposal Date Submitted: March 14, Budget Control Number: (if project is continuing)
") Basic Skills Initiative Project Proposal 2016-2017 Date Submitted: March 14, 2016 Check One: New Proposal: Continuing Project: X Budget Control Number: (if project is continuing) Control # 87-413 - EOPS
Basic Skills Initiative Project Proposal 2016-2017 Date Submitted: March 14, 2016 Check One: New Proposal: Continuing Project: X Budget Control Number: (if project is continuing) Control # 87-413 - EOPS
PROPOSAL FOR NEW UNDERGRADUATE PROGRAM. Institution Submitting Proposal. Degree Designation as on Diploma. Title of Proposed Degree Program
 PROPOSAL FOR NEW UNDERGRADUATE PROGRAM Institution Submitting Proposal Degree Designation as on Diploma Title of Proposed Degree Program EEO Status CIP Code Academic Unit (e.g. Department, Division, School)
GRADUATE STUDENTS Academic Year
 Financial Aid Information for GRADUATE STUDENTS Academic Year 2017-2018 Your Financial Aid Award This booklet is designed to help you understand your financial aid award, policies for receiving aid and
NC Community College System: Overview
 NC Community College System: Overview Presentation to Joint Appropriations Subcommittee on Education Brett Altman Mark Bondo Fiscal Research Division March 18, 2015 Presentation Agenda 1. NCCCS Background
TRENDS IN. College Pricing
 2008 TRENDS IN College Pricing T R E N D S I N H I G H E R E D U C A T I O N S E R I E S T R E N D S I N H I G H E R E D U C A T I O N S E R I E S Highlights 2 Published Tuition and Fee and Room and Board
Education: Professional Experience: Personnel leadership and management
 Cathie Cline, Ed.D. Education: Ed.D., Higher Education, University of Arkansas at Little Rock, December 2006. Dissertation: The Influence of Faculty-Student Interaction on Graduation Rates at Rural Two-Year
Self Assessment. InTech Collegiate High School. Jason Stanger, Director 1787 Research Park Way North Logan, UT
 Jason Stanger, Director 1787 Research Park Way North Logan, UT 84341-5600 Document Generated On June 13, 2016 TABLE OF CONTENTS Introduction 1 Standard 1: Purpose and Direction 2 Standard 2: Governance
OFFICE OF ENROLLMENT MANAGEMENT. Annual Report
 2014-2015 OFFICE OF ENROLLMENT MANAGEMENT Annual Report Table of Contents 2014 2015 MESSAGE FROM THE VICE PROVOST A YEAR OF RECORDS 3 Undergraduate Enrollment 6 First-Year Students MOVING FORWARD THROUGH
The University of North Carolina Strategic Plan Online Survey and Public Forums Executive Summary
 The University of North Carolina Strategic Plan Online Survey and Public Forums Executive Summary The University of North Carolina General Administration January 5, 2017 Introduction The University of
University of Utah. 1. Graduation-Rates Data a. All Students. b. Student-Athletes
 University of Utah FRESHMAN-COHORT GRADUATION RATES All Students Student-Athletes # 2009-10 Graduation Rate 64% 64% Four-Class Average 61% 64% Student-Athlete Graduation Success Rate 87% 1. Graduation-Rates
Student Support Services Evaluation Readiness Report. By Mandalyn R. Swanson, Ph.D., Program Evaluation Specialist. and Evaluation
 Student Support Services Evaluation Readiness Report By Mandalyn R. Swanson, Ph.D., Program Evaluation Specialist and Bethany L. McCaffrey, Ph.D., Interim Director of Research and Evaluation Evaluation
California s Bold Reimagining of Adult Education. Meeting of the Minds September 6, 2017
 California s Bold Reimagining of Adult Education Meeting of the Minds September 6, 2017 Adult Education in California Historically CDE State Run Program $750M (est) Ten Program Areas K12 Districts / County
African American Male Achievement Update
 Report from the Department of Research, Evaluation, and Assessment Number 8 January 16, 2009 African American Male Achievement Update AUTHOR: Hope E. White, Ph.D., Program Evaluation Specialist Department
Albany Technical College Overview Goals Student Success and Implementation Team Conclusion Next Steps...
 ?33333 Dr. Josephine Reed-Taylor Chief Academic Officer Technical College System of Georgia 1800 Century Place, NE Atlanta, Georgia 30345-4304 December 2015 Contents Albany Technical College... 8 Overview...
46 Children s Defense Fund
 Nationally, about 1 in 15 teens ages 16 to 19 is a dropout. Fewer than two-thirds of 9 th graders in Florida, Georgia, Louisiana and Nevada graduate from high school within four years with a regular diploma.
John F. Kennedy Middle School
 John F. Kennedy Middle School CUPERTINO UNION SCHOOL DISTRICT Steven Hamm, Principal hamm_steven@cusdk8.org School Address: 821 Bubb Rd. Cupertino, CA 95014-4938 (408) 253-1525 CDS Code: 43-69419-6046890
Annual Report to the Public. Dr. Greg Murry, Superintendent
 Annual Report to the Public Dr. Greg Murry, Superintendent 1 Conway Board of Education Ms. Susan McNabb Mr. Bill Clements Mr. Chuck Shipp Mr. Carl Barger Dr. Adam Lamey Dr. Quentin Washispack Mr. Andre
Massachusetts Juvenile Justice Education Case Study Results
 Massachusetts Juvenile Justice Education Case Study Results Principal Investigator: Thomas G. Blomberg Dean and Sheldon L. Messinger Professor of Criminology and Criminal Justice Prepared by: George Pesta
ACADEMIC ALIGNMENT. Ongoing - Revised
 ACADEMIC ALIGNMENT Sandra Andrews December 2012 Erin Busscher, John Dersch, William Faber, Lorraine Fortuna, Laurie Foster, Wilfred Gooch, Fiona Hert, Diane Patrick, Paula Sullivan and Vince James Part
Final. Developing Minority Biomedical Research Talent in Psychology: The APA/NIGMS Project
 Final Report Developing Minority Biomedical Research Talent in Psychology: A Collaborative and Systemic Approach for Strengthening Institutional Capacity for Recruitment, Retention, Training, and Research
Texas A&M University-Texarkana
 LEGISLATIVE APPROPRIATIONS REQUEST For Fiscal Years 216 and 217 Submitted to the Governor s Office of Budget Planning and Policy and the Legislative Budget Board by Texas A&M University-Texarkana October
Los Angeles City College Student Equity Plan. Signature Page
 Los Angeles City College Student Equity Plan Signature Page Los Angeles Community College Los Angeles City College President, Board of Trustees Date District Chancellor: College President: Academic Senate
Graduation Initiative 2025 Goals San Jose State
 Graduation Initiative 2025 Goals San Jose State Metric 2025 Goal Most Recent Rate Freshman 6-Year Graduation 71% 57% Freshman 4-Year Graduation 35% 10% Transfer 2-Year Graduation 36% 24% Transfer 4-Year
NC Education Oversight Committee Meeting
 NC Education Oversight Committee Meeting November 7, 2017 Nathan Currie, Superintendent Bridget Phifer, NCCA Board Chair Agenda School Demographics Achievements & Improvements Critical Needs Q&A Mission
Value of Athletics in Higher Education March Prepared by Edward J. Ray, President Oregon State University
 Materials linked from the 5/12/09 OSU Faculty Senate agenda 1. Who Participates Value of Athletics in Higher Education March 2009 Prepared by Edward J. Ray, President Oregon State University Today, more
EXECUTIVE SUMMARY. Online courses for credit recovery in high schools: Effectiveness and promising practices. April 2017
 EXECUTIVE SUMMARY Online courses for credit recovery in high schools: Effectiveness and promising practices April 2017 Prepared for the Nellie Mae Education Foundation by the UMass Donahue Institute 1
A Snapshot of the Graduate School
 A Snapshot of the Graduate School Prepared for the Research Council February 6, 2009 John R. Mullin, Ph.D., FAICP Dean of the Graduate School University of Massachusetts Amherst Graduate School Purpose
Segmentation Study of Tulsa Area Higher Education Needs Ages 36+ March Prepared for: Conducted by:
 Segmentation Study of Tulsa Area Higher Education Needs Ages 36+ March 2004 * * * Prepared for: Tulsa Community College Tulsa, OK * * * Conducted by: Render, vanderslice & Associates Tulsa, Oklahoma Project
Differential Tuition Budget Proposal FY
 Differential Tuition Budget Proposal FY 2013-2014 MPA Differential Tuition Subcommittee MPA Faculty This document presents the budget proposal of the MPA Differential Tuition Subcommittee (MPADTS) for
Executive Summary. Walker County Board of Education. Dr. Jason Adkins, Superintendent 1710 Alabama Avenue Jasper, AL 35501
 Dr. Jason Adkins, Superintendent 1710 Alabama Avenue Jasper, AL 35501 Document Generated On November 3, 2016 TABLE OF CONTENTS Introduction 1 Description of the School System 2 System's Purpose 4 Notable
SFY 2017 American Indian Opportunities and Industrialization Center (AIOIC) Equity Direct Appropriation
 Equity Direct Appropriation") SFY 2017 American Indian Opportunities and Industrialization Center (AIOIC) Equity Direct Appropriation Report to the Legislature as required by 2016 Minnesota Session Laws, Chapter 189, H.F. 2749, Article
SFY 2017 American Indian Opportunities and Industrialization Center (AIOIC) Equity Direct Appropriation Report to the Legislature as required by 2016 Minnesota Session Laws, Chapter 189, H.F. 2749, Article
Lesson M4. page 1 of 2
 Lesson M4 page 1 of 2 Miniature Gulf Coast Project Math TEKS Objectives 111.22 6b.1 (A) apply mathematics to problems arising in everyday life, society, and the workplace; 6b.1 (C) select tools, including
Serving Country and Community: A Study of Service in AmeriCorps. A Profile of AmeriCorps Members at Baseline. June 2001
 Serving Country and Community: A Study of Service in AmeriCorps Cambridge, MA Lexington, MA Hadley, MA Bethesda, MD Washington, DC Chicago, IL Cairo, Egypt Johannesburg, South Africa A Profile of AmeriCorps
HOUSE OF REPRESENTATIVES AS REVISED BY THE COMMITTEE ON EDUCATION APPROPRIATIONS ANALYSIS
 BILL #: HB 269 HOUSE OF REPRESENTATIVES AS REVISED BY THE COMMITTEE ON EDUCATION APPROPRIATIONS ANALYSIS RELATING TO: SPONSOR(S): School District Best Financial Management Practices Reviews Representatives
MAINE 2011 For a strong economy, the skills gap must be closed.
 For a strong economy, the skills gap must be closed. 62% 36% 26% By 2020, jobs requiring a career certificate or college degree Skills gap Too few students make it through college. MEMBER Maine adults
ANNUAL SCHOOL REPORT SEDA COLLEGE SUITE 1, REDFERN ST., REDFERN, NSW 2016
 2016 ANNUAL SCHOOL REPORT SEDA COLLEGE SUITE 1, 134-138 REDFERN ST., REDFERN, NSW 2016 Contents Statement from the Principal... 2 SEDA College Context... 2 Student outcomes in standardised national literacy
Augusta University MPA Program Diversity and Cultural Competency Plan. Section One: Description of the Plan
 Augusta University MPA Program Diversity and Cultural Competency Plan Section One: Description of the Plan Over the past 20 years, the United States has gone through tremendous changes. Those changes include
The mission of the Grants Office is to secure external funding for college priorities via local, state, and federal funding sources.
 Southwest Tennessee Community College Grants Office Project Summary Grants Office The mission of the Grants Office is to secure external funding for college priorities via local, state, and federal funding
MINUTES. Kentucky Community and Technical College System Board of Regents. Workshop September 15, 2016
 Board Members Present: Ms. Ellen R. Braden Mr. Robert G. Cooper Ms. Lisa V. Desmarais Dr. Angela Fultz Dr. Gail R. Henson Mr. Montre ale L. Jones Ms. Mary R. Kinney Mr. Barry K. Martin CALL TO ORDER MINUTES