Promoting Persistence and Achievement: Meeting the Needs of Underserved Students at Bridgewater State University
|
|
|
- Derek Elliott
- 5 years ago
- Views:
Transcription
1 Promoting Persistence and Achievement: Meeting the Needs of Underserved Students at Bridgewater State University March 16, :30-11:30 a.m. Session 455 Dr. Heather C. Smith Associate Vice President for Enrollment Services

2 Bridgewater State University Founded in 1840 The 4th largest public institution of higher education and the largest state university in MA

3 The Mission of the University BSU has a responsibility to educate the residents of Southeastern Massachusetts and the commonwealth, and to use its intellectual, scientific and technological resources to support and advance the economic and cultural life of the region and the state.
4 Institutional Overview: Fall 2010 Five (5) Colleges and (1) School: The College of Humanities and Social Sciences School of Social Work The College of Science and Mathematics The College of Business The College of Education and Allied Studies The College of Graduate Studies Continuing and Distance Education programs are also offered
5 Institutional Overview: Fall 2010 Total enrollment: 11,201 Total FTE: 8,919 95% are from New England 59% are female 84% are full-time 14% are students of color
6 Institutional Overview: Fall 2010 Total undergraduate enrollment: 9,328 Total FTE: 8,003 95% are from New England 59% are female 84% are full-time 37% of full-time undergrads live on campus 14% are students of color
7 Institutional Overview: Fall 2010 Total graduate enrollment: 1,873 Total FTE: % are from New England 73% are female 26% are full-time 5% are students of color
8 Institutional Overview: Fall 2010 First-time freshmen (n=1,459) Select Demographics*: 51% (746) are first-generation college students 31% (450) are low-income (Pell-eligible) 15% (215) are students of color *Percentages for first-generation college students and students of color are based on the number of first-time freshmen responding to relevant questions on the student profile card.
9 Background: Sustaining the University s mission to serve economically and socially disadvantaged students remains central despite growing demand for the University s programs. ADMISSIONS Applied Accepted Enrolled
10

11 Project Compass Background: A comparison between the overall retention and graduation rates for the University and for the populations of students of interest in this project indicate a disparity in success.
12 Student Working Group Strategy 1.1 Structured study groups for high DFWI courses required in majors with high-concentrations of students in underserved groups
13 Faculty Working Group Strategy 2.1 Programming aimed at bringing Project Compass data and culturally inclusive, engaged learning pedagogies to all faculty members.
14 Research Working Group Strategy 3.1 Improve our ability to identify students in each of the three target populations
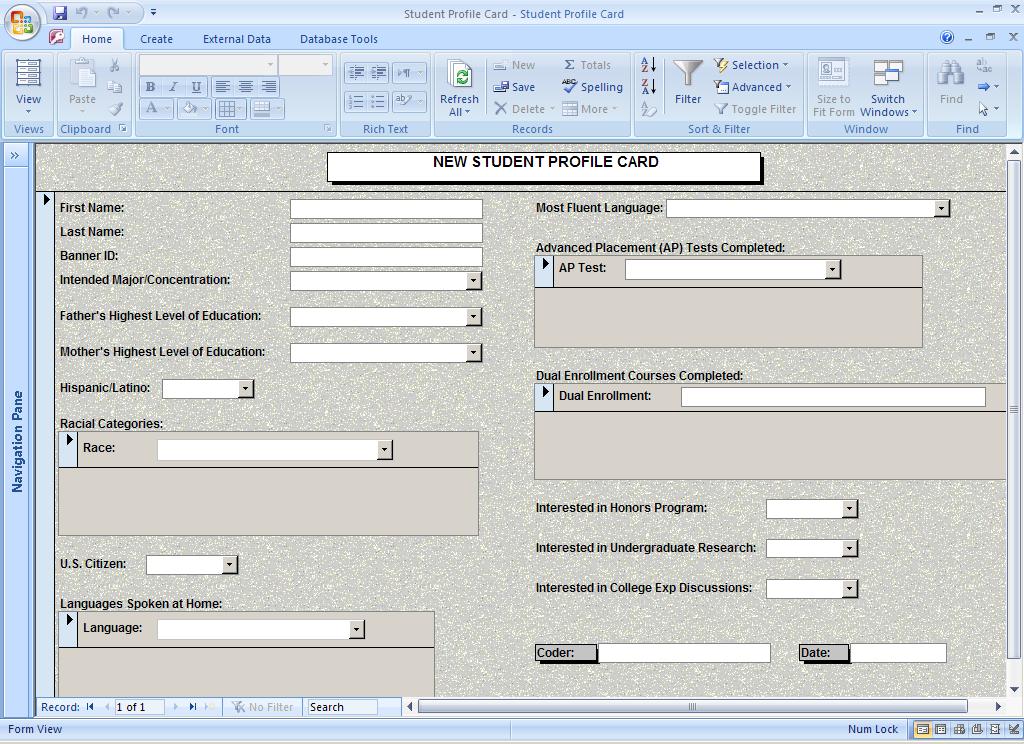
15 College and University Vol. 86 No2- Fall 2010 Campus Viewpoint The Orientation Student Profile Card: Improving the Collection of Student Demographic Information Dr. Michael Young, Director Dr. Marlene Clapp, Research Analyst
16 The Orientation Student Profile Card Project Compass Cohort: Fall 2009 Total number of first-time freshmen: 1,482 Not Compass (n=566) 38% Compass (n=916) 62% Full-time (n=897) 98% Part-time (n=19) 2%
17 The Orientation Student Profile Card Project Compass Research Strategies at BSC #1. Improve the University s ability to identify students in each of the three target populations: Students of color; First-generation college students; and Low-income students.
18 The Orientation Student Profile Card Project Compass Research Strategies at BSU #2. Through our enhanced ability to identify populations, improved tracking of academic performance, retention, satisfaction, and graduation will be made possible.
19 The Orientation Student Profile Card Project Compass Research Strategies at BSU #3. Improved tracking will in turn enhance the COP s ability to recommend intervention strategies and assess program achievements.
20
21
22 The Orientation Student Profile Card The New Student Profile Card Instrument Has helped to improve identification of the student population at the University, particularly: Students of color First-generation college students
23 The Orientation Student Profile Card The New Student Profile Card Instrument Percentage of 2009 first-time freshmen for which race/ethnicity is unknown/other: Based on Admissions data: Based on Student Profile Card: 5.1% (n=75) 1.2% (n=18)
24 The Orientation Student Profile Race/ethnicity Mismatches: Fall 2009 First-time Freshmen Card Banner Unknown Other White Black or African American White Black or African American Other Other Hispanics of any race Unknown Cape Verdean American Indian or Alaska Native Asian Black or African American Other White American Indian or Alaska Native American Indian or Alaska Native Asian Asian Asian Black or African American Black or African American Unknown White Student Profile Card Number of Mismatches White 46 White 10 Two or more races 9 Hispanic or Latino 6 Unknown 6 Two or more races 5 Hispanic or Latino 5 Two or more races 5 White 4 Hispanic or Latino 4 Two or more races 3 White 2 Hispanic or Latino 2 Unknown 2 Unknown 2 Hispanic or Latino 2 Black or African American 1 Two or more races 1 Native Hawaiian or Other Pacific Islander 1 Unknown 1 White 1 Cape Verdean 1 Native Hawaiian or Other Pacific Islander 1 Asian 1 American Indian or Alaska Native 1 TOTAL 122
25 The Orientation Student Profile Card The New Student Profile Card Instrument Percentage of 2008 first-time full-time freshmen for which first-generation status was unknown: Based on CIRP survey data: Based on Student Profile Card: 24.2% (n=355) 1.3% (n=19)
26 The Orientation Student Profile Card Fall to Fall Retention of First-Time Freshmen: Fall 2008 Cohort Group All First-Time Project Compass First-Generation (FG) Low-Income (Low-Inc) Students of Color (SOC) Compass Overlaps FG Low-Inc FG SOC SOC Low-Inc Cohort* 1, To Fall ,213 (80.8%) 771 (79.0%) 667 (77.9%) 266 (79.9%) 150 (79.4%) (77.5%) 100 (76.3%) 67 (81.7%) *Cohorts represent first-time freshmen including both full-time and part time. Note: FG=First-generation; Low-Inc=Low-income; SOC=Students of color

27 First-to-Second- Retention Rate for Students in Project Compass Target Groups as Compared to All First-Time Full-Time First- Students, by Cohort All FTFT Students of Color Low-Income Students First-Generation Students % 68% 72% % 71% 71% % 73% 77% % 81% 81% 79% % 79% 81% 80%
28 Attachment 3.1: 2010 Cohort Statistics SOC Low-Income FirstGeneration # In Group Total Cohort % In Each Group 1,459 1,459 1,459 15% 31% 51% Total number of freshmen: 1,459 Freshmen who are SOC, first-generation, and/or low-income: 934 Percentage of freshmen who are SOC, first-generation, and/or low-income: 64%
29 Attachment 3.3: Retention and Graduation Rates for Project Compass Groups First-Time Full-Time Freshmen (STUDENTS OF COLOR)3 Retention Rates Cohort Headcount Percent Continued to % 67.6% 71.0% 73.2% 80.2% 78.7% nd to % 63.3% 62.6% 61.9% 73.5% rd to 4th to 5th to 6th to 7th 47.1% 33.9% 5.8% 3.3% 52.5% 34.5% 15.8% 57.4% 30.3% 60.7% Fresh-Soph1 SophJunior2 Retention Retention 65.3% 67.6% 71.0% 73.2% 80.2% 78.7% 84.8% 93.6% 88.2% 84.6% 91.5% Freshman-Sophomore retention is the percentage of students in the initial cohort who continued the following fall semester. Sophomore-Junior retention is the percentage of students enrolled in their 2 nd year who continued to a 3rd year. 3 Includes students who identify as American Indian/Alaskan Native, Asian, Black, Hispanic, or Cape Verdean. 1 2 Cumulative Graduation Rates Cohort Headcount Cumulative Percent Graduated in 4 s in 5 s in 6 s 10.7% 33.9% 37.2% 18.0% 33.1% 23.9%
30 FIRST-TIME FULL-TIME FRESHMENT (NOT STUDENTS OF COLOR)3 Retention Rates Cohort Headcount Percent Continued to 2nd to 3rd to 4th to 5th to 6th to 7th % 65.7% 62.0% 32.6% 6.9% % 66.9% 63.3% 31.9% 9.7% % 66.7% 62.2% 32.1% % 72.6% 69.8% % 73.2% % 2.7% Fresh-Soph1 SophJunior2 Retention Retention 76.7% 85.6% 75.8% 88.2% 74.8% 89.2% 80.3% 90.4% 82.0% 89.3% 81.3% Retention Rates 1 Freshman-Sophomore retention is the percentage of students in the initial cohort who continued the following fall semester. 2 Sophomore-Junior retention is the percentage of students enrolled in their 2nd year who continued to a 3rd year. 3 Includes White students, non-resident aliens, unknown students, and other students Cumulative Graduation Rates Cohort Headcount 2004 Cumulative Percent Graduated 1145 in 4 s 25.6% in 5 s 50.5% % 28.4% 47.6% in 6 s 54.8%
31 FIRST-TIME FULL-TIME FRESHMEN (LOW INCOME) Retention Rates Cohort Headcount Percent Continued to % 72.1% 71.0% 77.0% 80.8% 80.9% nd to 3rd to 4th to 5th to 6th to 7th 62.8% 56.4% 32.5% 5.1% 3.0% 64.7% 54.4% 29.9% 13.2% 62.3% 57.9% 29.0% 67.0% 64.8% 70.6% Fresh-Soph1 SophJunior2 Retention Retention 74.8% 72.1% 71.0% 77.0% 80.8% 80.9% 84.0% 89.8% 87.7% 87.0% 87.4% Retention Rates 1 Freshman-Sophomore retention is the percentage of students in the initial cohort who continued the following fall semester. 2 Sophomore-Junior retention is the percentage of students enrolled in their 2 nd year who continued to a 3rd year. Cumulative Graduation Rates Cohort Headcount 2004 Cumulative Percent Graduated in 4 s in 5 s in 6 s % 44.9% 48.7% % 37.3% %
32 FIRST-TIME FULL-TIME FRESHMEN (NOT LOW INCOME) Retention Rates Cohort 1 2 Headcount Fresh-Soph1 Soph-Junior2 Percent Continued to 2nd to 3rd to 4th to 5th to 6th to 7th % 65.1% 61.5% 32.8% 7.2% % 66.8% 63.6% 32.6% 9.8% % 67.2% 62.5% 32.6% % 72.6% 69.9% % 74.0% % 2.7% Retention Retention 75.8% 85.9% 75.5% 88.5% 75.1% 89.4% 80.3% 90.5% 82.0% 90.2% 81.0% Freshman-Sophomore retention is the percentage of students in the initial cohort who continued the following fall semester. Sophomore-Junior retention is the percentage of students enrolled in their 2nd year who continued to a 3rd year. Cumulative Graduation Rates Cohort Headcount 2004 Cumulative Percent Graduated in 4 s in 5 s in 6 s % 49.8% 54.2% % 47.7% %
33 FIRST-TIME FULL-TIME FRESHMEN (FIRST GENERATION) Retention Rates 1 2 Cohort Headcount to 2nd 78.8 % 80.2 % to 3rd Percent Continued to 4th to 5th to 6th to 7th 70.3% FreshSoph1 SophJunior2 Retention Retention 78.8% 89.2% 80.2% Freshman-Sophomore retention is the percentage of students in the initial cohort who continued the following fall semester. Sophomore-Junior retention is the percentage of students enrolled in their 2nd year who continued to a 3rd year. FIRST-TIME FULL-TIME FRESHMEN (NOT FIRST GENERATION) Retention Rates Cohort 1 2 Headcount Percent Continued to 2 to % nd % % rd to 4th to 5th to 6th to 7th Fresh-Soph1 SophJunior2 Retention Retention 85.6% 90.0% 81.8% Freshman-Sophomore retention is the percentage of students in the initial cohort who continued the following fall semester. Sophomore-Junior retention is the percentage of students enrolled in their 2nd year who continued to a 3rd year.

34 The Orientation Student Profile Card Questions/Comments? Heather C. Smith: Michael Young:
University of Utah. 1. Graduation-Rates Data a. All Students. b. Student-Athletes
 University of Utah FRESHMAN-COHORT GRADUATION RATES All Students Student-Athletes # 2009-10 Graduation Rate 64% 64% Four-Class Average 61% 64% Student-Athlete Graduation Success Rate 87% 1. Graduation-Rates
12-month Enrollment
 12-month Enrollment 2016-17 Institution: Potomac State College of West Virginia University (237701) Overview 12-month Enrollment Overview The 12-Month Enrollment component collects unduplicated student
File Print Created 11/17/2017 6:16 PM 1 of 10
 Success - Key Measures Graduation Rate: 4-, 5-, and 6-Year 9. First-time, full-time entering, degree-seeking, students enrolled in a minimum of 12 SCH their first fall semester who have graduated from
Data Glossary. Summa Cum Laude: the top 2% of each college's distribution of cumulative GPAs for the graduating cohort. Academic Honors (Latin Honors)
") Institutional Research and Assessment Data Glossary This document is a collection of terms and variable definitions commonly used in the universities reports. The definitions were compiled from various
Institutional Research and Assessment Data Glossary This document is a collection of terms and variable definitions commonly used in the universities reports. The definitions were compiled from various
Strategic Plan Dashboard Results. Office of Institutional Research and Assessment
 29-21 Strategic Plan Dashboard Results Office of Institutional Research and Assessment Binghamton University Office of Institutional Research and Assessment Definitions Fall Undergraduate and Graduate
Status of Women of Color in Science, Engineering, and Medicine
 Status of Women of Color in Science, Engineering, and Medicine The figures and tables below are based upon the latest publicly available data from AAMC, NSF, Department of Education and the US Census Bureau.
Frank Phillips College. Accountability Report
 Frank Phillips College Accountability Report January 2016 Accountability System, January 2016 1 of 22 Participation - Key Measures Enrollment 1. Fall Headcount (Unduplicated) Fall 2000 Fall 2014 Fall 2015
Student Mobility Rates in Massachusetts Public Schools
 Student Mobility Rates in Massachusetts Public Schools Introduction The Massachusetts Department of Elementary and Secondary Education (ESE) calculates and reports mobility rates as part of its overall
Access Center Assessment Report
 Access Center Assessment Report The purpose of this report is to provide a description of the demographics as well as higher education access and success of Access Center students at CSU. College access
Best Colleges Main Survey
 Best Colleges Main Survey Date submitted 5/12/216 18::56 Introduction page 1 / 146 BEST COLLEGES Data Collection U.S. News has begun collecting data for the 217 edition of Best Colleges. The U.S. News
Raw Data Files Instructions
 Raw Data Files Instructions Colleges will report the above information for students in the Main Cohort for each of the reporting timeframes and the system will calculate the sub cohorts and metrics based
Facts and Figures Office of Institutional Research and Planning
 Facts and Figures 2008-2009 Office of Institutional Research and Planning Office of Institutional Research Fall 2009 Facts at a Glance Credit Headcount Enrollments Headcount Ethnicity Headcount Percent
Shelters Elementary School
 Shelters Elementary School August 2, 24 Dear Parents and Community Members: We are pleased to present you with the (AER) which provides key information on the 23-24 educational progress for the Shelters
NATIONAL CENTER FOR EDUCATION STATISTICS
 NATIONAL CENTER FOR EDUCATION STATISTICS Palm Desert, CA The Integrated Postsecondary Education Data System (IPEDS) is the nation s core postsecondary education data collection program. It is a single,
PUBLIC INFORMATION POLICY
 CALIFORNIA STATE POLYTECHNIC UNIVERSITY, POMONA Landscape Architecture College of Environmental Design PUBLIC INFORMATION POLICY Landscape Architecture Accreditation Board (LAAB) accredited programs are
APPLICANT INFORMATION. Area Code: Phone: Area Code: Phone:
 MARQUETTE UNIVERSITY HEALTH CAREERS OPPORTUNITY PROGRAM College Science Enrichment Program (CSEP) & Pre-Enrollment Support Program (PESP) Website: http://www.mu.edu/hcop INSTRUCTIONS: Please type or print
Port Graham El/High. Report Card for
 School: District: Kenai Peninsula Grades: K - 12 School Enrollment: 20 Title I School? No Title 1 Program: Accreditation: Report Card for 2008-2009 A Title 1 school receives federal money in support low-achieving
https://secure.aacte.org/apps/peds/print_all_forms.php?view=report&prin...
 1 of 35 4/25/2012 9:56 AM A» 2011 PEDS» Institutional Data inst id: 3510 Institutional Data A_1 Institutional Information This information will be used in all official references to your institution. Institution
Council on Postsecondary Education Funding Model for the Public Universities (Excluding KSU) Bachelor's Degrees
 Bachelor's Degrees") Bachelor's Degrees Institution 2013-14 2014-15 2015-16 UK 3,988 4,238 4,540 UofL 2,821 2,832 2,705 EKU 2,508 2,532 2,559 MoSU 1,144 1,166 1,306 MuSU 1,469 1,512 1,696 NKU 2,143 2,214 2,196 WKU 2,751 2,704
Bachelor's Degrees Institution 2013-14 2014-15 2015-16 UK 3,988 4,238 4,540 UofL 2,821 2,832 2,705 EKU 2,508 2,532 2,559 MoSU 1,144 1,166 1,306 MuSU 1,469 1,512 1,696 NKU 2,143 2,214 2,196 WKU 2,751 2,704
It s not me, it s you : An Analysis of Factors that Influence the Departure of First-Year Students of Color
 It s not me, it s you : An Analysis of Factors that Influence the Departure of First-Year Students of Color Berenice Sánchez Keeley Copridge Jana Clark Jim Cole, Ph.D. Learning Outcomes 1. Participants
Coming in. Coming in. Coming in
 212-213 Report Card for Glenville High School SCHOOL DISTRICT District results under review by the Ohio Department of Education based upon 211 findings by the Auditor of State. Achievement This grade combines
46 Children s Defense Fund
 Nationally, about 1 in 15 teens ages 16 to 19 is a dropout. Fewer than two-thirds of 9 th graders in Florida, Georgia, Louisiana and Nevada graduate from high school within four years with a regular diploma.
Basic Skills Initiative Project Proposal Date Submitted: March 14, Budget Control Number: (if project is continuing)
") Basic Skills Initiative Project Proposal 2016-2017 Date Submitted: March 14, 2016 Check One: New Proposal: Continuing Project: X Budget Control Number: (if project is continuing) Control # 87-413 - EOPS
Basic Skills Initiative Project Proposal 2016-2017 Date Submitted: March 14, 2016 Check One: New Proposal: Continuing Project: X Budget Control Number: (if project is continuing) Control # 87-413 - EOPS
ESSEX COUNTY COLLEGE. INSTITUTIONAL PROFILE (Excellence and Accountability)
") ESSEX COUNTY COLLEGE INSTITUTIONAL PROFILE (Excellence and Accountability) Submitted to Commission on Higher Education September 28, 2009 Office of Planning, Research & Assessment Dr. J. Scott Drakulich
ESSEX COUNTY COLLEGE INSTITUTIONAL PROFILE (Excellence and Accountability) Submitted to Commission on Higher Education September 28, 2009 Office of Planning, Research & Assessment Dr. J. Scott Drakulich
Educational Attainment
 A Demographic and Socio-Economic Profile of Allen County, Indiana based on the 2010 Census and the American Community Survey Educational Attainment A Review of Census Data Related to the Educational Attainment
A Decision Tree Analysis of the Transfer Student Emma Gunu, MS Research Analyst Robert M Roe, PhD Executive Director of Institutional Research and
 A Decision Tree Analysis of the Transfer Student Emma Gunu, MS Research Analyst Robert M Roe, PhD Executive Director of Institutional Research and Planning Overview Motivation for Analyses Analyses and
TRANSFER APPLICATION: Sophomore Junior Senior
 : Sophomore Junior Senior 2714 W Augusta Phone: 773.534.9718 Fax: 773.534.4022 Email: admissions@chiarts.org Web: www.chiarts.org CPS Mail Run: G.S.R. #35 FRESHMAN APPLICATION STEPS Thank you for your
Los Angeles City College Student Equity Plan. Signature Page
 Los Angeles City College Student Equity Plan Signature Page Los Angeles Community College Los Angeles City College President, Board of Trustees Date District Chancellor: College President: Academic Senate
Cooper Upper Elementary School
 LIVONIA PUBLIC SCHOOLS http://cooper.livoniapublicschools.org 215-216 Annual Education Report BOARD OF EDUCATION 215-16 Colleen Burton, President Dianne Laura, Vice President Tammy Bonifield, Secretary
The Demographic Wave: Rethinking Hispanic AP Trends
 The Demographic Wave: Rethinking Hispanic AP Trends Kelcey Edwards & Ellen Sawtell AP Annual Conference, Las Vegas, NV July 19, 2013 Exploring the Data Hispanic/Latino US public school graduates The Demographic
DUAL ENROLLMENT ADMISSIONS APPLICATION. You can get anywhere from here.
 DUAL ENROLLMENT ADMISSIONS APPLICATION SM You can get anywhere from here. Please print or type: DUAL ENROLLMENT APPLICATION Last Name First Name Maiden/Middle Social Security # Local Address (include apt.
READY OR NOT? CALIFORNIA'S EARLY ASSESSMENT PROGRAM AND THE TRANSITION TO COLLEGE
 READY OR NOT? CALIFORNIA'S EARLY ASSESSMENT PROGRAM AND THE TRANSITION TO COLLEGE Michal Kurlaender University of California, Davis Policy Analysis for California Education March 16, 2012 This research
The following resolution is presented for approval to the Board of Trustees. RESOLUTION 16-
 1. Adoption of Wright State 2016 Campus Completion Plan The following resolution is presented for approval to the Board of Trustees. RESOLUTION 16- WHEREAS, Section 3345.81 of the Ohio Revised Code requires
MAINE 2011 For a strong economy, the skills gap must be closed.
 For a strong economy, the skills gap must be closed. 62% 36% 26% By 2020, jobs requiring a career certificate or college degree Skills gap Too few students make it through college. MEMBER Maine adults
National Survey of Student Engagement The College Student Report
 The College Student Report This is a facsimile of the NSSE survey (available at nsse.iub.edu/links/surveys). The survey itself is administered online. 1. During the current school year, about how often
LIM College New York, NY
 C O L L E G E P R O F I L E - O V E R V I E W LIM College New York, NY The Laboratory Institute of Merchandising, founded in 1939, is a private institute. Its facilities are located in Manhattan. Web Site
University of Maine at Augusta Augusta, ME
 C O L L E G E P R O F I L E - O V E R V I E W University of Maine at Augusta Augusta, ME U Maine at Augusta, founded in 1965, is a public university. Its 165-acre campus is located in Augusta, 50 miles
Iowa School District Profiles. Le Mars
 Iowa School District Profiles Overview This profile describes enrollment trends, student performance, income levels, population, and other characteristics of the public school district. The report utilizes
Institution of Higher Education Demographic Survey
 Institution of Higher Education Demographic Survey Data from all participating institutions are aggregated for the comparative studies by various types of institutional characteristics. For that purpose,
Transportation Equity Analysis
 2015-16 Transportation Equity Analysis Each year the Seattle Public Schools updates the Transportation Service Standards and bus walk zone boundaries for use in the upcoming school year. For the 2014-15
2010 National Survey of Student Engagement University Report
 National Survey of Student Engagement University Report Office of Assessment July 2011 NSSE Survey Summary Report The National Survey of Student Engagement (NSSE) is utilized at Kansas State University,
University of Arizona
 Annual Report Submission View Questionnaire (Edit) University of Arizona Annual Report Submission for the year 2009. Report has been submitted 1 times. Report was last submitted on 11/30/2009 7:12:09 PM.
SMILE Noyce Scholars Program Application
 ONLINE POST-BABACCALAUREATE TEACHER PREPARATION PROGRAM SMILE yce Scholars Program Application Introduction: Rio Salado College is soliciting applicants for the Science and Math Innovative Learning Environments
Sunnyvale Middle School School Accountability Report Card Reported Using Data from the School Year Published During
 Sunnyvale Middle School School Accountability Report Card Reported Using Data from the 2014-15 School Year Published During 2015-16 By February 1 of each year, every school in California is required by
Serving Country and Community: A Study of Service in AmeriCorps. A Profile of AmeriCorps Members at Baseline. June 2001
 Serving Country and Community: A Study of Service in AmeriCorps Cambridge, MA Lexington, MA Hadley, MA Bethesda, MD Washington, DC Chicago, IL Cairo, Egypt Johannesburg, South Africa A Profile of AmeriCorps
UW-Waukesha Pre-College Program. College Bound Take Charge of Your Future!
 UW-Waukesha Pre-College Program College Bound 2017 Take Charge of Your Future! This is a great program to increase your knowledge on various subjects. Students will be engaged in workshops and hands-on
The Condition of College & Career Readiness 2016
 The Condition of College and Career Readiness This report looks at the progress of the 16 ACT -tested graduating class relative to college and career readiness. This year s report shows that 64% of students
Financial aid: Degree-seeking undergraduates, FY15-16 CU-Boulder Office of Data Analytics, Institutional Research March 2017
 CU-Boulder financial aid, degree-seeking undergraduates, FY15-16 Page 1 Financial aid: Degree-seeking undergraduates, FY15-16 CU-Boulder Office of Data Analytics, Institutional Research March 2017 Contents
Student Support Services Evaluation Readiness Report. By Mandalyn R. Swanson, Ph.D., Program Evaluation Specialist. and Evaluation
 Student Support Services Evaluation Readiness Report By Mandalyn R. Swanson, Ph.D., Program Evaluation Specialist and Bethany L. McCaffrey, Ph.D., Interim Director of Research and Evaluation Evaluation
BARUCH RANKINGS: *Named Standout Institution by the
 THE BARUCH VALUE BARUCH RANKINGS: *#1 in CollegeNET s annual Social Mobility Index (out of over 900 colleges) for a second year in a row. *Named Standout Institution by the Baruch Background Baruch College
2012 New England Regional Forum Boston, Massachusetts Wednesday, February 1, More Than a Test: The SAT and SAT Subject Tests
 2012 New England Regional Forum Boston, Massachusetts Wednesday, February 1, 2012 More Than a Test: The SAT and SAT Subject Tests 1 Presenters Chris Lucier Vice President for Enrollment Management, University
DO SOMETHING! Become a Youth Leader, Join ASAP. HAVE A VOICE MAKE A DIFFERENCE BE PART OF A GROUP WORKING TO CREATE CHANGE IN EDUCATION
 DO SOMETHING! Become a Youth Leader, Join ASAP. HAVE A VOICE MAKE A DIFFERENCE BE PART OF A GROUP WORKING TO CREATE CHANGE IN EDUCATION The Coalition for Asian American Children and Families (CACF) is
Evaluation of a College Freshman Diversity Research Program
 Evaluation of a College Freshman Diversity Research Program Sarah Garner University of Washington, Seattle, Washington 98195 Michael J. Tremmel University of Washington, Seattle, Washington 98195 Sarah
Cooper Upper Elementary School
 LIVONIA PUBLIC SCHOOLS www.livoniapublicschools.org/cooper 213-214 BOARD OF EDUCATION 213-14 Mark Johnson, President Colleen Burton, Vice President Dianne Laura, Secretary Tammy Bonifield, Trustee Dan
5 Programmatic. The second component area of the equity audit is programmatic. Equity
 5 Programmatic Equity It is one thing to take as a given that approximately 70 percent of an entering high school freshman class will not attend college, but to assign a particular child to a curriculum
Bellevue University Bellevue, NE
 C O L L E G E P R O F I L E - O V E R V I E W Bellevue University Bellevue, NE Bellevue, founded in 1966, is a private university. Its campus is located in Bellevue, in the Omaha metropolitan area. Web
John F. Kennedy Middle School
 John F. Kennedy Middle School CUPERTINO UNION SCHOOL DISTRICT Steven Hamm, Principal hamm_steven@cusdk8.org School Address: 821 Bubb Rd. Cupertino, CA 95014-4938 (408) 253-1525 CDS Code: 43-69419-6046890
Demographic Survey for Focus and Discussion Groups
 Appendix F Demographic Survey for Focus and Discussion Groups Demographic Survey--Lesbian, Gay, and Bisexual Discussion Group Demographic Survey Faculty with Disabilities Discussion Group Demographic Survey
10/6/2017 UNDERGRADUATE SUCCESS SCHOLARS PROGRAM. Founded in 1969 as a graduate institution.
 UNDERGRADUATE SUCCESS SCHOLARS PROGRAM THE UNIVERSITY OF TEXAS AT DALLAS Founded in 1969 as a graduate institution. Began admitting upperclassmen in 1975 and began admitting underclassmen in 1990. 1 A
Practices Worthy of Attention Step Up to High School Chicago Public Schools Chicago, Illinois
 Step Up to High School Chicago Public Schools Chicago, Illinois Summary of the Practice. Step Up to High School is a four-week transitional summer program for incoming ninth-graders in Chicago Public Schools.
UDW+ Student Data Dictionary Version 1.7 Program Services Office & Decision Support Group
 UDW+ Student Data Dictionary Version 1.7 Program Services Office & Decision Support Group 1 Table of Contents Subject Areas... 3 SIS - Term Registration... 5 SIS - Class Enrollment... 12 SIS - Degrees...
Idaho Public Schools
 Advanced Placement: Student Participation 13.5% increase in the number of students participating between 25 and 26 In 26: 3,79 Idaho Public School Students took AP Exams In 25: 3,338 Idaho Public School
RAISING ACHIEVEMENT BY RAISING STANDARDS. Presenter: Erin Jones Assistant Superintendent for Student Achievement, OSPI
 RAISING ACHIEVEMENT BY RAISING STANDARDS Presenter: Erin Jones Assistant Superintendent for Student Achievement, OSPI Agenda Introductions Definitions History of the work Strategies Next steps Debrief
KENT STATE UNIVERSITY
 KENT STATE UNIVERSITY Regents STARTALK Teacher Leadership Academy: Chinese, Russian Director: Brian J. Baer / Co-director: Theresa A. Minick Program Dates: Thursday, July 7 - Saturday, July 16 Summer 2016
Wisconsin 4 th Grade Reading Results on the 2015 National Assessment of Educational Progress (NAEP)
") Wisconsin 4 th Grade Reading Results on the 2015 National Assessment of Educational Progress (NAEP) Main takeaways from the 2015 NAEP 4 th grade reading exam: Wisconsin scores have been statistically flat
Wisconsin 4 th Grade Reading Results on the 2015 National Assessment of Educational Progress (NAEP) Main takeaways from the 2015 NAEP 4 th grade reading exam: Wisconsin scores have been statistically flat
Fostering Equity and Student Success in Higher Education
 Fostering Equity and Student Success in Higher Education Laura I Rendón Professor Emerita University of Texas-San Antonio Presentation at NTCC 22 nd Annual Fall Leadership Conference Gainsesville, TX September
Kahului Elementary School
 Kahului Elementary Code: 405 Status and Improvement Report Year 2014-15 Focus On Standards Grades K-5 Focus on Standards Description Contents Setting Student Profile Community Profile Improvement Summary
Validation Requirements and Error Codes for Submitting Common Completion Metrics
 Validation Requirements and s for Submitting Common Completion s March 2015 Overview To ensure accurate reporting and quality data, Complete College America is committed to helping data submitters ensure
Samuel Enoka Kalama Intermediate School
 Code: 420 Samuel Enoka Kalama Intermediate Status and Improvement Report Year 2014-15 Focus On Standards Grades 6-8 Contents This Status and Improvement Report has been prepared as part of the Department's
An Empirical Analysis of the Effects of Mexican American Studies Participation on Student Achievement within Tucson Unified School District
 An Empirical Analysis of the Effects of Mexican American Studies Participation on Student Achievement within Tucson Unified School District Report Submitted June 20, 2012, to Willis D. Hawley, Ph.D., Special
Summary of Selected Data Charter Schools Authorized by Alameda County Board of Education
 Summary of Selected Data Charter Schools Authorized by Alameda County Board of Education Prepared for the Alameda County Board of Education November 10, 2015 Alameda County Office of Education Charter
Undergraduates Views of K-12 Teaching as a Career Choice
 Undergraduates Views of K-12 Teaching as a Career Choice A Report Prepared for The Professional Educator Standards Board Prepared by: Ana M. Elfers Margaret L. Plecki Elise St. John Rebecca Wedel University
A Diverse Student Body
 A Diverse Student Body No two diversity plans are alike, even when expressing the importance of having students from diverse backgrounds. A top-tier school that attracts outstanding students uses this
NC Education Oversight Committee Meeting
 NC Education Oversight Committee Meeting November 7, 2017 Nathan Currie, Superintendent Bridget Phifer, NCCA Board Chair Agenda School Demographics Achievements & Improvements Critical Needs Q&A Mission
Adapt and Overcome: Helping Student Veterans Transition to Academic Life
 Adapt and Overcome: Helping Student Veterans Transition to Academic Life Lisa Firmin, Associate Provost for Diversity and Recruitment Dr. Mary McNaughton-Cassill, Associate Professor Dr. Dianne P. Hengst,
SCHOOL. Wake Forest '93. Count
 Count ID 43 256 VALID N 256 Q.1A ACTIVITIES YEAR FOLLOWING GRADUATION? Primary Employed full-time 157 61.6% Employed part-time 12 4.7% Unemployed, by choice 3 1.2% Unemployed, seeking employment 7 2.7%
A Snapshot of the Graduate School
 A Snapshot of the Graduate School Prepared for the Research Council February 6, 2009 John R. Mullin, Ph.D., FAICP Dean of the Graduate School University of Massachusetts Amherst Graduate School Purpose
2012 ACT RESULTS BACKGROUND
 Report from the Office of Student Assessment 31 November 29, 2012 2012 ACT RESULTS AUTHOR: Douglas G. Wren, Ed.D., Assessment Specialist Department of Educational Leadership and Assessment OTHER CONTACT
Enrollment Trends. Past, Present, and. Future. Presentation Topics. NCCC enrollment down from peak levels
 Presentation Topics 1. Enrollment Trends 2. Attainment Trends Past, Present, and Future Challenges & Opportunities for NC Community Colleges August 17, 217 Rebecca Tippett Director, Carolina Demography
ACHE DATA ELEMENT DICTIONARY as of October 6, 1998
 ACHE DATA ELEMENT DICTIONARY as of October 6, 1998 Element Title: Reference Numbers: Institution FICE Code FICE ST010, GR010 The identification number for each reporting institution will be the institution's
Swarthmore College Common Data Set
 Swarthmore College Common Data Set 2015 2016 Office of Institutional Research Swarthmore College Common Data Set 2015-2016 Table of Contents Section Page A. General Information... 1 B. Enrollment and Persistence...
Race, Class, and the Selective College Experience
 Race, Class, and the Selective College Experience Thomas J. Espenshade Alexandria Walton Radford Chang Young Chung Office of Population Research Princeton University December 15, 2009 1 Overview of NSCE
This survey is intended for Pitt Public Health graduates from December 2013, April 2014, June 2014, and August EOH: MPH. EOH: PhD.
 Pitt Public Health Exit Survey This survey will ask you questions about your program and the services provided by the Office of Student Affairs, as well as your overall assessment of the Graduate School
National Survey of Student Engagement Spring University of Kansas. Executive Summary
 National Survey of Student Engagement Spring 2010 University of Kansas Executive Summary Overview One thousand six hundred and twenty-one (1,621) students from the University of Kansas completed the web-based
Hokulani Elementary School
 Hokulani Elementary Code: 109 Status and Improvement Report Year -11 Contents Focus On Standards Grades K-5 This Status and Improvement Report has been prepared as part of the Department's education accountability
February 1, Dear Members of the Brown Community,
 February 1, 2016 Dear Members of the Brown Community, In October of 2013, the Corporation of Brown University approved Brown s strategic plan, Building on Distinction. This plan aims to advance Brown s
Albany Technical College Overview Goals Student Success and Implementation Team Conclusion Next Steps...
 ?33333 Dr. Josephine Reed-Taylor Chief Academic Officer Technical College System of Georgia 1800 Century Place, NE Atlanta, Georgia 30345-4304 December 2015 Contents Albany Technical College... 8 Overview...
Annual Report to the Public. Dr. Greg Murry, Superintendent
 Annual Report to the Public Dr. Greg Murry, Superintendent 1 Conway Board of Education Ms. Susan McNabb Mr. Bill Clements Mr. Chuck Shipp Mr. Carl Barger Dr. Adam Lamey Dr. Quentin Washispack Mr. Andre
Effective Recruitment and Retention Strategies for Underrepresented Minority Students: Perspectives from Dental Students
 Critical Issues in Dental Education Effective Recruitment and Retention Strategies for Underrepresented Minority Students: Perspectives from Dental Students Naty Lopez, Ph.D.; Rose Wadenya, D.M.D., M.S.;
St. John Fisher College Rochester, NY
 C O L L E G E P R O F I L E - O V E R V I E W St. John Fisher College Rochester, NY St. John Fisher is a church-affiliated, liberal arts college. Founded in 1948 as a men's college, it adopted coeducation
SFY 2017 American Indian Opportunities and Industrialization Center (AIOIC) Equity Direct Appropriation
 Equity Direct Appropriation") SFY 2017 American Indian Opportunities and Industrialization Center (AIOIC) Equity Direct Appropriation Report to the Legislature as required by 2016 Minnesota Session Laws, Chapter 189, H.F. 2749, Article
SFY 2017 American Indian Opportunities and Industrialization Center (AIOIC) Equity Direct Appropriation Report to the Legislature as required by 2016 Minnesota Session Laws, Chapter 189, H.F. 2749, Article
El Toro Elementary School
 El Toro Elementary School 2013-14 Published During 2014-15 El Toro Elementary Contact Information (School Year 2014-15) 455 East Main Ave. Morgan Hill, CA 95037-3745 (408) 201-6380 Principal: Contact E-mail
CAMPUS PROFILE MEET OUR STUDENTS UNDERGRADUATE ADMISSIONS. The average age of undergraduates is 21; 78% are 22 years or younger.
 CAMPUS PROFILE MEET OUR STUDENTS Freshmen are defined here as all domestic students entering in fall quarter from high school. These statistics include information drawn from records available at UC Davis.
Kansas Adequate Yearly Progress (AYP) Revised Guidance
 Revised Guidance") Kansas State Department of Education Kansas Adequate Yearly Progress (AYP) Revised Guidance Based on Elementary & Secondary Education Act, No Child Left Behind (P.L. 107-110) Revised May 2010 Revised May
Kansas State Department of Education Kansas Adequate Yearly Progress (AYP) Revised Guidance Based on Elementary & Secondary Education Act, No Child Left Behind (P.L. 107-110) Revised May 2010 Revised May
Academic Advising and Career Exploration. PLTW State Conference 2015 Bayless School District
 Academic Advising and Career Exploration PLTW State Conference 2015 Bayless School District Bayless PLTW Academic Advising and Career Exploration Professional School Counselors are critical to the success
AMERICA READS*COUNTS PROGRAM EVALUATION. School Year
 AMERICA READS*COUNTS PROGRAM EVALUATION School Year 2014-15 October 2015 ABOUT THE LEDUC CENTER FOR CIVIC ENGAGEMENT The University of Massachusetts Dartmouth seeks to prepare students for life as active
STEM Academy Workshops Evaluation
 OFFICE OF INSTITUTIONAL RESEARCH RESEARCH BRIEF #882 August 2015 STEM Academy Workshops Evaluation By Daniel Berumen, MPA Introduction The current report summarizes the results of the research activities
Upward Bound Math & Science Program
 Upward Bound Math & Science Program A College-Prep Program sponsored by Northern Arizona University New for Program Year 2015-2016 Students participate year-round each year beginning in 2016 January May
A Guide to Adequate Yearly Progress Analyses in Nevada 2007 Nevada Department of Education
 A Guide to Adequate Yearly Progress Analyses in Nevada 2007 Nevada Department of Education Note: Additional information regarding AYP Results from 2003 through 2007 including a listing of each individual
OFFICE OF ENROLLMENT MANAGEMENT. Annual Report
 2014-2015 OFFICE OF ENROLLMENT MANAGEMENT Annual Report Table of Contents 2014 2015 MESSAGE FROM THE VICE PROVOST A YEAR OF RECORDS 3 Undergraduate Enrollment 6 First-Year Students MOVING FORWARD THROUGH