Faculty and Staff Survey Results
|
|
|
- Dale Wilkerson
- 5 years ago
- Views:
Transcription
1 Faculty and Staff Survey Results To further engage UM faculty and staff, the SPCC designed a survey link via Qualtrics to send to approximately 3,000 UM faculty and staff (this includes Mountain campus, Missoula College, and Bitterroot College). The survey was open for 7 days and 475 faculty and staff completed the survey for a sixteen percent response rate. To remain consistent with the questions we asked in the one-on-one interviews, data cards, and quantitative business survey, we asked questions ranging from day-to-day job responsibilities, perceptions about workplace culture, current concerns, and ideas for the future. The following discussion is organized by: 1) demographics of those who took the survey; 2) influential factors in faculty and staff decisions to work at UM; 3) perceptions and experiences at UM; and 4) level of engagement. This report provides a sample of findings. A full list of the responses is at the end of this report. Demographic Information Table 1 presents the demographic information for the faculty and staff survey. The majority of participants are white men, much like the business survey. Most respondents are within the ages of and are highly educated 31 percent have a graduate or professional degree and 28 percent have a doctorate. Also, the majority are staff 60 percent from the mountain campus. Keep in mind some of the percentages do not equal 100 percent. This is explainable respondents could select the option prefer not the answer. Table 1: Demographics for UM Faculty & Staff Survey Survey Respondents Gender Male Female 59% 32% Age Job Type older Faculty Staff 3% 17% 26% 25% 24% 2% 38% 60% Level of Education High School Degree College Degree Graduate or Professional Degree Doctorate Degree Race or Ethnicity White, non-hispanic African American Latino/Hispanic American Indian of Alaska Native Asian or Pacific Islander 2% 35% 31% 28% 85% 0.2% 1% 3% 1% 1
.")
2 Decisions to Work at UM Again, the purpose here is to provide an overview of some of the findings. Figure 1 graphically illustrates why individuals decided to work for UM. Survey participants were provided a list of statements and were asked to rank their level of agreement with these statements using a 5-point Likert scale (1 = no influence; 5 = a lot of influence). The leading reasons why faculty and staff choose to work at UM are attractiveness of the area, local community, and flexibility of work schedule. The graphic also depicts some of the reasons that were not included (mean score below a 2) in a person s decision to work at UM: childcare benefits, ability to telecommute, resources for research/creative scholarship/training, or conferences in an employee s respective field. Figure 1: Decision to Work at the UM 2


3 Figure 2 provides findings that explain driving differences between men and women. For example, women s decision to work for UM was more strongly influenced by competitive benefits, ability to telecommute, and education opportunities than men. Figure 2: Gender and Decisions to Work at UM Figure 3 examines variations between UM faculty and staff. We are somewhat cautious about these results since 60 percent of our sample is staff. With this said, staff, more than faculty, were drawn to work at UM for competitive benefits. Comparatively, faculty were slightly more inclined to work for UM due to their ability to innovate. Figure 3: Faculty and Staff Comparison: Decision to Work Perceptions and Experiences In addition to deciphering why individuals were drawn and continue to work at UM, we evaluated overall perceptions. Survey participants were asked, what is your overall perception of the work environment at UM, and we provided a 5-point Likert scale (1 = not positive; 5 = very positive). Figure 4 illustrates that most respondents (34 percent) are neutral, while (30 percent) are somewhat positive about how they perceive the current UM work environment. 3
.")

4 Figure 4: Perceptions, UM Work Environment Figure 5 examines the mean scores for a series of statements where individuals could rate on a scale from 1-5 (1 = strongly disagree; 5 = strongly agree). There is some level of agreement that individuals are held to high levels of professional standards, but there is concern that UM does not provide a mentorship program, opportunities for career advancement or a shared vision between faculty and staff. Figure 5: UM Experience 4
5 Table 2 presents additional rationales for perceptions about the UM workplace environment. Individuals on the UM Mountain campus have a slightly higher level of agreement in their job security. The Mountain campus and Missoula College demonstrate a lower level of agreement for a shared vision between faculty and staff in comparison to Bitterroot College. Table 2: Campus Comparisons Question Type Mean Score for Mountain Campus Mean Score for Missoula College Mean Score for Bitterroot College Job security Shared vision between faculty and staff Engagement Figure 6 shows that UM faculty and staff are somewhat engaged in service activities across campuses. Figure 6: Level of Engagement 5
6 Faculty/Staff Survey Responses Per Question 1.Please use the following scale: 1 (no influence) to 5 (a lot of influence) in your decision to work for the University of Montana Job Security -No influence or little influence: 19.9% -Moderate influence: 22.7% -Much Influence or a lot of Influence: 57.4% Competitive Benefits -No Influence or little Influence: 16.9% -Moderate influence: 20.6% -Much Influence or a lot of Influence: 62.5% Local community -No Influence or little influence: 12.8% -Moderate influence: 16.3% -Much Influence or a lot of influence: 70.9% Identify with the mission of the University -No Influence or little influence: 22.8% -Moderate influence: 25% -Much Influence or a lot of influence: 52.2% Future opportunities for advancement -No Influence or little influence: 40.1% -Moderate influence: 22.4% -Much Influence or a lot of influence: 37.5% Flexibility of work schedule -No Influence or little influence: 13.5% -Moderate influence: 21% -Much Influence or a lot of influence: 65.5% Ability to innovate -No Influence or little influence:19.3% -Moderate influence: 22.5% -Much Influence or a lot of influence: 58.2% Competitive salary -No Influence or little influence: 51.8% -Moderate influence: 17.4% -Much Influence or a lot of influence: 30.8% Autonomy or ability to provide input for decisions -No Influence or little influence: 22.6% -Moderate influence: 20.6% -Much Influence or a lot of influence: 56.8% Ability to telecommute -No Influence or little influence: 62.9% -Moderate influence: 18.3% -Much Influence or a lot of influence: 18.9% Resources for research/creative scholarship/training/conferences in your field -No Influence or little influence: 49.6% -Moderate influence: 20.6% -Much Influence or a lot of influence: 29.8% Childcare benefits -No Influence or little influence: 83.3% -Moderate influence: 10% 6
7 -Much Influence or a lot of influence: 6.7% Educational opportunities -No Influence or little influence: 38% -Moderate influence: 23.6% -Much Influence or a lot of influence: 38.4% Attractiveness of living in the area -No Influence or little influence: 13.5% -Moderate influence: 14.1% -Much Influence or a lot of influence: 72.3% 2. On a scale from one (not positive) to 5 (very positive), what is your overall perception of the University of Montana? (circle one from below). 1 (7.3%) 2 (23.7%) 3 (34.7%) 4 (30.4%) 5 (3.9%) 3.In thinking about your own experiences at UM, what is your level of agreement with the following statements on a scale from one (strongly disagree) to 5 (strongly agree): I have adequate financial support for professional Development -Strongly Disagree or Disagree45.3% -Neutral: 21.8% -Agree or Strongly Agree: 32.9 There is support for new employees -Strongly Disagree or Disagree: 44.4% -Neutral: 27.7% -Agree or Strongly Agree: 27.9% I have the ability to address an issue with leadership [chair, dean, provost, manager] -Strongly Disagree or Disagree: 29.2% -Neutral: 25.2% -Agree or Strongly Agree: 45.6% I have a mentor for my current position -Strongly Disagree or Disagree: 51.1% -Neutral: 17% -Agree or Strongly Agree: 31.8% Faculty and Staff have a shared vision -Strongly Disagree or Disagree: 50.8% -Neutral: 28.3% -Agree or Strongly Agree: 20.9% I am held to high professional standards for the work I do -Strongly Disagree or Disagree: 8.1% -Neutral: 13.8% -Agree or Strongly Agree: 78.1% My performance evaluations are held in a professional manner -Strongly Disagree or Disagree: 15.2% -Neutral: 24.8% -Agree or Strongly Agree: 60% I believe there is an atmosphere of trust and respect within the University -Strongly Disagree or Disagree: 50.1% -Neutral: 24.8% -Agree or Strongly Agree: 25.1% 7
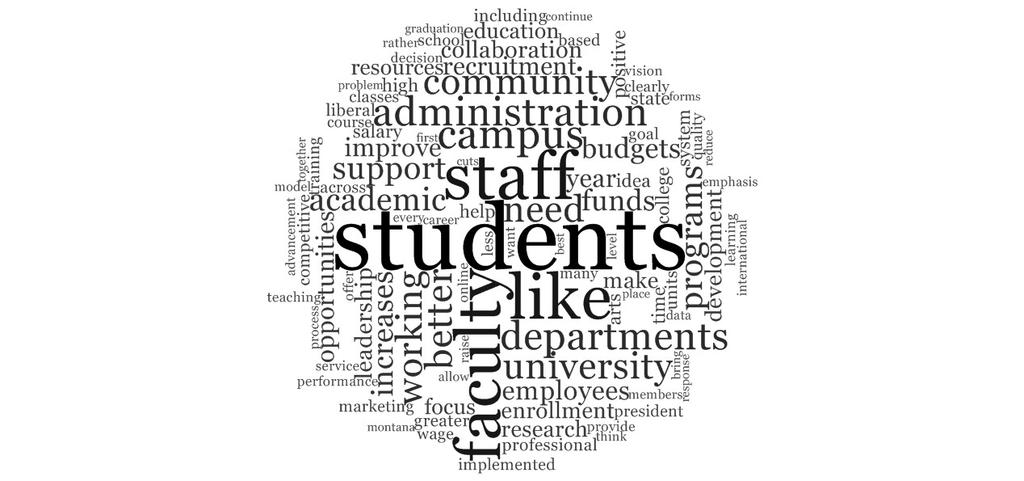
8 I receive constructive feedback in order to improve my job performance Strongly Disagree or Disagree: 27.5% Neutral: 24.3% Agree or Strongly Agree: What one idea would make the University of Montana distinctive? Please use the space provided below to answer. This answer was a fill in the blank. We used NVivo (qualitative software) to produce word count (most used), and word tree/cloud to provide a graphical illustrations of these statements. Word Count Weighted Percentage (%) Similar Words students student, students staff Staff faculty Faculty campus campus, campuses administration administration, administrative, administrators departments department, departments better better, betterment communication communicate, communicated, communication, communications, communities, community university universities, university programs program, programming, programs academic academic, academics support support, supported, supporting increases increase, increased, increases, increasing budgets budget, budgeting, budgets employees employee, employees funds funded, funding, funds improve improve, improved, improvement opportunities opportunities, opportunity recruitment recruit, recruiting, recruitment collaboration collaborate, collaboration, collaborations, collaborative 8
9 9
10 10
11 11
12 12
13 5. Please select one option for the list below that best reflects your gender. - Female (58.8%) - Male (31.4%) - Prefer to self-describe (please specify) (1%) - Prefer not to answer (6.6%) 6. I am: - Faculty (38.2%) - Staff (59.6%) - Prefer not to answer (2.2%) 7. My highest level of education is (check one from the list below): - High School Diploma (1.6%) 13
14 - Some college (7.6%) - Bachelor s degree/4 year college degree (26.6%) - Master s degree (28.8%) - Professional degree (e.g. law degree) (2.8%) - Doctorate degree (28.2%) - Prefer not to answer (2.0%) 8. My age range is (check one from the list below): - 18 to 24 (2.9%) - 25 to 34 (16.9%) - 35 to 44 (26.2%) - 45 to 54 (24.8%) - 55 to 64 (24%) - 65 or older (5.2%) 9. What is your race or ethnic background? (check all that apply) - White, non-hispanic (85.8%) - African American (0.2%) - Latino/Hispanic (1.2%) - American Indian or Alaska Native (3%) - Asian or Pacific Islander (1.2%) - Other (0.4%) - Prefer not to answer (8.6%) 14
Status of Women of Color in Science, Engineering, and Medicine
 Status of Women of Color in Science, Engineering, and Medicine The figures and tables below are based upon the latest publicly available data from AAMC, NSF, Department of Education and the US Census Bureau.
Port Graham El/High. Report Card for
 School: District: Kenai Peninsula Grades: K - 12 School Enrollment: 20 Title I School? No Title 1 Program: Accreditation: Report Card for 2008-2009 A Title 1 school receives federal money in support low-achieving
Demographic Survey for Focus and Discussion Groups
 Appendix F Demographic Survey for Focus and Discussion Groups Demographic Survey--Lesbian, Gay, and Bisexual Discussion Group Demographic Survey Faculty with Disabilities Discussion Group Demographic Survey
Iowa School District Profiles. Le Mars
 Iowa School District Profiles Overview This profile describes enrollment trends, student performance, income levels, population, and other characteristics of the public school district. The report utilizes
University of Utah. 1. Graduation-Rates Data a. All Students. b. Student-Athletes
 University of Utah FRESHMAN-COHORT GRADUATION RATES All Students Student-Athletes # 2009-10 Graduation Rate 64% 64% Four-Class Average 61% 64% Student-Athlete Graduation Success Rate 87% 1. Graduation-Rates
12-month Enrollment
 12-month Enrollment 2016-17 Institution: Potomac State College of West Virginia University (237701) Overview 12-month Enrollment Overview The 12-Month Enrollment component collects unduplicated student
File Print Created 11/17/2017 6:16 PM 1 of 10
 Success - Key Measures Graduation Rate: 4-, 5-, and 6-Year 9. First-time, full-time entering, degree-seeking, students enrolled in a minimum of 12 SCH their first fall semester who have graduated from
Educational Attainment
 A Demographic and Socio-Economic Profile of Allen County, Indiana based on the 2010 Census and the American Community Survey Educational Attainment A Review of Census Data Related to the Educational Attainment
Effective Recruitment and Retention Strategies for Underrepresented Minority Students: Perspectives from Dental Students
 Critical Issues in Dental Education Effective Recruitment and Retention Strategies for Underrepresented Minority Students: Perspectives from Dental Students Naty Lopez, Ph.D.; Rose Wadenya, D.M.D., M.S.;
Shelters Elementary School
 Shelters Elementary School August 2, 24 Dear Parents and Community Members: We are pleased to present you with the (AER) which provides key information on the 23-24 educational progress for the Shelters
STEM Academy Workshops Evaluation
 OFFICE OF INSTITUTIONAL RESEARCH RESEARCH BRIEF #882 August 2015 STEM Academy Workshops Evaluation By Daniel Berumen, MPA Introduction The current report summarizes the results of the research activities
Undergraduates Views of K-12 Teaching as a Career Choice
 Undergraduates Views of K-12 Teaching as a Career Choice A Report Prepared for The Professional Educator Standards Board Prepared by: Ana M. Elfers Margaret L. Plecki Elise St. John Rebecca Wedel University
Principal vacancies and appointments
 Principal vacancies and appointments 2009 10 Sally Robertson New Zealand Council for Educational Research NEW ZEALAND COUNCIL FOR EDUCATIONAL RESEARCH TE RŪNANGA O AOTEAROA MŌ TE RANGAHAU I TE MĀTAURANGA
Student Mobility Rates in Massachusetts Public Schools
 Student Mobility Rates in Massachusetts Public Schools Introduction The Massachusetts Department of Elementary and Secondary Education (ESE) calculates and reports mobility rates as part of its overall
Transportation Equity Analysis
 2015-16 Transportation Equity Analysis Each year the Seattle Public Schools updates the Transportation Service Standards and bus walk zone boundaries for use in the upcoming school year. For the 2014-15
Frank Phillips College. Accountability Report
 Frank Phillips College Accountability Report January 2016 Accountability System, January 2016 1 of 22 Participation - Key Measures Enrollment 1. Fall Headcount (Unduplicated) Fall 2000 Fall 2014 Fall 2015
University of Arizona
 Annual Report Submission View Questionnaire (Edit) University of Arizona Annual Report Submission for the year 2009. Report has been submitted 1 times. Report was last submitted on 11/30/2009 7:12:09 PM.
Data Diskette & CD ROM
 Data File Format Data Diskette & CD ROM Texas Assessment of Academic Skills Fall 2002 through Summer 2003 Exit Level Test Administrations Attention Macintosh Users To accommodate Macintosh systems a delimiter
A Diverse Student Body
 A Diverse Student Body No two diversity plans are alike, even when expressing the importance of having students from diverse backgrounds. A top-tier school that attracts outstanding students uses this
https://secure.aacte.org/apps/peds/print_all_forms.php?view=report&prin...
 1 of 35 4/25/2012 9:56 AM A» 2011 PEDS» Institutional Data inst id: 3510 Institutional Data A_1 Institutional Information This information will be used in all official references to your institution. Institution
Abu Dhabi Indian. Parent Survey Results
 Abu Dhabi Indian Parent Survey Results 2016-2017 Parent Survey Results Academic Year 2016/2017 September 2017 Research Office The Research Office conducts surveys to gather qualitative and quantitative
Coming in. Coming in. Coming in
 212-213 Report Card for Glenville High School SCHOOL DISTRICT District results under review by the Ohio Department of Education based upon 211 findings by the Auditor of State. Achievement This grade combines
Student Support Services Evaluation Readiness Report. By Mandalyn R. Swanson, Ph.D., Program Evaluation Specialist. and Evaluation
 Student Support Services Evaluation Readiness Report By Mandalyn R. Swanson, Ph.D., Program Evaluation Specialist and Bethany L. McCaffrey, Ph.D., Interim Director of Research and Evaluation Evaluation
National Survey of Student Engagement Spring University of Kansas. Executive Summary
 National Survey of Student Engagement Spring 2010 University of Kansas Executive Summary Overview One thousand six hundred and twenty-one (1,621) students from the University of Kansas completed the web-based
Serving Country and Community: A Study of Service in AmeriCorps. A Profile of AmeriCorps Members at Baseline. June 2001
 Serving Country and Community: A Study of Service in AmeriCorps Cambridge, MA Lexington, MA Hadley, MA Bethesda, MD Washington, DC Chicago, IL Cairo, Egypt Johannesburg, South Africa A Profile of AmeriCorps
A Guide to Finding Statistics for Students
 San Joaquin Valley Statistics http://pegasi.us/sjstats/ 1 of 2 6/12/2010 5:00 PM A Guide to Finding Statistics for Students CV Stats Home By Topic By Area About the Valley About this Site Population Agriculture
Raw Data Files Instructions
 Raw Data Files Instructions Colleges will report the above information for students in the Main Cohort for each of the reporting timeframes and the system will calculate the sub cohorts and metrics based
Aalya School. Parent Survey Results
 Aalya School Parent Survey Results 2016-2017 Parent Survey Results Academic Year 2016/2017 September 2017 Research Office The Research Office conducts surveys to gather qualitative and quantitative data
Abu Dhabi Grammar School - Canada
 Abu Dhabi Grammar School - Canada Parent Survey Results 2016-2017 Parent Survey Results Academic Year 2016/2017 September 2017 Research Office The Research Office conducts surveys to gather qualitative
Harrassment: offensive, hostile, or intimidating conduct that interfered unreasonably with their ability to work or learn on campus.
 Harrassment: offensive, hostile, or intimidating conduct that interfered unreasonably with their ability to work or learn on campus. 17 % of respondents believed that they had personally experienced harassment
National Survey of Student Engagement The College Student Report
 The College Student Report This is a facsimile of the NSSE survey (available at nsse.iub.edu/links/surveys). The survey itself is administered online. 1. During the current school year, about how often
Lesson M4. page 1 of 2
 Lesson M4 page 1 of 2 Miniature Gulf Coast Project Math TEKS Objectives 111.22 6b.1 (A) apply mathematics to problems arising in everyday life, society, and the workplace; 6b.1 (C) select tools, including
Los Angeles City College Student Equity Plan. Signature Page
 Los Angeles City College Student Equity Plan Signature Page Los Angeles Community College Los Angeles City College President, Board of Trustees Date District Chancellor: College President: Academic Senate
Cooper Upper Elementary School
 LIVONIA PUBLIC SCHOOLS http://cooper.livoniapublicschools.org 215-216 Annual Education Report BOARD OF EDUCATION 215-16 Colleen Burton, President Dianne Laura, Vice President Tammy Bonifield, Secretary
Supply and Demand of Instructional School Personnel
 Supply and Demand of Instructional School Personnel Presentation to the 82 nd Annual Virginia Middle and High School Principals Conference and Exposition Mrs. Patty S. Pitts Assistant Superintendent of
APPLICANT INFORMATION. Area Code: Phone: Area Code: Phone:
 MARQUETTE UNIVERSITY HEALTH CAREERS OPPORTUNITY PROGRAM College Science Enrichment Program (CSEP) & Pre-Enrollment Support Program (PESP) Website: http://www.mu.edu/hcop INSTRUCTIONS: Please type or print
KENT STATE UNIVERSITY
 KENT STATE UNIVERSITY Regents STARTALK Teacher Leadership Academy: Chinese, Russian Director: Brian J. Baer / Co-director: Theresa A. Minick Program Dates: Thursday, July 7 - Saturday, July 16 Summer 2016
John F. Kennedy Middle School
 John F. Kennedy Middle School CUPERTINO UNION SCHOOL DISTRICT Steven Hamm, Principal hamm_steven@cusdk8.org School Address: 821 Bubb Rd. Cupertino, CA 95014-4938 (408) 253-1525 CDS Code: 43-69419-6046890
NATIONAL CENTER FOR EDUCATION STATISTICS
 NATIONAL CENTER FOR EDUCATION STATISTICS Palm Desert, CA The Integrated Postsecondary Education Data System (IPEDS) is the nation s core postsecondary education data collection program. It is a single,
Adapt and Overcome: Helping Student Veterans Transition to Academic Life
 Adapt and Overcome: Helping Student Veterans Transition to Academic Life Lisa Firmin, Associate Provost for Diversity and Recruitment Dr. Mary McNaughton-Cassill, Associate Professor Dr. Dianne P. Hengst,
Segmentation Study of Tulsa Area Higher Education Needs Ages 36+ March Prepared for: Conducted by:
 Segmentation Study of Tulsa Area Higher Education Needs Ages 36+ March 2004 * * * Prepared for: Tulsa Community College Tulsa, OK * * * Conducted by: Render, vanderslice & Associates Tulsa, Oklahoma Project
46 Children s Defense Fund
 Nationally, about 1 in 15 teens ages 16 to 19 is a dropout. Fewer than two-thirds of 9 th graders in Florida, Georgia, Louisiana and Nevada graduate from high school within four years with a regular diploma.
Facts and Figures Office of Institutional Research and Planning
 Facts and Figures 2008-2009 Office of Institutional Research and Planning Office of Institutional Research Fall 2009 Facts at a Glance Credit Headcount Enrollments Headcount Ethnicity Headcount Percent
PUBLIC INFORMATION POLICY
 CALIFORNIA STATE POLYTECHNIC UNIVERSITY, POMONA Landscape Architecture College of Environmental Design PUBLIC INFORMATION POLICY Landscape Architecture Accreditation Board (LAAB) accredited programs are
5 Programmatic. The second component area of the equity audit is programmatic. Equity
 5 Programmatic Equity It is one thing to take as a given that approximately 70 percent of an entering high school freshman class will not attend college, but to assign a particular child to a curriculum
Best Colleges Main Survey
 Best Colleges Main Survey Date submitted 5/12/216 18::56 Introduction page 1 / 146 BEST COLLEGES Data Collection U.S. News has begun collecting data for the 217 edition of Best Colleges. The U.S. News
Appendix K: Survey Instrument
 Journal of Southeast Asian American Education and Advancement Volume Article 12 2011 Appendix K: Survey Instrument Wayne E. Wright University of Texas, San Antonio, wewright@purdue.edu Sovicheth Boun The
This survey is intended for Pitt Public Health graduates from December 2013, April 2014, June 2014, and August EOH: MPH. EOH: PhD.
 Pitt Public Health Exit Survey This survey will ask you questions about your program and the services provided by the Office of Student Affairs, as well as your overall assessment of the Graduate School
UW-Waukesha Pre-College Program. College Bound Take Charge of Your Future!
 UW-Waukesha Pre-College Program College Bound 2017 Take Charge of Your Future! This is a great program to increase your knowledge on various subjects. Students will be engaged in workshops and hands-on
Table of Contents. Internship Requirements 3 4. Internship Checklist 5. Description of Proposed Internship Request Form 6. Student Agreement Form 7
 Table of Contents Section Page Internship Requirements 3 4 Internship Checklist 5 Description of Proposed Internship Request Form 6 Student Agreement Form 7 Consent to Release Records Form 8 Internship
Evaluation of Teach For America:
 EA15-536-2 Evaluation of Teach For America: 2014-2015 Department of Evaluation and Assessment Mike Miles Superintendent of Schools This page is intentionally left blank. ii Evaluation of Teach For America:
Institution of Higher Education Demographic Survey
 Institution of Higher Education Demographic Survey Data from all participating institutions are aggregated for the comparative studies by various types of institutional characteristics. For that purpose,
SASKATCHEWAN MINISTRY OF ADVANCED EDUCATION
 SASKATCHEWAN MINISTRY OF ADVANCED EDUCATION Report March 2017 Report compiled by Insightrix Research Inc. 1 3223 Millar Ave. Saskatoon, Saskatchewan T: 1-866-888-5640 F: 1-306-384-5655 Table of Contents
OUCH! That Stereotype Hurts Cultural Competence & Linguistic Training Summary of Evaluation Results June 30, 2014
 OUCH! That Stereotype Hurts Cultural Competence & Linguistic Training Summary of Evaluation Results June 30, 2014 > Participant demographics > Pre/post/3-month evaluation of participant: - knowledge about
10/6/2017 UNDERGRADUATE SUCCESS SCHOLARS PROGRAM. Founded in 1969 as a graduate institution.
 UNDERGRADUATE SUCCESS SCHOLARS PROGRAM THE UNIVERSITY OF TEXAS AT DALLAS Founded in 1969 as a graduate institution. Began admitting upperclassmen in 1975 and began admitting underclassmen in 1990. 1 A
Final. Developing Minority Biomedical Research Talent in Psychology: The APA/NIGMS Project
 Final Report Developing Minority Biomedical Research Talent in Psychology: A Collaborative and Systemic Approach for Strengthening Institutional Capacity for Recruitment, Retention, Training, and Research
Updated: December Educational Attainment
 Updated: Educational Attainment Among 25- to 29-year olds, the proportions who have attained a high school education, some college, or a bachelor s degree are all rising, according to longterm trends.
Race, Class, and the Selective College Experience
 Race, Class, and the Selective College Experience Thomas J. Espenshade Alexandria Walton Radford Chang Young Chung Office of Population Research Princeton University December 15, 2009 1 Overview of NSCE
SMILE Noyce Scholars Program Application
 ONLINE POST-BABACCALAUREATE TEACHER PREPARATION PROGRAM SMILE yce Scholars Program Application Introduction: Rio Salado College is soliciting applicants for the Science and Math Innovative Learning Environments
Psychometric Research Brief Office of Shared Accountability
 August 2012 Psychometric Research Brief Office of Shared Accountability Linking Measures of Academic Progress in Mathematics and Maryland School Assessment in Mathematics Huafang Zhao, Ph.D. This brief
READY OR NOT? CALIFORNIA'S EARLY ASSESSMENT PROGRAM AND THE TRANSITION TO COLLEGE
 READY OR NOT? CALIFORNIA'S EARLY ASSESSMENT PROGRAM AND THE TRANSITION TO COLLEGE Michal Kurlaender University of California, Davis Policy Analysis for California Education March 16, 2012 This research
SFY 2017 American Indian Opportunities and Industrialization Center (AIOIC) Equity Direct Appropriation
 Equity Direct Appropriation") SFY 2017 American Indian Opportunities and Industrialization Center (AIOIC) Equity Direct Appropriation Report to the Legislature as required by 2016 Minnesota Session Laws, Chapter 189, H.F. 2749, Article
SFY 2017 American Indian Opportunities and Industrialization Center (AIOIC) Equity Direct Appropriation Report to the Legislature as required by 2016 Minnesota Session Laws, Chapter 189, H.F. 2749, Article
Summary of Selected Data Charter Schools Authorized by Alameda County Board of Education
 Summary of Selected Data Charter Schools Authorized by Alameda County Board of Education Prepared for the Alameda County Board of Education November 10, 2015 Alameda County Office of Education Charter
An Introduction and Overview to Google Apps in K12 Education: A Web-based Instructional Module
 An Introduction and Overview to Google Apps in K12 Education: A Web-based Instructional Module James Petersen Department of Educational Technology University of Hawai i at Mānoa. Honolulu, Hawaii, U.S.A.
EDUCATIONAL ATTAINMENT
 EDUCATIONAL ATTAINMENT By 2030, at least 60 percent of Texans ages 25 to 34 will have a postsecondary credential or degree. Target: Increase the percent of Texans ages 25 to 34 with a postsecondary credential.
EDUCATIONAL ATTAINMENT
 EDUCATIONAL ATTAINMENT By 2030, at least 60 percent of Texans ages 25 to 34 will have a postsecondary credential or degree. Target: Increase the percent of Texans ages 25 to 34 with a postsecondary credential.
ILLINOIS DISTRICT REPORT CARD
 -6-525-2- HAZEL CREST SD 52-5 HAZEL CREST SD 52-5 HAZEL CREST, ILLINOIS and federal laws require public school districts to release report cards to the public each year. 2 7 ILLINOIS DISTRICT REPORT CARD
Cooper Upper Elementary School
 LIVONIA PUBLIC SCHOOLS www.livoniapublicschools.org/cooper 213-214 BOARD OF EDUCATION 213-14 Mark Johnson, President Colleen Burton, Vice President Dianne Laura, Secretary Tammy Bonifield, Trustee Dan
ILLINOIS DISTRICT REPORT CARD
 -6-525-2- Hazel Crest SD 52-5 Hazel Crest SD 52-5 Hazel Crest, ILLINOIS 2 8 ILLINOIS DISTRICT REPORT CARD and federal laws require public school districts to release report cards to the public each year.
Sunnyvale Middle School School Accountability Report Card Reported Using Data from the School Year Published During
 Sunnyvale Middle School School Accountability Report Card Reported Using Data from the 2014-15 School Year Published During 2015-16 By February 1 of each year, every school in California is required by
Strategic Plan Dashboard Results. Office of Institutional Research and Assessment
 29-21 Strategic Plan Dashboard Results Office of Institutional Research and Assessment Binghamton University Office of Institutional Research and Assessment Definitions Fall Undergraduate and Graduate
The Condition of College & Career Readiness 2016
 The Condition of College and Career Readiness This report looks at the progress of the 16 ACT -tested graduating class relative to college and career readiness. This year s report shows that 64% of students
Campus Diversity & Inclusion Strategic Plan
 Campus Diversity & Inclusion Strategic Plan 1 Table of Contents Message from the President... 3 Executive Summary... 4 Goals of the 2020 Vision Plan... 5 Functional Definition of Diversity... 7 Four Dimensions
DLM NYSED Enrollment File Layout for NYSAA
 Enrollment Field Definitions AYP_School_ Identifier Alphanumeric; 30 No The BEDSCODE of the DISTRICT that has Committee on Special Education (CSE) responsibility for the student. Must include any leading
(Includes a Detailed Analysis of Responses to Overall Satisfaction and Quality of Academic Advising Items) By Steve Chatman
 By Steve Chatman") Report #202-1/01 Using Item Correlation With Global Satisfaction Within Academic Division to Reduce Questionnaire Length and to Raise the Value of Results An Analysis of Results from the 1996 UC Survey
Report #202-1/01 Using Item Correlation With Global Satisfaction Within Academic Division to Reduce Questionnaire Length and to Raise the Value of Results An Analysis of Results from the 1996 UC Survey
February 1, Dear Members of the Brown Community,
 February 1, 2016 Dear Members of the Brown Community, In October of 2013, the Corporation of Brown University approved Brown s strategic plan, Building on Distinction. This plan aims to advance Brown s
Denver Public Schools
 2017 Candidate Surveys Denver Public Schools Denver School Board District 4: Northeast DPS District 4 - Introduction School board elections offer community members the opportunity to reflect on the state
National Survey of Student Engagement
 National Survey of Student Engagement Report to the Champlain Community Authors: Michelle Miller and Ellen Zeman, Provost s Office 12/1/2007 This report supplements the formal reports provided to Champlain
A Guide to Adequate Yearly Progress Analyses in Nevada 2007 Nevada Department of Education
 A Guide to Adequate Yearly Progress Analyses in Nevada 2007 Nevada Department of Education Note: Additional information regarding AYP Results from 2003 through 2007 including a listing of each individual
Arden Middle Secondary Main Report
 Secondary 2014-2015 Main Report This report was prepared by WestEd, a research, development, and service agency, in collaboration with Duerr Evaluation Resources, under contract from the California Department
OFFICE OF ENROLLMENT MANAGEMENT. Annual Report
 2014-2015 OFFICE OF ENROLLMENT MANAGEMENT Annual Report Table of Contents 2014 2015 MESSAGE FROM THE VICE PROVOST A YEAR OF RECORDS 3 Undergraduate Enrollment 6 First-Year Students MOVING FORWARD THROUGH
2012 ACT RESULTS BACKGROUND
 Report from the Office of Student Assessment 31 November 29, 2012 2012 ACT RESULTS AUTHOR: Douglas G. Wren, Ed.D., Assessment Specialist Department of Educational Leadership and Assessment OTHER CONTACT
CAMPUS PROFILE MEET OUR STUDENTS UNDERGRADUATE ADMISSIONS. The average age of undergraduates is 21; 78% are 22 years or younger.
 CAMPUS PROFILE MEET OUR STUDENTS Freshmen are defined here as all domestic students entering in fall quarter from high school. These statistics include information drawn from records available at UC Davis.
Annual Report to the Public. Dr. Greg Murry, Superintendent
 Annual Report to the Public Dr. Greg Murry, Superintendent 1 Conway Board of Education Ms. Susan McNabb Mr. Bill Clements Mr. Chuck Shipp Mr. Carl Barger Dr. Adam Lamey Dr. Quentin Washispack Mr. Andre
Fostering Equity and Student Success in Higher Education
 Fostering Equity and Student Success in Higher Education Laura I Rendón Professor Emerita University of Texas-San Antonio Presentation at NTCC 22 nd Annual Fall Leadership Conference Gainsesville, TX September
Greek Teachers Attitudes toward the Inclusion of Students with Special Educational Needs
 American Journal of Educational Research, 2014, Vol. 2, No. 4, 208-218 Available online at http://pubs.sciepub.com/education/2/4/6 Science and Education Publishing DOI:10.12691/education-2-4-6 Greek Teachers
The Demographic Wave: Rethinking Hispanic AP Trends
 The Demographic Wave: Rethinking Hispanic AP Trends Kelcey Edwards & Ellen Sawtell AP Annual Conference, Las Vegas, NV July 19, 2013 Exploring the Data Hispanic/Latino US public school graduates The Demographic
U VA THE CHANGING FACE OF UVA STUDENTS: SSESSMENT. About The Study
 About The Study U VA SSESSMENT In 6, the University of Virginia Office of Institutional Assessment and Studies undertook a study to describe how first-year students have changed over the past four decades.
New Jersey Institute of Technology Newark College of Engineering
 New Jersey Institute of Technology Newark College of Engineering AND IN ELECTRICAL AND COMPUTER ENGINEERING Program Review Last Update: Nov. 23, 2005 MISSION STATEMENTS DOCTOR OF PHILOSOPHY IN ELECTRICAL
Preliminary Report Initiative for Investigation of Race Matters and Underrepresented Minority Faculty at MIT Revised Version Submitted July 12, 2007
 Massachusetts Institute of Technology Preliminary Report Initiative for Investigation of Race Matters and Underrepresented Minority Faculty at MIT Revised Version Submitted July 12, 2007 Race Initiative
Networks and the Diffusion of Cutting-Edge Teaching and Learning Knowledge in Sociology
 RESEARCH BRIEF Networks and the Diffusion of Cutting-Edge Teaching and Learning Knowledge in Sociology Roberta Spalter-Roth, Olga V. Mayorova, Jean H. Shin, and Janene Scelza INTRODUCTION How are transformational
IS FINANCIAL LITERACY IMPROVED BY PARTICIPATING IN A STOCK MARKET GAME?
 21 JOURNAL FOR ECONOMIC EDUCATORS, 10(1), SUMMER 2010 IS FINANCIAL LITERACY IMPROVED BY PARTICIPATING IN A STOCK MARKET GAME? Cynthia Harter and John F.R. Harter 1 Abstract This study investigates the
Basic Skills Initiative Project Proposal Date Submitted: March 14, Budget Control Number: (if project is continuing)
") Basic Skills Initiative Project Proposal 2016-2017 Date Submitted: March 14, 2016 Check One: New Proposal: Continuing Project: X Budget Control Number: (if project is continuing) Control # 87-413 - EOPS
Basic Skills Initiative Project Proposal 2016-2017 Date Submitted: March 14, 2016 Check One: New Proposal: Continuing Project: X Budget Control Number: (if project is continuing) Control # 87-413 - EOPS
An Empirical Analysis of the Effects of Mexican American Studies Participation on Student Achievement within Tucson Unified School District
 An Empirical Analysis of the Effects of Mexican American Studies Participation on Student Achievement within Tucson Unified School District Report Submitted June 20, 2012, to Willis D. Hawley, Ph.D., Special
Executive Summary. Hialeah Gardens High School
 Miami-Dade County Public Schools Dr. Louis Algaze, Principal 11700 Hialeah Gardens Blvd Hialeah Gardens, FL 33018 Document Generated On March 19, 2014 TABLE OF CONTENTS Introduction 1 Description of the
Women, Minorities, and Persons with Disabilities in Science and Engineering
 2017 Women, Minorities, and Persons with Disabilities in Science and Engineering Emilda B. Rivers, Deputy Director National Center for Science and Engineering Statistics National Science Foundation www.nsf.gov/statistics
Application and Admission Process
 Application and Admission Process The Graziadio School seeks students with excellent academic and career potential, highly motivated self-starters who thrive on challenge. We carefully select each new
DUAL ENROLLMENT ADMISSIONS APPLICATION. You can get anywhere from here.
 DUAL ENROLLMENT ADMISSIONS APPLICATION SM You can get anywhere from here. Please print or type: DUAL ENROLLMENT APPLICATION Last Name First Name Maiden/Middle Social Security # Local Address (include apt.
RAISING ACHIEVEMENT BY RAISING STANDARDS. Presenter: Erin Jones Assistant Superintendent for Student Achievement, OSPI
 RAISING ACHIEVEMENT BY RAISING STANDARDS Presenter: Erin Jones Assistant Superintendent for Student Achievement, OSPI Agenda Introductions Definitions History of the work Strategies Next steps Debrief
Effective Pre-school and Primary Education 3-11 Project (EPPE 3-11)
") Effective Pre-school and Primary Education 3-11 Project (EPPE 3-11) A longitudinal study funded by the DfES (2003 2008) Exploring pupils views of primary school in Year 5 Address for correspondence: EPPSE
Effective Pre-school and Primary Education 3-11 Project (EPPE 3-11) A longitudinal study funded by the DfES (2003 2008) Exploring pupils views of primary school in Year 5 Address for correspondence: EPPSE