RESEARCH EXPENDITURES
|
|
|
- Marilyn Green
- 5 years ago
- Views:
Transcription
1 RESEARCH EXPENDITURES September 1, 2001 August 31, 2002 Texas Public Universities and Health-Related Institutions Texas Higher Education Coordinating Board Division of Finance, Campus Planning, and Research P.O. Box Austin, TX April 2003
2 Texas Higher Education Coordinating Board Pamela P. Willeford (Chair) Martin Basaldua, M.D. (Vice Chair) Raul B. Fernandez (Secretary) Neal W. Adams Ricardo G. Cigarroa, M.D. Marc Cisneros Kevin P. Eltife Jerry Farrington Cathy Obriotti Green Gerry Griffin Carey Hobbs Adair Margo Lorraine Perryman Curtis E. Ransom Hector de J. Ruiz, Ph.D. Robert W. Shepard Windy Sitton Terdema L. Ussery, II Austin Houston San Antonio Bedford Laredo Corpus Christi Tyler Dallas San Antonio Hunt Waco El Paso Odessa Dallas Austin Harlingen Lubbock Dallas Coordinating Board Mission The mission of the Texas Higher Education Coordinating Board is to provide the Legislature advice and comprehensive planning capability for higher education, to coordinate the effective delivery of higher education, to administer programs efficiently, and to improve higher education for the people of Texas. Coordinating Board Philosophy The Texas Higher Education Coordinating Board will promote access to quality higher education across the state with the conviction that access without quality is mediocrity and that quality without access is unacceptable. The Board will be open, ethical, responsive, and committed to public service. The Board will approach its work with a sense of purpose and responsibility to the people of Texas and is committed to the best use of public monies. Created by the Texas Legislature in 1965, the Texas Higher Education Coordinating Board works with institutions of higher education, other state agencies, the Legislature and the Governor to ensure that Texans seeking higher education have access to high quality programs. The Board s overall responsibilities include assessing the state of higher education in Texas, making recommendations to the Governor, Legislature, and institutions for its enhancement, and establishing policies for the efficient and effective use of the state s higher education resources.
3 EXECUTIVE SUMMARY The first six sections of this report are based on data provided by each Texas public university and health-related institution for Fiscal Year 2002 September 1, 2001 through August 31, Highlights include: Total reported research expenditures increased 15.5 percent over Fiscal Year Research expenditures in Fiscal Year 2002 were $2,044,251,959. In Fiscal Year 2001, the total was $1,769,660,434. Total research expenditures increased by 95.8 percent since Fiscal Year Scientific discipline categories benefitting from the largest research expenditures include medical sciences $682,607,750; biological and other life sciences $454,394,880; engineering $304,985,071; and physical sciences $133,946,444. Funding for medical sciences increased by 16.5 percent in Fiscal Year 2002 compared to the previous year. The federal government provided 55.9 percent of the research funds expended, an increase from 55.4 percent in Fiscal Year The seventh section of this report is based on data provided by the National Science Foundation for Fiscal Year 2000, the most recent year for which this data is available. Highlights include: ο ο ο ο Texas institutions of higher education ranked sixth in federal obligations for science and engineering after California, New York, Maryland, Pennsylvania, and Massachusetts. The National Institutes of Health provides 62 percent of the federal research support for science and engineering to Texas higher education institutions. Texas institutions ranked third in total research expenditures for Fiscal Year Life sciences accounted for 65 percent of the research expenditures, followed by engineering (15 percent) and environmental sciences (7 percent). Eight institutions Baylor College of Medicine, The University of Texas at Austin, The University of Texas Southwestern Medical Center, The University of Texas Health Science Center at Houston, The University of Texas M. D. Anderson Cancer Center, Texas A&M University (including Texas A&M Service agencies), The University of Texas Health Science Center at San Antonio, and The University of Texas Medical Branch at Galveston accounted for 81.3 percent of the federal obligations for science and engineering to Texas higher education institutions in Fiscal Year i
4 ii
5 TABLE OF CONTENTS Executive Summary... i Overview... 1 Major Findings... 3 Statewide Summary Data... 5 Institutional Data Universities Institutional Data Health-Related Institutions Historical Data National Comparisons Appendix A Research Expenses Surveys... A-1 Appendix B Institutional Contacts... B-1 iii
6 iv
7 LIST OF TABLES AND FIGURES Tables: 1 Research and Development Expenditures Rankings, FY Federal/State Research and Development Expenditures Ratio Rankings, FY Sources of Funds for Research and Other Research-Related Sponsored Programs, FY Expenditures for Conduct of R&D by Field and Source of Funding, FY 2002, Texas Public Institutions of Higher Education Expenditures for Conduct of R&D in Areas of Special Interest, FY 2002, Texas Public Universities Expenditures for Conduct of R&D in Areas of Special Interest, FY 2002, Texas Public Health-Related Institutions Total Expenditures for Research and Other Research-Related Sponsored Programs by Source of Funds, FY Federal R&D Expenditures/FTE Faculty Ratio, FY 2002, Texas Public Universities Expenditures for Conduct of R&D by Field, FY 2002, Texas Public Universities Expenditures for Conduct of R&D by Area of Special Interest, FY 2002, Texas Public Universities Total Expenditures for Sponsored Programs by Source of Funds, FY Expenditures for Conduct of R&D by Field, FY 2002, Texas Public Health-Related Institutions Expenditures for Research and Development by Area of Special Interest, FY 2002 Texas Public Health-Related Institutions Expenditures for Research and Development, Texas Public Universities Federal Expenditures for Research and Development, Texas Public Universities Expenditures for Research and Development, Texas Public Health-Related Institutions v
8 17 Federal Expenditures for Research and Development, Texas Public Health-Related Institutions Federal Expenditures for Research and Development by Field, Texas Public Universities and Health-Related Institutions Top Five States in Federal R&D Expenditures Selected Science and Engineering Fields, FY State Rank in Federal Obligations and Federally Financed R&D, FY Federal Obligations and Federally Financed R&D by Texas Institutions, FY Texas Universities and Colleges with Federal Science and Engineering R&D Obligations of more than $10 Million by Support Agency, FY Figures: 1 Expenditures for All Research-Related Sponsored Programs, FY Sources of Expenditures for All Research-Related Sponsored Programs, FY Expenditures for Research and Development at Texas Public Universities, FY Sources of Expenditures for Research and Development at Texas Public Health-Related Institutions, FY Expenditures for Conduct of R&D by Discipline Expenditures for Research and Development at Texas Public Universities, FY Expenditures for Research and Development at Texas Public Health-Related Institutions, FY Expenditures for Research and Development, FY Federal Obligations for R&D in Science and Engineering, Universities and Colleges Selected States, Federally Financed R&D Expenditures, Universities and Colleges Selected States, Federal Obligations for R&D in Science and Engineering, Texas Universities and Colleges, Top Five Support Agencies Federally Financed Research Expenditures by Discipline, Texas Public and Private Institutions, FY vi
9 OVERVIEW The Texas Higher Education Coordinating Board s annual research expenditures report summarizes data submitted to the Board as required by Section (h) of the Texas Education Code, which states: Once a year, on dates prescribed by the board, each institution of higher education shall report to the board all research conducted at that institution during the last preceding year. The Coordinating Board s summary report is based on expenditures rather than awards because expenditures more accurately reflect the level of current research activity. Awards tend to fluctuate from year to year, making them a much less stable indicator for year-to-year comparisons. The Coordinating Board is only able to verify the accuracy of the research expenditures data by asking institutions to ensure that the data reported are consistent with data in their Annual Financial Reports. According to recent changes adopted by the Government Accounting Standards Board, expenses rather than expenditures will be reported in institutional annual financial reports prepared for Fiscal Year 2002 and beyond. The major difference for research reporting purposes is that capital outlays for research equipment will be depreciated over the life of the equipment and will not be separately identified as research items in current annual financial reports. To provide research expenditure data comparable to that gathered in the past, the institutions were allowed to add capital outlays for research equipment to their research expenses for this report. In addition, the current annual financial reports no longer have a section Exhibit C - Current Funds Expenditures, Expenditure Category Research that was used in previous years as the basis for reconciling data from those reports with data gathered for this report. To facilitate reconciliation, the institutions were asked to submit annual financial reports using functional classifications that show expenses broken out by instruction, research, public service, etc. A set of definitions is provided in the research expenditures survey to help ensure consistency from institution to institution. Even with these safeguards, institutions have some latitude in determining how they report data. Data elements and definitions used in this year s report are comparable to similar research expenditure data elements used by the National Science Foundation (NSF). The two sets of elements differ to some degree because the NSF focuses on science and technology alone, while the Coordinating Board s report includes research in all disciplines. Collection of research expenditure data is a challenging task for institutions. Administrators face many difficulties as they sort out research expenditures at their institutions. For that reason, information they have submitted and the Coordinating Board s research expenditures report should be considered indicative rather than definitive. 1
10 Appendix A includes a copy of the survey form completed by each institution. Appendix B includes a list of the institutional contacts who collected the data on their campuses. This report also contains a section, beginning on page 32, that compares research funding in Texas with that of other states. This data is drawn from three National Science Foundation reports on research obligations and research expenditures. 2
11 ---- MAJOR FINDINGS Total research expenditures at Texas public institutions of higher education increased by 15.5 percent during Fiscal Year 2002, continuing a long-term growth trend. Most of the growth occurred at health-related institutions. Total research expenditures increased by $152,013,385 (18.5 percent) for health-related institutions and $122,578,140 (12.9 percent) for universities compared to Fiscal Year As in most states, Texas higher education research expenditures were concentrated in a relatively small number of institutions. Collectively, the top five institutions in research spending accounted for 68 percent of total research expenditures. The top 10 institutions accounted for 87 percent of the total. Six of the state's health-related institutions ranked among the top 10 Texas public institutions in research expenditures. In addition, the top seven institutions in Table 1 also appear in the National Science Foundation s list of top 100 institutions in federal research and development expenditures for Table 1 Research and Development Expenditures Rankings, FY 2002 Institution Texas A&M University (including Texas A&M Services) The University of Texas at Austin The University of Texas Southwestern Medical Center at Dallas The University of Texas M.D. Anderson Cancer Center The University of Texas Health Science Center at Houston The University of Texas Health Science Center at San Antonio The University of Texas Medical Branch at Galveston University of Houston Texas Tech University Texas A&M University System Health Science Center* *TAMU College of Medicine combined with TAMUS Baylor College of Dentistry to form Texas A&M HSC in FY2000. The federal government funded 55.9 percent of all research expenditures by Texas public institutions of higher education, making it the source of most research funds as it is in other states. At academic institutions 1 nationwide, the National Science Foundation/SRS, Academic 1 For this purpose, academic institutions are generally defined as institutions of higher education that grant bachelors or doctorates in science or engineering and spend at least $150,000 for separately budgeted research and development. 3
12 Research and Development Expenditures: Fiscal Year 2000, Table B-29 shows that 58.2 percent 2 of the academic research was funded by the federal government. State government in Texas provided 20.2 percent of the funds for all research expenditures in the state s public higher education institutions. Institutional and private funding accounted for the remaining 24 percent. The ratio of federal funds to state-appropriated funds for each of the 10 Texas institutions reporting the greatest research expenditures is provided in Table 2. Table 2 Federal/State Research and Development Expenditures Ratio Rankings, FY 2002 Institution R&D Rank Fed/State Ratio Ratio Rank The University of Texas Health Science Center at San Antonio The University of Texas Southwestern Medical Center at Dallas The University of Texas Health Science Center at Houston The University of Texas Medical Branch at Galveston The University of Texas at Austin Texas A&M University System Health Science Center The University of Texas M.D. Anderson Cancer Center Texas A&M University (including Texas A&M Services) University of Houston Texas Tech University Medical sciences, accounting for 33 percent of the total, led all other disciplines in expenditures. The top five disciplines medical sciences, engineering, biological and other life sciences, physical sciences, and environmental sciences collectively accounted for 83.4 percent of all reported research expenditures. California ($2.25 billion), New York ($1.27 billion), Maryland ($1 billion), Pennsylvania ($0.99 billion), Massachusetts ($0.94 billion), and Texas ($0.83 billion) were the top six states in federal obligations for research and developmment in science and engineering for Fiscal Year The National Institutes of Health, the Department of Defense, and the National Science Foundation provided 68.1 percent, 11.9 percent, and 7.2 percent, respectively, of the Fiscal Year 2000 federal obligations for research and development in science and engineering to Texas higher education institutions. 2 This percentage was reported incorrectly in the FY 1999 and FY 2000 issues of Research Expenditures. The correct values are 58.6 percent for FY 1999 and 58.4 percent for FY
13 STATEWIDE SUMMARY DATA Expenditures related to research are divided into two categories: (1) expenditures for the conduct of research and development and (2) other sponsored activities. Other sponsored activities refers to support received from external sources to fund activities that cannot be considered strictly research. Examples include grants for equipment or facilities, contracts to perform studies, and training. Definitions for both categories are included in the survey form that is Appendix A. Tables 3 and 4 and Figures 1-4 provide information on expenses and sources of funds for research and development and for other sponsored activities related to research at public universities and health-related institutions. Some institutions do not report funds used for other sponsored activities related to research. Table 3 Sources of Funds for Research and Other Research-Related Sponsored Programs, FY 2002 State Federal Contracts Institution Appropriated and Grants Public Universities Research and Development $564,550,414 $180,627,629 $94,943,553 $88,918,642 Other $10,055,582 $6,412,499 $1,761,699 $10,671,988 Total $574,605,996 $187,040,128 $96,705,252 $99,590,630 Public Health-Related Institutions Research and Development $577,718,247 $119,859,163 $16,843,282 $38,501,268 Other $887,119 $5,726,723 $0 $6,512,966 Total $578,605,366 $125,585,886 $16,843,282 $45,014,234 All Public Institutions Research and Development $1,142,268,661 $300,486,792 $111,786,835 $127,419,910 Other $10,942,701 $12,139,222 $1,761,699 $17,184,954 Totals $1,153,211,362 $312,626,014 $113,548,534 $144,604,864 (table continued on next page) 5
14 Table 3 - continued Sources of Funds for Research and Other Research-Related Sponsored Programs, FY 2002 Private Profit Non-Profit Total Public Universities Research and Development $64,765,233 $76,995,985 $1,070,801,456 Other $275,062 $510,957 $29,687,787 Total $65,040,295 $77,506,942 $1,100,489,243 Public Health-Related Institutions Research and Development $78,841,164 $141,687,379 $973,450,503 Other $5,336 $96,001 $13,228,145 Total $78,846,500 $141,783,380 $986,678,648 All Public Institutions Research and Development $143,606,397 $218,683,364 $2,044,251,959 Other $280,398 $606,958 $42,915,932 Totals $143,886,795 $219,290,322 $2,087,167,891 6
15 Figure 1 Sources of Expenditures for All Research-Related Sponsored Programs, FY 2002 Federal 55.3% Expenditures for All Research-Related Sponsored Programs, FY 2002 Research & Development 97.9% State 20.4% Institution 6.9% Pr ivate 17.4% Other Sponsored Progams 2.1% Figure 2 Sources of Expenditures for All Research-Related Sponsored Programs, FY 2002 Federal 55.3% State 20.4% Institution 6.9% Private 17.4% 7
16 Figure 3 Expenditures for Research and Development at Texas Public Universities, FY 2002 Federal 52.7% State 25.7% Institution 8.3% Private 13.2% Figure 4 Sources of Expenditures for Research and Development at Texas Public Health-Related Institutions, FY 2002 Federal 59.3% State 14.0% Institution 4.0% Private 22.7% 8
17 Table 4 indicates expenditures in the 16 different fields defined in Appendix A. The Coordinating Board s instructions directed institutions to assign project expenditures to only one field to avoid duplication. For the most part, this table reflects expenditures in particular academic disciplines. Some inconsistency may result, however, as institutions strive to categorize a particular research project into only one field. For example, a college of agriculture could perform basic research in biological sciences and report expenses in that field rather than in agricultural sciences. Proportions of expenses by discipline are shown in Figure 5. Medical and biological sciences account for slightly more than one-half of all research expenditures. Table 4 Expenditures for Conduct of R&D by Field and Source of Funding, FY 2002 Texas Public Institutions of Higher Education State Federal Contracts Institution Appropriated and Grants Agricultural Sciences $25,352,992 $26,258,553 $5,099,250 $10,503,023 Biological and Other Life Sciences $260,564,270 $77,442,282 $9,260,584 $29,934,797 Computer Science $31,440,414 $7,738,310 $2,549,884 $2,287,223 Engineering $155,461,426 $40,541,733 $46,773,762 $18,376,386 Environmental Sciences $91,715,782 $15,720,799 $6,045,456 $4,944,154 Mathematical Sciences $26,934,849 $7,325,190 $1,815,660 $1,076,035 Medical Sciences $401,490,302 $73,383,602 $15,920,599 $31,266,530 Physical Sciences $79,873,134 $23,858,352 $1,905,088 $6,031,638 Psychology $15,332,253 $979,356 $1,730,490 $477,093 Social Sciences $13,416,477 $9,943,710 $9,717,024 $3,799,898 Other Sciences $6,835,106 $3,409,185 $2,108,240 $422,657 Arts and Humanities $948,930 $814,493 $335,001 $3,247,321 Business Administration $2,502,075 $2,537,142 $727,711 $768,365 Education $24,348,321 $1,108,833 $3,187,055 $2,555,417 Law and Public Administration $1,753,585 $512,384 $1,735,915 $164,001 Other Non-Science Activities $4,309,209 $8,902,404 $2,875,116 $11,565,372 Totals $1,142,279,125 $300,476,328 $111,786,835 $127,419,910 (table continued on next page) 9
18 Table 4 - continued Expenditures for Conduct of R&D by Field and Source of Funding, FY 2002 Texas Public Institutions of Higher Education Private Profit Non-Profit Total Agricultural Sciences $4,611,228 $9,179,686 $81,004,732 Biological and Other Life Sciences $17,900,438 $59,292,509 $454,394,880 Computer Science $1,318,386 $937,633 $46,271,850 Engineering $33,363,727 $10,468,037 $304,985,071 Environmental Sciences $6,753,493 $3,740,123 $128,919,807 Mathematical Sciences $1,565,232 $1,310,410 $40,027,376 Medical Sciences $66,633,809 $93,912,908 $682,607,750 Physical Sciences $5,320,791 $16,957,441 $133,946,444 Psychology $567,206 $551,992 $19,638,390 Social Sciences $1,693,080 $5,910,142 $44,480,331 Other Sciences $241,762 $1,551,138 $14,568,088 Arts and Humanities $456,641 $1,149,928 $6,952,314 Business Administration $1,009,174 $3,040,137 $10,584,604 Education $279,700 $7,673,656 $39,152,982 Law and Public Administration $111,308 $1,245,266 $5,522,459 Other Non-Science Activities $1,780,422 $1,762,358 $31,194,881 Totals $143,606,397 $218,683,364 $2,044,251,959 Figure 5 Expenditures for Conduct of R&D by Discipline Biological and Other Life Sciences 22.2% Engineering 14.9% Physical Sciences 6.6% Environmental Sciences 6.3% Agricultural Sciences 4.0% Medical Sciences 33.4% All Other 12.6% 10
19 Table 5 shows research in nine different areas of special interest at public universities, and Table 6 shows research in six different areas of special interest at public health-related institutions. Double counting was allowed because many projects are relevant to two or more areas of research. Table 5 Expenditures for Conduct of R&D in Areas of Special Interest, FY 2002 Texas Public Universities State Federal Contracts Institution Appropriated and Grants Aerospace Technology $25,990,354 $1,809,691 $92,731 $805,500 Biotechnology $37,838,662 $22,116,541 $1,488,717 $15,132,431 Energy $31,917,784 $6,676,797 $1,109,484 $928,153 Environmental Science & Engineering $53,074,216 $16,979,174 $4,169,376 $4,892,458 Food, Fiber, Agricultural Products $17,218,465 $29,548,321 $2,731,366 $12,445,392 Manufacturing Technology $3,833,889 $1,804,866 $1,080,395 $734,349 Materials Science $24,564,416 $3,238,835 $4,281,769 $833,090 Microelectronics & Computer Technology $37,969,063 $11,250,428 $1,178,347 $2,654,450 Water Resources $4,853,821 $2,724,306 $1,519,902 $2,103,818 Totals $237,260,670 $96,148,959 $17,652,087 $40,529,641 Table 5 - continued Expenditures for Conduct of R&D in Areas of Special Interest, FY 2002 Texas Public Universities Private Profit Non-Profit Total Aerospace Technology $190,801 $782,440 $29,671,517 Biotechnology $4,869,044 $9,433,088 $90,878,483 Energy $2,150,788 $5,083,050 $47,866,056 Environmental Science & Engineering $1,742,742 $7,488,432 $88,346,398 Food, Fiber, Agricultural Products $4,252,933 $9,808,701 $76,005,178 Manufacturing Technology $855,343 $830,996 $9,139,838 Materials Science $4,133,541 $3,465,751 $40,517,402 Microelectronics & Computer Technology $3,372,564 $3,435,151 $59,860,003 Water Resources $721,400 $2,379,543 $14,302,790 Totals $22,289,156 $42,707,152 $456,587,665 11
20 Table 6 Expenditures for Conduct of R&D in Areas of Special Interest, FY 2002 Texas Public Health-Related Institutions State Federal Contracts Institution Appropriated and Grants Aging $27,325,006 $1,497,485 $495,437 $218,345 Cancer Research $156,833,474 $75,211,486 $3,377,692 $14,257,378 Cardiovascular Research $40,111,044 $5,887,940 $913,950 $1,822,548 Child Health and Human Development $21,086,969 $355,475 $1,836,160 $1,376,225 Mental Health $18,192,303 $1,304,617 $417,343 $380,108 Substance Abuse $26,458,283 $512,187 $668,777 $207,469 Totals $290,007,079 $84,769,190 $7,709,359 $18,262,073 Table 6 - continued Expenditures for Conduct of R&D in Areas of Special Interest, FY 2002 Texas Public Health-Related Institutions Private Profit Non-Profit Total Aging $834,647 $3,898,526 $34,269,446 Cancer Research $35,633,919 $35,878,669 $321,192,618 Cardiovascular Research $2,961,460 $9,438,320 $61,135,262 Child Health and Human Development $847,946 $4,109,593 $29,612,368 Mental Health $2,353,162 $2,578,118 $25,225,651 Substance Abuse $156,927 $460,852 $28,464,495 Totals $42,788,061 $56,364,078 $499,899,840 12
21 INSTITUTIONAL DATA UNIVERSITIES This section of the report contains detailed information on research expenditures reported by individual institutions. Statements related to data quality and applicability found on page 1 of this report also apply to the data shown in this section of the report. Figure 6 Expenditures for Research and Development at Texas Public Universities, FY 2002 (Millions of Dollars) All Others UT-Pan-American Texas Women's Texas A&M at Galveston Lamar Texas Southern Stephen F. Austin State West Texas A&M Tarleton State Texas A&M-Kingsville Univ. of Houston-Clear Lake Prairie View A&M Texas A&M-Corpus Christi Southwest Texas State UT at San Antonio University of North Texas UT at Arlington UT at El Paso UT at Dallas Texas Tech Univ. of Houston UT at Austin Texas A&M and Services
22 Table 7 Total Expenditures for Research and Other Research-Related Sponsored Programs by Source of Funds, FY 2002 State Institution Federal Appropriated Contracts and Grants R&D Other R&D Other R&D Other Midwestern State $0 $0 $0 $0 $0 $0 Stephen F. Austin State $1,054,239 $0 $0 $0 $91,002 $0 Texas A&M University System* Prairie View A&M $7,915,204 $313,473 $1,990,481 $254,617 $200,965 $0 Tarleton State $5,431,723 $0 $2,133,932 $0 $114,378 $0 Texas A&M and Services $166,285,925 $33,793 $76,341,412 $118,428 $41,702,982 $2,908 Texas A&M-Commerce $315,173 $0 $104,398 $0 $0 $0 Texas A&M-Corpus Christi $4,473,974 $0 $1,313,230 $0 $2,711,375 $0 Texas A&M at Galveston $2,362,832 $0 $604,959 $262,341 $450,746 $83,131 Texas A&M International $572,462 $0 $1,014 $0 $16,475 $0 Texas A&M-Kingsville $1,950,923 $0 $3,256,322 $0 $1,068,783 $0 Texas A&M-Texarkana $182,262 $0 $0 $2,336 $0 $0 West Texas A&M $3,531,219 $0 $2,072,234 $879,668 $38,585 $0 Texas Southern $4,147,663 $0 $0 $0 $672,878 $0 Texas State University System Angelo State $254,963 $0 $392,332 $0 $71,526 $0 Lamar $2,279,805 $104,657 $1,128,576 $224,982 $338,332 $24,675 Sam Houston State $1,491,475 $9,603,659 $0 $0 $330,814 $1,650,985 Southwest Texas State $4,769,709 $0 $1,491,428 $0 $2,386,188 $0 Sul Ross State $76,368 $0 $555,771 $0 $94,914 $0 Sul Ross - Rio Grande $0 $0 $10,464 $0 $0 $0 Texas Tech $20,511,493 $0 $16,178,777 $0 $5,171,320 $0 Texas Woman's $1,321,373 $0 $977,936 $830,873 $289,499 $0 University of Texas System UT at Arlington $7,923,657 $0 $8,543,962 $0 $960,972 $0 UT at Austin $235,436,101 $0 $27,400,063 $0 $25,429,462 $0 UT at Brownsville $896,646 $0 $0 $0 $2,082 $0 UT at Dallas $11,815,490 $0 $8,278,639 $0 $138,086 $0 UT at El Paso $19,796,441 $0 $3,451,647 $0 $803,955 $0 UT-Pan American $1,394,780 $0 $882,781 $0 $30,664 $0 UT of the Permian Basin $138,194 $0 $622,875 $0 $60,088 $0 UT at San Antonio $7,641,990 $0 $1,954,697 $0 $1,560,850 $0 UT at Tyler $67,617 $0 $220,268 $0 $107 $0 University of Houston System Univ. of Houston $33,239,410 $0 $19,723,967 $0 $8,815,293 $0 Univ. of Houston-Clear Lake $7,659,934 $0 $603,335 $0 $93,828 $0 Univ. of Houston-Downtown $783,394 $0 $392,129 $0 $0 $0 Univ. of Houston-Victoria $0 $0 $0 $0 $0 $0 University of North Texas $8,827,975 $0 $0 $3,839,254 $1,297,404 $0 Totals $564,550,414 $10,055,582 $180,627,629 $6,412,499 $94,943,553 $1,761,699 Shading indicates the five highest in each category. * A&M agency and research foundation expenditures reported by individual affiliated university. (table continued on next page) 14
23 Table 7 - continued Total Expenditures for Research and Other Research-Related Sponsored Programs by Source of Funds, FY 2002 Institution Institution Private, Profit Private, Non-Profit R&D Other R&D Other R&D Other Midwestern State $2,347 $0 $0 $0 $72,279 $0 Stephen F. Austin State $1,920,220 $0 $110,870 $0 $2,406,720 $0 Texas A&M University System* Prairie View A&M $86,497 $132,118 $38,626 $0 $98,312 $11,197 Tarleton State $59,148 $0 $119,239 $0 $51,579 $0 Texas A&M and Services $45,409,972 $1,754,356 $21,704,999 $275,062 $21,383,564 $49,465 Texas A&M-Commerce $0 $0 $157,067 $0 $52,858 $0 Texas A&M-Corpus Christi $297,032 $0 $95,263 $0 $1,474,627 $0 Texas A&M at Galveston $170,095 $23,905 $54,770 $0 $367,216 $1,623 Texas A&M International $39,689 $0 $0 $0 $47,706 $0 Texas A&M-Kingsville $0 $0 $522,869 $0 $1,792,931 $0 Texas A&M-Texarkana $0 $0 $0 $0 $29,990 $0 West Texas A&M $62,810 $0 $2,285 $0 $329,580 $0 Texas Southern $0 $0 $22,801 $0 $86,775 $0 Texas State University System Angelo State $0 $0 $51,681 $0 $29,542 $0 Lamar $199,413 $114,255 $165,632 $0 $126,157 $81,051 Sam Houston State $0 $0 $9 $0 $108,716 $367,621 Southwest Texas State $426,849 $0 $78,459 $0 $1,248,194 $0 Sul Ross State $0 $0 $0 $0 $114,373 $0 Sul Ross - Rio Grande $0 $0 $0 $0 $0 $0 Texas Tech $1,462,594 $88,169 $4,046,465 $0 $4,330,800 $0 Texas Woman's $0 $0 $99,602 $0 $271,605 $0 University of Texas System UT at Arlington $117,013 $0 $2,266,093 $0 $1,261,267 $0 UT at Austin $29,204,451 $0 $27,760,251 $0 $21,125,031 $0 UT at Brownsville $118,875 $0 $0 $0 $269,035 $0 UT at Dallas $1,312,341 $5,986,596 $2,033,117 $0 $3,866,384 $0 UT at El Paso $1,237,006 $423,963 $222,252 $0 $1,817,471 $0 UT-Pan American $49,936 $0 $9,143 $0 $238,454 $0 UT of the Permian Basin $124,984 $0 $0 $0 $34,764 $0 UT at San Antonio $285,988 $0 $54,059 $0 $904,433 $0 UT at Tyler $12,533 $0 $31,056 $0 $44,240 $0 University of Houston System Univ. of Houston $5,877,555 $0 $4,302,102 $0 $10,906,980 $0 Univ. of Houston-Clear Lake $370,348 $0 $39,044 $0 $95,719 $0 Univ. of Houston-Downtown $70,946 $0 $0 $0 $24,025 $0 Univ. of Houston-Victoria $0 $0 $0 $0 $0 $0 University of North Texas $0 $2,148,626 $777,479 $0 $1,984,658 $0 Totals $88,918,642 $10,671,988 $64,765,233 $275,062 $76,995,985 $510,957 Shading indicates the five highest in each category. * A&M agency and research foundation expenditures reported by individual affiliated university. (table continued on next page) 15
24 Table 7 - continued Total Expenditures for Research and Other Research-Related Sponsored Programs by Source of Funds, FY 2002 Institution Total R&D Other R&D and Other Midwestern State $74,626 $0 $74,626 Stephen F. Austin State $5,583,051 $0 $5,583,051 Texas A&M University System* Prairie View A&M $10,330,085 $711,405 $11,041,490 Tarleton State $7,909,999 $0 $7,909,999 Texas A&M and Services $372,828,854 $2,234,012 $375,062,866 Texas A&M-Commerce $629,496 $0 $629,496 Texas A&M-Corpus Christi $10,365,501 $0 $10,365,501 Texas A&M at Galveston $4,010,618 $371,000 $4,381,618 Texas A&M International $677,346 $0 $677,346 Texas A&M-Kingsville $8,591,828 $0 $8,591,828 Texas A&M-Texarkana $212,252 $2,336 $214,588 West Texas A&M $6,036,713 $879,668 $6,916,381 Texas Southern $4,930,117 $0 $4,930,117 Texas State University System Angelo State $800,044 $0 $800,044 Lamar $4,237,915 $549,620 $4,787,535 Sam Houston State $1,931,014 $11,622,265 $13,553,279 Southwest Texas State $10,400,827 $0 $10,400,827 Sul Ross State $841,426 $0 $841,426 Sul Ross - Rio Grande $10,464 $0 $10,464 Texas Tech $51,701,449 $88,169 $51,789,618 Texas Woman's $2,960,015 $830,873 $3,790,888 University of Texas System UT at Arlington $21,072,964 $0 $21,072,964 UT at Austin $366,355,359 $0 $366,355,359 UT at Brownsville $1,286,638 $0 $1,286,638 UT at Dallas $27,444,057 $5,986,596 $33,430,653 UT at El Paso $27,328,772 $423,963 $27,752,735 UT-Pan American $2,605,758 $0 $2,605,758 UT of the Permian Basin $980,905 $0 $980,905 UT at San Antonio $12,402,017 $0 $12,402,017 UT at Tyler $375,821 $0 $375,821 University of Houston System Univ. of Houston $82,865,307 $0 $82,865,307 Univ. of Houston-Clear Lake $8,862,208 $0 $8,862,208 Univ. of Houston-Downtown $1,270,494 $0 $1,270,494 Univ. of Houston-Victoria $0 $0 $0 University of North Texas $12,887,516 $5,987,880 $18,875,396 Totals $1,070,801,456 $29,687,787 $1,100,489,243 Shading indicates the five highest in each category. * A&M agency and research foundation expenditures reported by individual affiliated university. 16
25 Table 8 Federal R&D Expenditures/FTE Faculty Ratio, FY 2002 Texas Public Universities Institution Federal R&D Federal R&D FTE Faculty* Expenditures Expenditures/FTE Midwestern State $ $0.00 Stephen F. Austin State $1,054, $3, Texas A&M University System** Prairie View A&M $7,915, $43, Tarleton State $5,431, $29, Texas A&M and Services*** $166,285,925 1, $106, Texas A&M-Commerce $315, $1, Texas A&M-Corpus Christi $4,473, $28, Texas A&M at Galveston $2,362, $71, Texas A&M International $572, $5, Texas A&M-Kingsville $1,950, $9, Texas A&M-Texarkana $182, $5, West Texas A&M $3,531, $23, Texas Southern $4,147, $20, Texas State University System Angelo State $254, $1, Lamar $2,279, $9, Sam Houston State $1,491, $4, Southwest Texas State $4,769, $9, Sul Ross State $76, $1, Sul Ross - Rio Grande $ $0.00 Texas Tech $20,511, $25, Texas Woman's $1,321, $4, University of Texas System UT at Arlington $7,923, $16, UT at Austin $235,436,101 1, $151, UT at Brownsville $896, $7, UT at Dallas $11,815, $48, UT at El Paso $19,796, $51, UT-Pan American $1,394, $4, UT of the Permian Basin $138, $1, UT at San Antonio $7,641, $22, UT at Tyler $67, $ University of Houston System Univ. of Houston $33,239, $41, Univ. of Houston-Clear Lake $7,659, $47, Univ. of Houston-Downtown $783, $4, Univ. of Houston-Victoria $ $0.00 University of North Texas $8,827, $13, Totals $564,550,414 11, $50, * FTE Faculty indicates number of full-time equivalents for tenured and tenure-track faculty for fall of ** A&M agency and research foundation expenditures reported by individual affiliated university. *** FTE faculty for Texas A&M and Services is based on its Legislative Appropriations Request for FY 2002 and includes 280 FTEs from Texas Agricultural Experiment Station and 23.3 from Texas Engineering Experiment Station. 17
26 Institution Table 9 Expenditures for Conduct of R&D by Field, FY 2002 Texas Public Universities Agricultural Sciences Biological and Other Life Sciences Computer Science Engineering Environmental Sciences Mathematical Sciences Midwestern State $0 $43,739 $0 $0 $0 $0 Stephen F. Austin State $3,475,303 $1,022,393 $0 $0 $17,578 $11,766 Texas A&M University System* Prairie View A&M $5,128,079 $53,209 $785,741 $2,978,216 $0 $68,060 Tarleton State $3,542,491 $186,481 $0 $27,622 $3,659,468 $64,799 Texas A&M and Services $48,591,995 $65,853,070 $7,664,703 $110,562,877 $60,704,381 $7,299,873 Texas A&M-Commerce $120,088 $19,895 $14,456 $0 $0 $2,998 Texas A&M-Corpus Christi $106,562 $370,821 $212,865 $1,916,060 $2,607,418 $1,034,492 Texas A&M at Galveston $0 $561,077 $0 $155,550 $3,063,741 $613 Texas A&M International $0 $50,404 $0 $241,497 $20,643 $0 Texas A&M-Kingsville $5,057,635 $862,144 $0 $1,564,534 $546,994 $0 Texas A&M-Texarkana $0 $0 $0 $0 $0 $0 West Texas A&M $1,577,619 $114,886 $5,021 $3,430,109 $89,515 $0 Texas Southern $0 $3,587,479 $22,493 $33,120 $0 $0 Texas State University System Angelo State $480,885 $76,074 $0 $0 $0 $0 Lamar $0 $6,633 $840 $1,480,142 $1,934,820 $6,493 Sam Houston State $71,916 $418,463 $0 $0 $882,161 $109,098 Southwest Texas State $24,626 $1,577,254 $131,775 $45,348 $143,653 $1,135,731 Sul Ross State $180,376 $119,620 $0 $0 $77,649 $0 Sul Ross - Rio Grande $0 $0 $0 $0 $0 $0 Texas Tech $12,440,290 $3,503,519 $1,044,380 $14,195,580 $9,971,468 $833,655 Texas Woman's $0 $1,340,640 $0 $0 $0 $8,732 University of Texas System UT at Arlington $0 $893,371 $1,640,740 $11,188,347 $168,124 $399,618 UT at Austin $117,521 $33,889,535 $20,275,127 $125,287,955 $34,084,001 $17,076,385 UT at Brownsville $2,082 $127,653 $0 $0 $34,835 $0 UT at Dallas $0 $2,794,424 $2,999,028 $4,757,023 $1,621,333 $473,979 UT at El Paso $0 $3,075,405 $803,579 $3,848,770 $6,066,725 $86,307 UT-Pan American $73,651 $71,805 $80,990 $716,854 $54,558 $23,420 UT of the Permian Basin $0 $58,658 $29,664 $5,671 $26,846 $0 UT at San Antonio $0 $6,284,214 $730,997 $494,639 $413,842 $69,492 UT at Tyler $0 $35,651 $0 $45,995 $0 $11,404 University of Houston System Univ. of Houston $0 $6,785,627 $8,568,959 $12,385,254 $1,567,809 $479,506 Univ. of Houston-Clear Lake $0 $232,051 $416,862 $7,137,107 $239,532 $96,419 Univ. of Houston-Downtown $13,613 $9,907 $529,155 $0 $0 $163,089 Univ. of Houston-Victoria $0 $0 $0 $0 $0 $0 University of North Texas $0 $1,271,377 $314,205 $47,928 $723,015 $224,894 Totals $81,004,732 $135,297,479 $46,271,580 $302,546,198 $128,720,109 $29,680,823 Shading indicates the five highest in each category. * A&M agency and research foundation expenditures reported by individual affiliated university. (table continued on next page) 18
27 Table 9 - continued Expenditures for Conduct of R&D by Field, FY 2002 Texas Public Universities Institution Medical Sciences Physical Sciences Psychology Social Sciences Other Sciences Midwestern State $6,395 $0 $3,429 $6,604 $0 Stephen F. Austin State $0 $77,044 $69,087 $48,579 $44,294 Texas A&M University System* Prairie View A&M $416,027 $657,804 $0 $2,584 $0 Tarleton State $1,332 $0 $0 $1,050 $64,292 Texas A&M and Services $20,222,286 $22,352,593 $2,876,477 $14,598,018 $1,990,334 Texas A&M-Commerce $0 $18,977 $280 $4,696 $80,394 Texas A&M-Corpus Christi $184,377 $92,744 $0 $142,452 $224,408 Texas A&M at Galveston $0 $210,071 $0 $0 $19,506 Texas A&M International $0 $0 $0 $0 $8,017 Texas A&M-Kingsville $0 $105,800 $0 $0 $156,023 Texas A&M-Texarkana $0 $0 $0 $0 $0 West Texas A&M $6,677 $31,283 $0 $0 $580 Texas Southern $0 $262,650 $0 $0 $283,097 Texas State University System Angelo State $5,404 $147,129 $8,625 $18,660 $0 Lamar $0 $148,518 $0 $0 $0 Sam Houston State $0 $302,691 $3,299 $10,761 $0 Southwest Texas State $323,139 $3,479,570 $997 $1,131,398 $114,714 Sul Ross State $0 $0 $0 $323,649 $0 Sul Ross - Rio Grande $0 $0 $0 $0 $0 Texas Tech $0 $6,285,315 $214,501 $2,611,991 $0 Texas Woman's $1,291,931 $34,320 $250 $54,171 $123,839 University of Texas System UT at Arlington $56,024 $3,991,995 $199,558 $376,442 $0 UT at Austin $16,702,273 $57,185,106 $5,350,294 $15,623,575 $2,745,918 UT at Brownsville $228,467 $413,636 $0 $329,443 $10,522 UT at Dallas $1,334,583 $7,336,969 $1,996,724 $2,972,507 $0 UT at El Paso $640,259 $1,238,190 $589,592 $239,631 $3,494,916 UT-Pan American $950,083 $175,515 $509 $188,999 $0 UT of the Permian Basin $5,117 $57,056 $0 $20,737 $49,120 UT at San Antonio $0 $529,534 $97,097 $2,377,786 $0 UT at Tyler $83,155 $0 $14,380 $8,470 $37,717 University of Houston System Univ. of Houston $5,372,552 $20,050,286 $7,461,990 $1,325,657 $3,706,057 Univ. of Houston-Clear Lake $0 $155,890 $67,083 $0 $12,726 Univ. of Houston-Downtown $0 $252,037 $0 $7,437 $78,787 Univ. of Houston-Victoria $0 $0 $0 $0 $0 University of North Texas $0 $3,339,478 $588,790 $2,055,034 $0 Totals $47,830,081 $128,932,201 $19,542,962 $44,480,331 $13,245,261 Shading indicates the five highest in each category. * A&M agency and research foundation expenditures reported by individual affiliated university. (table continued on next page) 19
28 Table 9 - continued Expenditures for Conduct of R&D by Field, FY 2002 Texas Public Universities Institution Arts and Humanities Business Administration Education Law and Public Administration Other Non- Sciences Total Midwestern State $12,112 $2,347 $0 $0 $0 $74,626 Stephen F. Austin State $145,596 $39,697 $246,645 $385,069 $0 $5,583,051 Texas A&M University System* Prairie View A&M $3,813 $2,502 $234,050 $0 $0 $10,330,085 Tarleton State $14,130 $0 $304,616 $0 $43,718 $7,909,999 Texas A&M and Services $937,074 $3,927,010 $4,013,885 $1,117,720 $116,558 $372,828,854 Texas A&M-Commerce $35,439 $2,230 $306,789 $0 $23,254 $629,496 Texas A&M-Corpus Christi $24,229 $20,027 $2,065,788 $0 $1,363,258 $10,365,501 Texas A&M at Galveston $0 $0 $0 $60 $0 $4,010,618 Texas A&M International $16,975 $33,306 $302,553 $0 $3,951 $677,346 Texas A&M-Kingsville $854 $3,678 $19,918 $0 $274,248 $8,591,828 Texas A&M-Texarkana $0 $0 $212,252 $0 $0 $212,252 West Texas A&M $32,016 $392,457 $345,829 $8,436 $2,285 $6,036,713 Texas Southern $0 $0 $0 $0 $741,278 $4,930,117 Texas State University System Angelo State $28,247 $0 $35,020 $0 $0 $800,044 Lamar $0 $0 $207,118 $0 $453,351 $4,237,915 Sam Houston State $0 $0 $0 $132,625 $0 $1,931,014 Southwest Texas State $220,919 $145,903 $1,523,046 $52,457 $350,297 $10,400,827 Sul Ross State $0 $72,315 $2,515 $0 $65,302 $841,426 Sul Ross - Rio Grande $10,464 $0 $0 $0 $0 $10,464 Texas Tech $20,013 $330,056 $230,174 $20,507 $0 $51,701,449 Texas Woman's $2,336 $609 $89,735 $0 $13,452 $2,960,015 University of Texas System UT at Arlington $64,296 $23,183 $59,977 $293,068 $1,718,221 $21,072,964 UT at Austin $3,071,561 $2,987,182 $13,125,648 $2,099,329 $16,733,949 $366,355,359 UT at Brownsville $0 $0 $134,012 $0 $5,988 $1,286,638 UT at Dallas $569,064 $401,615 $186,808 $0 $0 $27,444,057 UT at El Paso $6,173 $109,433 $4,377,029 $222,318 $2,530,445 $27,328,772 UT-Pan American $119,644 $19,175 $125,573 $4,982 $0 $2,605,758 UT of the Permian Basin $13,337 $495,690 $98,722 $0 $120,287 $980,905 UT at San Antonio $201,317 $566,954 $557,184 $78,961 $0 $12,402,017 UT at Tyler $41,011 $85,913 $0 $0 $12,125 $375,821 University of Houston System Univ. of Houston $1,140,060 $555,298 $6,861,092 $516,749 $6,088,411 $82,865,307 Univ. of Houston-Clear Lake $3,480 $131,464 $7,470 $0 $362,124 $8,862,208 Univ. of Houston-Downtown $0 $6,630 $15,067 $22,393 $172,379 $1,270,494 Univ. of Houston-Victoria $0 $0 $0 $0 $0 $0 University of North Texas $60,613 $229,930 $3,464,467 $567,785 $0 $12,887,516 Totals $6,794,773 $10,584,604 $39,152,982 $5,522,459 $31,194,881 $1,070,801,456 Shading indicates the five highest in each category. * A&M agency and research foundation expenditures reported by individual affiliated university. 20
29 Table 10 Expenditures for Conduct of R&D by Area of Special Interest, FY 2002 Texas Public Universities Institution Aerospace Technology Biotechnology Energy Environmental Sciences Food, Fiber, Agricultural Products Midwestern State $0 $0 $0 $0 $0 Stephen F. Austin State $0 $1,263,522 $0 $4,259,919 $4,181,635 Texas A&M University System* Prairie View A&M $263,053 $0 $57,251 $0 $172,398 Tarleton State $0 $0 $0 $2,803,920 $0 Texas A&M and Services $1,296,406 $52,206,609 $3,909,032 $7,677,604 $49,249,264 Texas A&M-Commerce $0 $0 $0 $0 $116,021 Texas A&M-Corpus Christi $0 $74,338 $0 $1,919,839 $65,711 Texas A&M at Galveston $0 $0 $0 $417,776 $0 Texas A&M International $0 $0 $0 $0 $0 Texas A&M-Kingsville $145,499 $870,234 $548,951 $1,322,457 $4,829,963 Texas A&M-Texarkana $0 $0 $0 $0 $0 West Texas A&M $0 $0 $277,759 $2,272,169 $1,374,205 Texas Southern $0 $0 $262,650 $0 $0 Texas State University System Angelo State $0 $0 $0 $0 $480,885 Lamar $110,045 $0 $0 $2,276,645 $0 Sam Houston State $0 $0 $0 $602,442 $0 Southwest Texas State $53,257 $0 $0 $0 $0 Sul Ross State $0 $45,902 $0 $0 $0 Sul Ross - Rio Grande $0 $0 $0 $0 $0 Texas Tech $2,963,970 $5,174,771 $6,423,926 $14,721,045 $14,127,946 Texas Woman's $0 $0 $0 $0 $294,641 University of Texas System UT at Arlington $185,266 $0 $1,053,514 $563,828 $0 UT at Austin $10,038,396 $18,737,982 $28,476,859 $37,151,741 $543,402 UT at Brownsville $369,779 $228,467 $0 $47,092 $80,561 UT at Dallas $3,326,419 $4,835,636 $1,077,199 $1,325,489 $112,078 UT at El Paso $205,697 $21,289 $280,200 $3,717,640 $0 UT-Pan American $395 $40,633 $0 $47,591 $42,839 UT of the Permian Basin $0 $0 $42,207 $22,899 $20,520 UT at San Antonio $107,032 $0 $0 $351,566 $0 UT at Tyler $14,333 $0 $0 $0 $0 University of Houston System Univ. of Houston $3,031,010 $6,365,256 $5,223,612 $5,850,858 $66,001 Univ. of Houston-Clear Lake $7,463,280 $0 $0 $242,931 $0 Univ. of Houston-Downtown $71,104 $0 $0 $5,091 $21,936 Univ. of Houston-Victoria $0 $0 $0 $0 $0 University of North Texas $26,576 $1,013,844 $232,896 $745,856 $225,172 Totals $29,671,517 $90,878,483 $47,866,056 $88,346,398 $76,005,178 Shading indicates the five highest in each category. * A&M agency and research foundation expenditures reported by individual affiliated university. (table continued on next page) 21
30 Table 10 - continued Expenditures for Conduct of R&D by Area of Special Interest, FY 2002 Texas Public Universities Institution Manufacturing Technology Materials Science Microelectronics and Computer Technology Water Resources Total Midwestern State $0 $0 $0 $0 $0 Stephen F. Austin State $237,818 $0 $102,927 $3,187,650 $13,233,471 Texas A&M University System* Prairie View A&M $0 $78,643 $35,555 $0 $606,900 Tarleton State $0 $0 $0 $0 $2,803,920 Texas A&M and Services $2,323,688 $3,931,308 $8,692,893 $4,808,117 $134,094,921 Texas A&M-Commerce $0 $0 $7,149 $0 $123,170 Texas A&M-Corpus Christi $181,574 $0 $161,902 $550,969 $2,954,333 Texas A&M at Galveston $0 $0 $0 $0 $417,776 Texas A&M International $0 $0 $0 $0 $0 Texas A&M-Kingsville $1,874 $145,346 $25,509 $25,765 $7,915,598 Texas A&M-Texarkana $0 $0 $0 $0 $0 West Texas A&M $0 $30,466 $2,000 $22,387 $3,978,986 Texas Southern $0 $0 $22,493 $0 $285,143 Texas State University System Angelo State $0 $125,043 $0 $16,969 $622,897 Lamar $60,026 $0 $75,996 $0 $2,522,712 Sam Houston State $0 $0 $0 $279,719 $882,161 Southwest Texas State $0 $52,575 $0 $2,325 $108,157 Sul Ross State $0 $0 $0 $0 $45,902 Sul Ross - Rio Grande $0 $0 $0 $0 $0 Texas Tech $2,728,040 $7,057,914 $4,392,392 $3,168,703 $60,758,707 Texas Woman's $0 $0 $0 $0 $294,641 University of Texas System UT at Arlington $145,762 $579,770 $10,666 $78,143 $2,616,949 UT at Austin $980,125 $16,894,032 $32,953,324 $1,758,585 $147,534,446 UT at Brownsville $59,390 $0 $0 $36,917 $822,206 UT at Dallas $388,370 $1,059,917 $5,559,355 $150,000 $17,834,463 UT at El Paso $96,737 $1,392,021 $429,723 $91,893 $6,235,200 UT-Pan American $527,009 $0 $74,270 $3,752 $736,489 UT of the Permian Basin $0 $0 $0 $0 $85,626 UT at San Antonio $0 $0 $400,746 $61,875 $921,219 UT at Tyler $0 $0 $0 $0 $14,333 University of Houston System Univ. of Houston $1,065,229 $7,371,078 $4,241,986 $5,252 $33,220,282 Univ. of Houston-Clear Lake $0 $0 $379,485 $0 $8,085,696 Univ. of Houston-Downtown $0 $0 $316,086 $0 $414,217 Univ. of Houston-Victoria $0 $0 $0 $0 $0 University of North Texas $344,196 $1,799,289 $1,975,546 $53,769 $6,417,144 Totals $9,139,838 $40,517,402 $59,860,003 $14,302,790 $456,587,665 Shading indicates the five highest in each category. * A&M agency and research foundation expenditures reported by individual affiliated university. 22
31 INSTITUTIONAL DATA HEALTH-RELATED INSTITUTIONS This section of the report contains detailed information on research expenses reported by individual health-related institutions. Statements related to data quality and applicability found on page 1 of this report also apply to the data shown in this section of the report. Figure 7 Expenditures for Research and Development at Texas Public Health-Related Institutions, FY 2002 (Millions of Dollars) UT Health Center at Tyler 8.5 Univ North Texas HSC 12.3 Texas Tech Univ HSC 19.3 Texas A&M HSC 45.1 UT Medical Branch at Galveston UTHSC at San Antonio UTHSC at Houston UT M.D. Anderson Cancer UT Southwestern Medical Center
32 Table 11 Total Expenditures for Sponsored Programs by Source of Funds, FY 2002 State Federal Institution Appropriated Contracts and Grants R&D Other R&D Other R&D Other Texas A&M HSC $22,417,418 $0 $7,774,255 $0 $4,528,441 $0 Texas Tech Univ HSC $8,802,283 $0 $2,902,150 $0 $394,242 $0 Univ North Texas HSC $7,224,263 $887,119 $0 $0 $479,099 $0 UT M.D. Anderson Cancer $117,633,074 $0 $70,160,680 $0 $994,490 $0 UTMB at Galveston $78,100,188 $0 $8,399,231 $4,889,935 $4,041,868 $0 UTHSC at Houston $101,738,767 $0 $8,598,302 $610,231 $3,609,111 $0 UT Health Center at Tyler $2,783,554 $0 $1,541,974 $226,557 $0 $0 UTHSC at San Antonio $83,760,708 $0 $5,625,944 $0 $580,187 $0 UT Southwestern Medical Center $155,257,992 $0 $14,856,627 $0 $2,215,844 $0 Totals $577,718,247 $887,119 $119,859,163 $5,726,723 $16,843,282 $0 Shading indicates the five highest in each category. Table 11 - continued Total Expenditures for Sponsored Programs by Source of Funds, FY 2002 Institution Institution Private, Profit Private, Non-Profit R&D Other R&D Other R&D Other Texas A&M HSC $3,211,277 $0 $2,005,485 $0 $5,129,693 $0 Texas Tech Univ HSC $3,453,730 $0 $1,270,367 $0 $2,457,025 $6,076 Univ North Texas HSC $2,589,552 $0 $1,015,552 $5,336 $1,038,675 $5,287 UT M.D. Anderson Cancer $12,992,227 $4,069,010 $33,406,869 $0 $26,957,620 $0 UTMB at Galveston $546,613 $422,831 $5,737,248 $0 $12,314,390 $84,638 UTHSC at Houston $1,919,082 $0 $11,241,329 $0 $13,721,135 $0 UT Health Center at Tyler $2,922,238 $233,925 $228,833 $0 $977,110 $0 UTHSC at San Antonio $3,293,103 $828,297 $10,773,388 $0 $8,199,323 $0 UT Southwestern Medical Center $7,573,446 $958,903 $13,162,093 $0 $70,892,408 $0 Totals $38,501,268 $6,512,966 $78,841,164 $5,336 $141,687,379 $96,001 Shading indicates the five highest in each category. Table 11 - continued Total Expenditures for Sponsored Programs by Source of Funds, FY 2002 Institution Total R&D Other Total Texas A&M HSC $45,066,569 $0 $45,066,569 Texas Tech Univ HSC $19,279,797 $6,076 $19,285,873 Univ North Texas HSC $12,347,141 $897,742 $13,244,883 UT M.D. Anderson Cancer $262,144,960 $4,069,010 $266,213,970 UTMB at Galveston $109,139,538 $5,397,404 $114,536,942 UTHSC at Houston $140,827,726 $610,231 $141,437,957 UT Health Center at Tyler $8,453,709 $460,482 $8,914,191 UTHSC at San Antonio $112,232,653 $828,297 $113,060,950 UT Southwestern Medical Center $263,958,410 $958,903 $264,917,313 Totals $973,450,503 $13,228,145 $986,678,648 Shading indicates the five highest in each category. 24
33 Table 12 Expenditures for Conduct of R&D by Field, FY 2002 Texas Public Health-Related Institutions Institution Biological and Other Life Sciences Computer Science Engineering Environmental Sciences Mathematical Sciences Texas A&M HSC $66,903 $270 $461,796 $134,994 $0 Texas Tech Univ HSC $5,587,607 $0 $0 $0 $0 Univ North Texas HSC $9,834,797 $0 $0 $0 $0 UT M.D. Anderson Cancer $98,147,538 $0 $0 $0 $10,346,553 UTMB at Galveston $57,228,035 $0 $1,977,077 $0 $0 UTHSC at Houston $23,873,295 $0 $0 $0 $0 UT Health Center at Tyler $0 $0 $0 $64,704 $0 UTHSC at San Antonio $0 $0 $0 $0 $0 UT Southwestern Medical Center $124,359,226 $0 $0 $0 $0 Totals $319,097,401 $270 $2,438,873 $199,698 $10,346,553 Shading indicates the five highest in each category. Table 12 - continued Expenditures for Conduct of R&D by Field, FY 2002 Texas Public Health-Related Institutions Institution Medical Sciences Physical Sciences Other Sciences Arts and Humanities Total Texas A&M HSC $44,228,791 $78,387 $0 $0 $44,971,141 Texas Tech Univ HSC $13,692,190 $0 $0 $0 $19,279,797 Univ North Texas HSC $2,512,344 $0 $0 $0 $12,347,141 UT M.D. Anderson Cancer $148,715,013 $4,935,856 $0 $0 $262,144,960 UTMB at Galveston $49,776,885 $0 $0 $157,541 $109,139,538 UTHSC at Houston $116,954,431 $0 $0 $0 $140,827,726 UT Health Center at Tyler $8,389,005 $0 $0 $0 $8,453,709 UTHSC at San Antonio $112,232,653 $0 $0 $0 $112,232,653 UT Southwestern Medical Center $138,276,357 $0 $1,322,827 $0 $263,958,410 Totals $634,777,669 $5,014,243 $1,322,827 $157,541 $973,355,075 Shading indicates the five highest in each category. 25
34 Table 13 Expenditures for Research and Development by Area of Special Interest, FY 2002 Texas Public Health-Related Institutions Institution Texas A&M HSC $275,415 $2,887,152 $5,905,266 $3,684,329 Texas Tech Univ HSC $1,212,293 $2,420,846 $0 $0 Univ North Texas HSC $1,063,442 $699,023 $2,436,504 $0 UT M.D. Anderson Cancer $0 $262,144,960 $0 $0 UTMB at Galveston $12,787,568 $15,900,711 $6,088,239 $6,476,390 UTHSC at Houston $4,357,554 $2,276,758 $10,837,502 $12,563,160 UT Health Center at Tyler $0 $99,775 $0 $0 UTHSC at San Antonio $9,696,552 $12,098,116 $7,992,841 $1,044,647 UT Southwestern Medical Center $4,876,622 $22,665,277 $27,874,910 $5,843,842 Totals $34,269,446 $321,192,618 $61,135,262 $29,612,368 Shading indicates the five highest in each category. Aging Cancer Research Cardiovascular Research Child Health and Human Development Table 13 - continued Expenditures for Research and Development by Area of Special Interest, FY 2002 Texas Public Health-Related Institutions Institution Mental Health Substance Abuse Total Texas A&M HSC $389,823 $1,543,611 $14,685,596 Texas Tech Univ HSC $1,212,320 $512,187 $5,357,646 Univ North Texas HSC $0 $1,154,997 $5,353,966 UT M.D. Anderson Cancer $0 $0 $262,144,960 UTMB at Galveston $7,095,229 $2,672,903 $51,021,040 UTHSC at Houston $3,384,327 $4,053,168 $37,472,469 UT Health Center at Tyler $0 $0 $99,775 UTHSC at San Antonio $2,835,459 $17,865,395 $51,533,010 UT Southwestern Medical Center $10,308,493 $662,234 $72,231,378 Totals $25,225,651 $28,464,495 $499,899,840 Shading indicates the five highest in each category. 26
35 HISTORICAL DATA Much of the data in this report does not allow accurate comparisons with data contained in reports prior to Since then, many individual data items have been more rigorously defined. Total research expenditures is the statistic allowing the most accurate long-term comparison. However, because a more precise and more conservative definition of research activity was adopted, research expenditures for Fiscal Years 1990 through 2002 are probably understated when compared to expenditures reported in previous years. Figure 8 graphs total research and development expenditures since Figure 8 2,000 Expenditures for Research and Development FY ,044 1,800 1,770 (Millions of Dollars) 1,600 1,400 1,200 1, ,044 1,137 1,177 1,211 1,266 1,323 1,381 1,452 1, Fiscal Year Universities Health-Related Institutions Table 14 on the following page shows total research and development expenditures at Texas public universities over the past four years. Table 15 shows federal research and development expenditures and the ratio of federal-to-state research and development expenditures over the past four years. Tables 16 and 17 show similar data for health-related institutions. One-year and five-year changes in federal expenditures for research and development for the different disciplines are shown in Table
36 Table 14 Expenditures for Research and Development Texas Public Universities Institution FY 1999 FY 2000 FY 2001 FY 2002 Percent Change* Midwestern State $106,729 $101,935 $93,085 $74, % Stephen F. Austin State ** $4,790,743 $5,174,108 $4,840,607 $5,583, % Texas A&M University System Prairie View A&M $9,218,584 $8,795,343 $9,201,307 $10,330, % Tarleton State $3,464,450 $3,504,054 $6,495,956 $7,909, % Texas A&M and Services $334,890,628 $331,027,971 $340,660,614 $372,828, % Texas A&M-Commerce $490,899 $414,154 $336,803 $629, % Texas A&M-Corpus Christi $838,596 $3,517,134 $6,710,930 $10,365, % Texas A&M at Galveston $3,060,639 $2,948,270 $3,252,082 $4,010, % Texas A&M International $418,575 $396,428 $507,806 $677, % Texas A&M-Kingsville $6,618,986 $7,163,871 $7,144,715 $8,591, % Texas A&M-Texarkana $0 $0 $0 $212,252 NA West Texas A&M $1,492,382 $1,778,857 $4,744,757 $6,036, % Texas Southern $2,954,923 $2,595,995 $3,048,521 $4,930, % Texas State University System Angelo State $510,809 $524,986 $643,460 $800, % Lamar $3,740,574 $3,204,061 $3,441,465 $4,237, % Sam Houston State $4,550,751 $3,156,084 $2,281,435 $1,931, % Southwest Texas State $5,661,303 $9,127,901 $11,652,513 $10,400, % Sul Ross State $620,550 $796,408 $773,021 $841, % Sul Ross - Rio Grande $9,058 $0 $6,277 $10, % Texas Tech $40,104,672 $44,110,624 $43,373,437 $51,701, % Texas Woman's $2,258,921 $3,143,775 $3,023,439 $2,960, % University of Texas System UT at Arlington $13,589,868 $14,552,315 $19,966,034 $21,072, % UT at Austin $265,121,990 $295,901,287 $321,580,736 $366,355, % UT at Brownsville $56,104 $299,359 $635,365 $1,286, % UT at Dallas $13,676,687 $15,923,269 $18,531,582 $27,444, % UT at El Paso $27,754,725 $27,784,046 $29,003,608 $27,328, % UT-Pan American $2,296,623 $2,175,562 $2,601,598 $2,605, % UT of the Permian Basin $752,051 $811,973 $737,853 $980, % UT at San Antonio $7,914,116 $10,613,082 $11,751,323 $12,402, % UT at Tyler $88,010 $210,747 $342,206 $375, % University of Houston System Univ. of Houston $52,200,984 $58,729,892 $61,332,253 $82,865, % Univ. of Houston-Clear Lake $6,347,244 $7,597,590 $11,928,221 $8,862, % Univ. of Houston-Downtown $701,508 $588,328 $1,016,352 $1,270, % Univ. of Houston-Victoria $0 $0 $0 $0 NA University of North Texas $12,891,033 $14,601,146 $17,441,681 $12,887, % Totals $829,193,715 $881,270,555 $948,223,316 $1,070,801, % * Percent change for 2002, relative to 1999; NA indicates not applicable ** Stephen F. Austin State University reported corrections to FY 2001 research expenditures: total research expenditures = $4,840,607; from institutional sources = $877,726; and expenditures for agricultural sciences = $797,344; physical sciences = $162,323; biological sciences = $152,562; and arts and humanities = $117,
37 Institution Table 15 Federal Expenditures for Research and Development Texas Public Universities Federal R&D Dollars Fed/ State Ratio Federal R&D Dollars Fed/ State Ratio Federal R&D Dollars Fed/ State Ratio Federal R&D Dollars Fed/ State Ratio Midwestern State $42, $37, $25, $0 NA Stephen F. Austin State $775, $521, $959, $1,054, Texas A&M University System Prairie View A&M $8,773, $7,812, $7,247, $7,915, Tarleton State $1,531, $1,425, $4,321, $5,431, Texas A&M and Services $145,366, $150,341, $152,196, $166,285, Texas A&M-Commerce $118, $175, $114, $315, Texas A&M-Corpus Christi $383, $922, $2,805, $4,473, Texas A&M at Galveston $1,384, $1,340, $1,567, $2,362, Texas A&M International $101, $232, $376, $572, Texas A&M-Kingsville $1,770, $2,050, $1,818, $1,950, Texas A&M-Texarkana $0 NA $0 NA $0 NA $182,262 NA West Texas A&M $99, $147, $2,900, $3,531, Texas Southern $2,431, $2,002, $2,051, $4,147, Texas State University System Angelo State $10, $37, $111, $254, Lamar $2,914, $2,329, $2,216, $2,279, Sam Houston State $3,557, $2,132, $1,802, $1,491, Southwest Texas State $3,444, $6,460, $4,961, $4,769, Sul Ross State $74, $228, $95, $76, Sul Ross - Rio Grande $ $0 NA $ $ Texas Tech $17,219, $17,860, $17,394, $20,511, Texas Woman's $1,306, $1,440, $1,185, $1,321, University of Texas System UT at Arlington $6,289, $5,242, $9,224, $7,923, UT at Austin $159,245, $185,190, $202,440, $235,436, UT at Brownsville $21, $241, $602, $896, UT at Dallas $7,192, $7,049, $8,781, $11,815, UT at El Paso $23,871, $22,972, $22,872, $19,796, UT-Pan American $1,077, $1,149, $1,324, $1,394, UT of the Permian Basin $155, $233, $147, $138, UT at San Antonio $5,480, $7,421, $8,032, $7,641, UT at Tyler $22, $63, $66, $67, University of Houston System Univ. of Houston $23,479, $24,887, $24,227, $33,239, Univ. of Houston-Clear Lake $5,565, $6,647, $10,843, $7,659, Univ. of Houston-Downtown $563, $441, $649, $783, Univ. of Houston-Victoria $0 NA $0 NA $0 NA $0 NA University of North Texas $5,200, $7,301, $8,284, $8,827, Totals $429,468, $466,342, $501,648, $564,550, NA indicates not applicable (no state research and development funds expended). FY 1999 FY 2000 FY 2001 FY
38 Institution Table 16 Expenditures for Research and Development Texas Public Health-Related Institutions FY 1999 FY 2000 FY 2001 TAMU College of Medicine $6,957,100 NA NA NA NA TAMUS Baylor College of Dentistry $2,848,344 NA NA NA NA Texas A&M HSC** NA $24,335,023 $37,328,465 $45,066,569 NA Texas Tech Univ HSC $8,945,802 $10,868,500 $14,343,187 $19,279, % Univ North Texas HSC $9,688,816 $10,130,753 $11,034,554 $12,347, % UT M.D. Anderson Cancer $155,126,397 $182,196,490 $210,236,589 $262,144, % UTMB at Galveston $83,236,093 $87,146,267 $91,088,019 $109,139, % UTHSC at Houston $106,703,163 $122,914,171 $128,161,248 $140,827, % UT Health Center at Tyler $8,256,219 $8,402,408 $9,228,568 $8,453, % UTHSC at San Antonio $77,247,996 $86,074,434 $97,638,253 $112,232, % UT Southwestern Medical Center $163,518,455 $189,216,337 $222,378,235 $263,958, % Totals $622,528,385 $721,284,383 $821,437,118 $973,450, % NA indicates not applicable * Percent change for 2002, relative to 1999 **TAMU College of Medicine combined with TAMUS Baylor College of Dentistry to form Texas A&M HSC in FY2000. FY 2002 Percent Change* Institution Federal R&D Dollars Fed/S tate Ratio Table 17 Federal Expenditures for Research and Development Texas Public Health-Related Institutions FY 1999 FY 2000 FY 2001 Federal R&D Dollars Fed/S tate Ratio Federal R&D Dollars Fed/S tate Ratio Federal R&D Dollars TAMU College of Medicine $3,385, NA NA NA NA NA NA TAMUS Baylor College of Dentistry $1,480, NA NA NA NA NA NA Texas A&M HSC* NA NA $14,320, $18,384, $22,417, Texas Tech Univ HSC $3,360, $4,178, $6,457, $8,802, Univ North Texas HSC $5,370, $5,798, $6,562, $7,224, UT M.D. Anderson Cancer $69,412, $81,871, $91,543, $117,633, UTMB at Galveston $55,061, $61,356, $63,274, $78,100, UTHSC at Houston $72,684, $82,991, $91,267, $101,738, UT Health Center at Tyler $2,297, $2,807, $3,063, $2,783, UTHSC at San Antonio $54,128, $58,600, $66,852, $83,760, UT Southwestern Medical Center $99,994, $109,165, $131,820, $155,257, Totals $367,176, $421,089, $479,224, $577,718, NA indicates not applicable *TAMU College of Medicine combined with TAMUS Baylor College of Dentistry to form Texas A&M HSC in FY2000. FY 2002 Fed/S tate Ratio 30
39 Field Table 18 Federal Expenditures for Research and Development by Field Texas Public Universities and Health-Related Institutions FY 1997 FY 2001 FY 2002 One-Year Change Five-Year Change Agricultural Sciences $20,630,540 $22,801,462 $25,352, % 22.89% Biological and Other Life Sciences $79,759,210 $216,534,637 $260,564, % % Computer Science $27,554,738 $23,355,906 $31,440, % 14.10% Engineering $131,395,899 $136,704,012 $155,461, % 18.32% Environmental Sciences $74,162,768 $89,098,895 $91,715, % 23.67% Mathematical Sciences $8,000,494 $20,341,750 $26,934, % % Medical Sciences $286,617,195 $335,902,604 $401,490, % 40.08% Physical Sciences $71,488,813 $71,679,380 $79,873, % 11.73% Psychology $7,223,920 $9,003,214 $15,332, % % Social Sciences $13,283,215 $15,466,920 $13,416, % 1.00% Other Sciences $857,987 $5,614,753 $6,835, % % Arts and Humanities $730,675 $1,276,581 $948, % 29.87% Business Administration $4,113,765 $2,223,926 $2,502, % % Education $9,757,335 $25,176,460 $24,348, % % Law and Public Administration $1,064,778 $2,327,220 $1,753, % 64.69% Other Non-Science Activities $1,393,688 $3,365,459 $4,309, % % Totals $738,035,020 $980,873,179 $1,142,279, % 54.77% In 2001, the 77th Legislature passed the Centers for Technology Development and Transfer Act, which specifies reporting requirements for intellectual property income and expenses. Intellectual property income is now reported biennially in a new report, Technology Development and Transfer. 31
40 NATIONAL COMPARISONS This section of the report is based on data provided by the National Science Foundation. It is not entirely consistent with data provided in earlier sections of the report because it is based on an earlier year, because reporting requirements are somewhat different, and because the federal reports do not differentiate between state-funded and independent institutions. The National Science Foundation makes three reports available, and each provides somewhat different information: Federal Obligations for Science and Engineering shows federal obligations for grants and contracts awarded to higher education science and engineering programs by federal agencies during the fiscal year. Funds obligated in any given year may be expended over a number of years, so obligations will be somewhat different from expenditures. This report includes support for a number of programs that are not necessarily research and development programs, such as science education programs and assistantship support for engineering students. The amount of support is reported by the agencies. Data from this report measures progress toward the research goal of Closing the Gaps by Federal Obligations for Research and Development in Science and Engineering includes only federal funds obligated during the year to support, directly or indirectly, basic and applied research and development in science and engineering disciplines at higher education institutions. The amount of support is again reported by the agencies. Federally Financed Research and Development Expenditures summarizes federal funds expenditures by higher education institutions to support research and development in any given year. This report is based on data reported by institutions and summarized by the National Science Foundation. Some of the highlights of the 2000 survey of federal research and development expenditures include the following: o o o o The top five states in federal research and development expenditures were: California $2.34 billion New York $1.48 billion Texas $1.10 billion Maryland $1.09 billion Massachusetts $1.06 billion Texas ranked second (behind California) in state- and local government-funded expenditures. Texas ranked third in total R&D expenditures. Texas ranked third in R&D expenditures from institutional sources (behind California and New York), third in industrial sources (behind California and North Carolina), and third in R&D expenditures from all other sources (behind California and New York). 32
41 o o Texas was among the top three states for all of the different types of sources. In Texas, life sciences accounted for 65 percent of the R&D expenditures, followed by engineering (15 percent) and environmental sciences (7 percent). Table 19 Top Five States in Federal R&D Expenditures Selected Science and Engineering Fields, FY 2000 Rank Life Physical Environmental $ Engineering $ $ Sciences Sciences Sciences $ 1 California 1.2B California 336M California 351M California 157M 2 New York 987M Maryland 296M Massachusetts 171M Massachusetts 97M 3 Texas 711M Massachusetts 165M New York 146M Texas 87M 4 Pennsylvania 657M Pennsylvania 163M Maryland 134M New York 70M 5 Massachusetts 515M New York 147M Illinois 91M Colorado 69M Source: National Science Foundation, WebCASPAR Database System, 02/24/2002 Table 20 shows the ranking of all states in federal R&D obligations and federally financed R&D expenditures for Texas ranks sixth in federal obligations for science and engineering, which includes science education, and also ranks sixth in federal obligations for research and development in science and engineering, which excludes science education. Texas ranks third in research and development expenditures from federal sources. Patterns in R&D support over time for the top six states are shown in Figures 9 and 10. California and New York are the uncontested leaders in federal research support to the states. State Table 20 State Rank in Federal Obligations and Federally Financed R&D, FY 2000 (Dollars in Thousands) Federal Obligations for Federal Obligations for R&D Federally Financed R&D Science and Engineering to in Science and Engineering Expenditures at Colleges Colleges and Universities to Colleges and Universities and Universities FY 2000 Rank FY 2000 Rank FY 2000 Rank California $2,790,716 1 $2,517,086 1 $2,335,093 1 New York $1,596,912 2 $1,410,518 2 $1,475,423 2 Maryland $1,227,458 3 $1,051,387 4 $1,090,445 4 Pennsylvania $1,189,920 4 $1,082,830 3 $1,032,963 6 Massachusetts $1,126,975 5 $998,935 5 $1,064,468 5 Texas $1,107,264 6 $958,185 6 $1,101,463 3 North Carolina $724,721 7 $636,881 7 $577,437 8 Illinois $704,479 8 $615,198 8 $681,006 7 Michigan $602,025 9 $532,619 9 $553,119 9 Colorado $548, $441, $427, Ohio $547, $495, $498, Washington $509, $444, $443, (table continued on next page) 33
42 Table 20 - continued State Rank in Federal Obligations and Federally Financed R&D, FY 2000 (Dollars in Thousands) Federal Obligations for Federal Obligations for R&D in Federally Financed R&D Science and Engineering Science and Engineering Expenditures at Colleges to Colleges and Universities to Colleges and Universities and Universities State FY 2000 Rank FY 2000 Florida $481, $420, $408, Missouri $466, $403, $371, Georgia $414, $340, $417, Wisconsin $407, $355, $348, Connecticut $358, $330, $304, Virginia $333, $283, $321, Alabama $327, $280, $275, New Jersey $319, $285, $257, Minnesota $317, $279, $233, Tennessee $284, $236, $240, Indiana $279, $248, $228, Oregon $254, $224, $246, Arizona $245, $214, $244, Iowa $223, $189, $203, Utah $198, $183, $192, District of Columbia $178, $161, $186, Louisiana $165, $141, $169, New Mexico $162, $120, $175, Mississippi $156, $116, $117, South Carolina $153, $121, $131, Kentucky $138, $112, $96, Kansas $117, $96, $105, New Hampshire $111, $98, $95, Oklahoma $110, $74, $93, Hawaii $100, $81, $95, Rhode Island $99, $86, $88, Nebraska $82, $62, $65, Arkansas $80, $64, $58, Vermont $66, $56, $41, Montana $63, $47, $51, Alaska $63, $50, $49, Nevada $61, $54, $60, West Virginia $58, $41, $33, Delaware $55, $46, $40, North Dakota $43, $33, $29, Idaho $38, $28, $28, South Dakota $33, $21, $13, Maine $32, $25, $25, Wyoming $26, $20, $16, SOURCE: National Science Foundation, WebCASPAR Database System, 02/24/ Rank FY 2000 Rank
43 Figure 9 2,500 Federal Obligations for R&D in Science and Engineering Universities and Colleges - Selected States, ,000 California Millions 1,500 Dollars in 1,000 Maryland Massachusetts New York Texas 500 Pennsylvania Year SOURCE: National Science Foundation WebCASPAR Database System, Constant 1996 Dollars, 02/24/2003 Figure 10 2,500 Federally Financed R&D Expenditures Universities and Colleges - Selected States, ,000 California Dollars in Millions 1,500 1,000 New York Maryland Massachusetts Texas 500 Pennsylvania Year SOURCE: National Science Foundation WebCASPAR Database System, Constant 1996 Dollars, 02/24/
44 Table 21 shows federal obligations and federally financed R&D expenditures for Texas higher education institutions for FY The table includes public and independent institutions. In all cases, the top five institutions account for percent of the total federal support. Table 21 Federal Obligations and Federally Financed R&D by Texas Institutions, FY 2000 (Dollars in Thousands) Institution Abilene Christian $130 $130 $165 Alamo Community Coll. Dist. $574 $ Angelo State $177 $ Austin Community Coll. $ Baylor-Dentistry $1,380 Baylor- Coll. of Medicine $197,295 $172,333 $193,249 Baylor Univ. $418 $353 $353 Central Texas Coll. $90 $ Coll. of the Mainland $ Collin County Community Coll. $ El Paso Community Coll. $592 $ Houston Community Coll. $1,628 $ Jarvis Christian Coll. $ $55 Lamar $ $2,330 Le Tourneau Univ. $16 $ North Central Texas Coll. $178 $ Odessa Coll. $ Our Lady of the Lake $435 $ Prarie View A&M $11,737 $7,283 $7,679 Rice $27,929 $26,374 $35,144 San Jacinto Coll. $ Sam Houston State $645 $645 $2,128 South Texas Community Coll. $1,674 $ Southern Methodist $5,424 $5,356 $6,302 Southwest Texas Junior Coll. $ Southwest Texas State $4,101 $3,165 $3,519 St Edwards Univ. $ St Mary's $582 $212 $62 Stephen F. Austin State $550 $550 $521 Sul Ross State $228 Tarleton State $2,000 $2,000 $1,426 Texas A&M and Services $91,167 $60,811 $149,639 Shading indicates the five highest in each category. Federal Obligations for Science and Engineering Federal Obligations for R&D in Science and Engineering Federally Financed R&D Expenditures 36
45 Table 21 - continued Federal Obligations and Federally Financed R&D by Texas Institutions, FY 2000 (Dollars in Thousands) Institution Federal Obligations for Science and Engineering Texas A&M HSC $1,158 $795 $14,321 Texas A&M International $303 $ Texas A&M System Office $21,519 $19, Texas A&M-Commerce $157 Texas A&M-Corpus Christi $895 $334 $1,363 Texas A&M-Kingsville $424 $162 $2,179 Texas Christian $1,873 $1,871 $2,441 Texas Southern $3,758 $3,096 $1,844 Texas Tech $20,780 $19,738 $21,481 Texas Woman's $2,005 $1,694 $1,440 Trinity $564 $426 $746 Univ. North Tx HSC $5,799 Univ. of Dallas $35 $ Univ. of Houston $19,200 $17,499 $21,365 Univ. of Houston System Administration $2,231 $1, Univ. of Houston-Clear Lake $8,156 $8,110 $6,383 Univ. of Houston-Downtown $272 $172 $660 Univ. of the Incarnate Word $480 $ University of North Texas $8,806 $7,921 $3,618 UT at Arlington $4,625 $3,577 $5,106 UT at Austin $159,849 $134,977 $178,889 UT at Brownsville $2,303 $ UT at Dallas $6,628 $6,048 $7,049 UT at El Paso $12,910 $7,722 $16,416 UT at San Antonio $13,845 $6,683 $7,441 UT at Tyler $ UT M.D. Anderson Cancer $92,691 $90,566 $81,872 UT of the Permian Basin $ UT Southwestern Medical Center $126,389 $119,767 $109,165 UT System Office $8,805 $8, UTHSC at Houston $88,990 $83,810 $79,665 UTHSC at San Antonio $77,731 $71,172 $65,251 UTMB at Galveston $66,512 $60,241 $61,357 UT-Pan American $2,911 $203 $1,135 West Texas A&M $214 $118 $140 Wiley Coll. $ Texas Total $1,107,264 $958,185 $1,101,463 SOURCE: National Science Foundation, WebCASPAR Database System, 02/24/2003 Shading indicates the five highest in each category. Federal Obligations for R&D in Science and Engineering Federally Financed R&D Expenditures 37
46 Figure 11 shows federal obligations to Texas higher education institutions for research and development in science and engineering by federal agency. The National Institutes of Health have a long history of providing most of the federal research support to Texas higher education institutions. 600 Figure 11 Federal Obligations for R&D in Science and Engineering Texas Universities and Colleges, Top Five Support Agencies 500 Dollars in Millions National Institutes of Health Department of Defense NASA National Science Foundation Year SOURCE: National Science Foundation WebCASPAR Database System, Constant 1996 Dollars, 02/24/2003 Department of Energy Table 22 shows federal obligations from federal agencies providing the most support to the most federal research-intensive Texas higher education institutions. The National Institutes of Health provide most of the federal support at health-related institutions. The Department of Defense, the National Science Foundation, and the National Institutes of Health provide most of the federal support for The University of Texas at Austin. The Department of Agriculture, the National Institutes of Health, and the National Science Foundation provide most of the support for Texas A&M University. The National Science Foundation and the National Institutes of Health provide most of the federal support for Rice University. The University of Houston receives most of its federal support from the National Institutes of Health and the National Science Foundation. Texas Tech University receives most of its support from the Department of Defense and the National Institutes of Health. 38
47 Table 22 Texas Universities and Colleges with Federal Science and Engineering R&D Obligations of more than $10 Million By Support Agency, FY 2000 (Dollars in Thousands) Institution National Institutes of Health Dept. of Defense National Science Foundation NASA Dept. of Energy Dept. of Agriculture All Other Federal Agencies Total of All Federal Agencies Baylor-Coll. of Medicine $162,948 $2,177 $292 $2,055 $750 $1,083 $3,028 $172,333 UT at Austin $24,638 $56,480 $26,286 $9,706 $11,653 $11 $6,203 $134,977 UT Southwestern Med Center $116,842 $1,925 $384 $616 $0 $0 $0 $119,767 UT M.D. Anderson Cancer $84,592 $4,069 $319 $383 $0 $0 $1,203 $90,566 UTHSC at Houston $76,902 $484 $480 $796 $0 $0 $5,148 $83,810 UTHSC at San Antonio $57,368 $10,467 $749 $313 $0 $0 $2,275 $71,172 Texas A&M $11,877 $9,510 $11,707 $4,222 $3,157 $15,465 $4,873 $60,811 UTMB at Galveston $56,487 $395 $556 $796 $619 $0 $1,388 $60,241 Rice $5,034 $4,161 $11,314 $3,183 $2,323 $263 $96 $26,374 Texas A&M System Office $15,999 $1,623 $0 $0 $1,888 $20 $384 $19,914 Texas Tech $4,487 $6,683 $2,397 $1,134 $1,218 $1,914 $1,905 $19,738 Univ. of Houston $9,725 $557 $4,074 $1,746 $1,095 $121 $181 $17,499 SOURCE: National Science Foundation, WebCASPAR Database System, 02/24/2003 Figure 12 shows federally financed research and development expenditures at Texas public and private higher education institutions by scientific discipline. Most of the expenditures are made in medical and biological sciences. Figure 12 Federally Financed Research Expenditures by Discipline Texas Public and Private Institutions, FY 2000 All Other Life Sciences Biological Sciences Computer Sciences Engineering Environmental Sciences R&D Discipline Mathematical Sciences Medical Sciences Other Sciences Physical Sciences Psychology Social Sciences SOURCE: National Science Foundation WebCASPAR Database System, 02/24/2003 Dollars in Millions 39
48 40

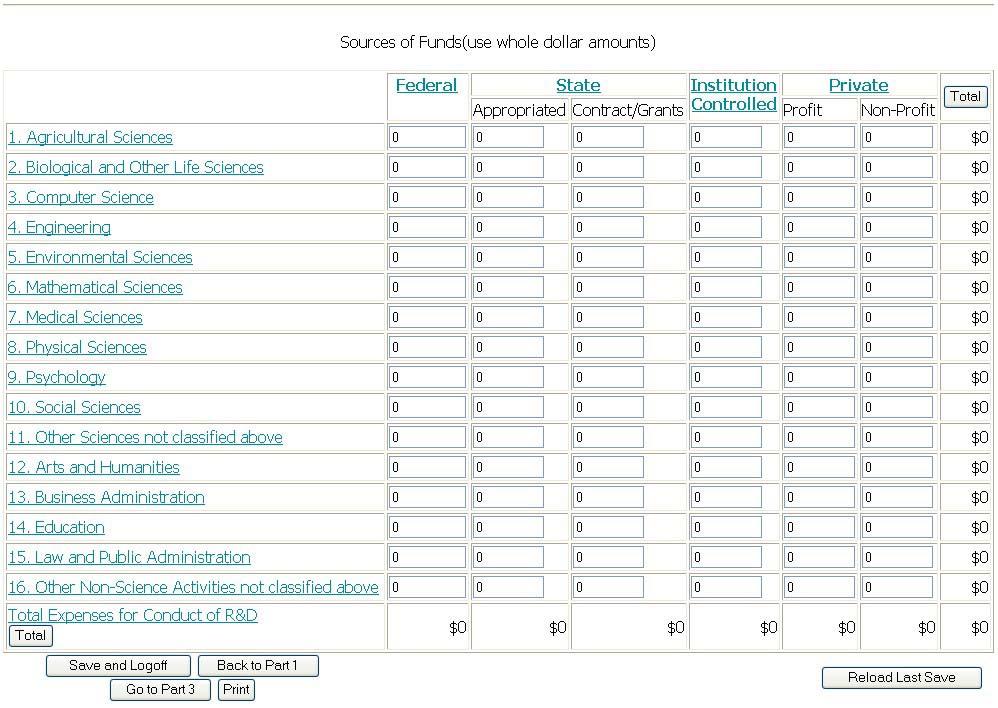
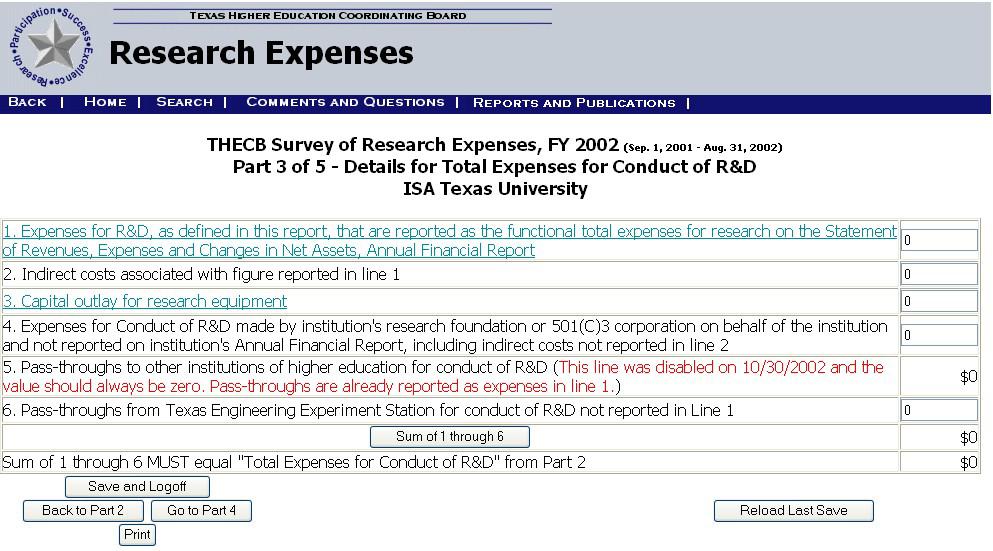
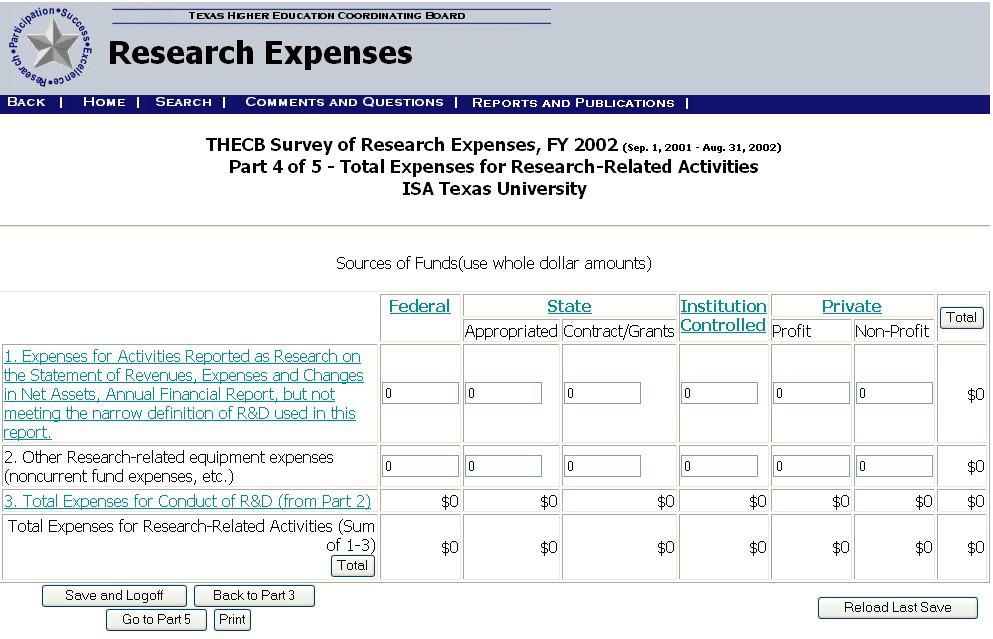
49 APPENDIX A RESEARCH EXPENDITURES SURVEYS THECB - Survey of Research Expenses, FY 2002 Public Universities and Health-Related Institutions About the On-Line Form The survey should be completed by using the on-line form by December 2, 2002 The on-line form will be used to submit your institution's FY 2002 research expense data. The login page for the form has an instructions page and links to previous expenditures reports. Blank Lotus and Excel worksheets can be downloaded here, but the information still must be entered into the on-line form. The on-line form consists of five parts, easily navigated with the buttons on the bottom of each web page. The whole form is saved when clicking on the "Total" buttons, going from page to page or clicking the "Save and Logoff" buttons. Using the "Reload Last Save" button will return information changed on a particular page before any other buttons are clicked on. Clicking underlined row or column labels will open a viewable definition for that item, and full instructions and definitions are accessible from the bottom of any page. Use whole dollar amounts, as the system will truncate decimals. The system will ignore any characters (dollar signs, commas, etc.) typed into entry blocks in parts 2-5. Click on any "Total" button to calculate column and row totals which are clearly marked in yellow. The FICE code for your institution will be used to log in to the system, and please safeguard the provided password and authorization code. The password may be issued to individuals for completion of the form. When the form is ready for final submission, the final approval authority (usually the highest research executive at the institution) clicks the "Submit to THECB" button in part 5 and enters name, title and the authorization code. Using the print button before final authorization will produce a draft printout of all forms. After final authorization, your data cannot be accessed or altered, but a printout of the final version can be produced. If you have questions or need assistance, contact information is located at the bottom of each web page or you may call Dale Cherry or Linda Domelsmith at A-1

50 A-2
51 A-3


52 Part 5 for Public Universities Part 5 for Public Health Institutions A-4
u Articulation and Transfer Best Practices
 Articulation and Trevor Chandler Houston Community College December 17, 2014 What is an Articulation Agreement Content of an Articulation Agreement What is the purpose of an Articulation Agreement What
Texas Healthcare & Bioscience Institute
 Texas Healthcare & Bioscience Institute Tom Kowalski President October 27, 2004 What is THBI? The Texas Healthcare and Bioscience Institute (THBI) is a non-profit, public policy research organization,
LEGISLATIVE APPROPRIATIONS REQUEST
 LEGISLATIVE APPROPRIATIONS REQUEST FISCAL YEARS 2018 AND 2019 Submitted to the Governor's Office and the Legislative Budget Board THE UNIVERSITY OF TEXAS SYSTEM ADMINISTRATION August 2016 THE UNIVERSITY
NATIONAL CENTER FOR EDUCATION STATISTICS
 NATIONAL CENTER FOR EDUCATION STATISTICS The Integrated Postsecondary Education Data System (IPEDS) is the core postsecondary education data collection program for the NCES. It is a single, comprehensive
Texas Libraries: Responding to the Needs of Job Seekers
 Texas Libraries: Responding to the Needs of Job Seekers Kyla Hunt, Consultant, Continuing Education and Consulting Dawn Vogler, Manager, Continuing Education and Consulting Library Development Division
Higher Education. Pennsylvania State System of Higher Education. November 3, 2017
 November 3, 2017 Higher Education Pennsylvania s diverse higher education sector - consisting of many different kinds of public and private colleges and universities - helps students gain the knowledge
TRENDS IN. College Pricing
 2008 TRENDS IN College Pricing T R E N D S I N H I G H E R E D U C A T I O N S E R I E S T R E N D S I N H I G H E R E D U C A T I O N S E R I E S Highlights 2 Published Tuition and Fee and Room and Board
NATIONAL CENTER FOR EDUCATION STATISTICS
 NATIONAL CENTER FOR EDUCATION STATISTICS Palm Desert, CA The Integrated Postsecondary Education Data System (IPEDS) is the nation s core postsecondary education data collection program. It is a single,
EDUCATIONAL ATTAINMENT
 EDUCATIONAL ATTAINMENT By 2030, at least 60 percent of Texans ages 25 to 34 will have a postsecondary credential or degree. Target: Increase the percent of Texans ages 25 to 34 with a postsecondary credential.
CHAPTER 4: REIMBURSEMENT STRATEGIES 24
 CHAPTER 4: REIMBURSEMENT STRATEGIES 24 INTRODUCTION Once state level policymakers have decided to implement and pay for CSR, one issue they face is simply how to calculate the reimbursements to districts
Governor s Office of Budget, Planning and Policy and the Legislative Budget Board. Texas A&M University - Corpus Christi
 LEGISLATIVE APPROPRIATIONS REQUEST For Fiscal Years 212 and 213 Submitted to the Governor s Office of Budget, Planning and Policy and the Legislative Budget Board by Texas A&M University - Corpus Christi
Appendix IX. Resume of Financial Aid Director. Professional Development Training
 Appendix IX Resume of Financial Aid Director Professional Development Training ALBERT TEZENO 6815 Chapelfield Houston Texas 77049 Tezeno_aj@yahoo.com 281-459-4114 cell 832-642-6937 Director of Financial
State Budget Update February 2016
 State Budget Update February 2016 2016-17 BUDGET TRAILER BILL SUMMARY The Budget Trailer Bill Language is the implementing statute needed to effectuate the proposals in the annual Budget Bill. The Governor
Financing Education In Minnesota
 Financing Education In Minnesota 2016-2017 Created with Tagul.com A Publication of the Minnesota House of Representatives Fiscal Analysis Department August 2016 Financing Education in Minnesota 2016-17
NC Community College System: Overview
 NC Community College System: Overview Presentation to Joint Appropriations Subcommittee on Education Brett Altman Mark Bondo Fiscal Research Division March 18, 2015 Presentation Agenda 1. NCCCS Background
1.0 INTRODUCTION. The purpose of the Florida school district performance review is to identify ways that a designated school district can:
 1.0 INTRODUCTION 1.1 Overview Section 11.515, Florida Statutes, was created by the 1996 Florida Legislature for the purpose of conducting performance reviews of school districts in Florida. The statute
Toward a Latino Attainment Agenda:
 Toward a Latino Attainment Agenda: Shaping Our Own Destiny by Francisco G. Cigarroa, M.D. TomÁsRivera LECTURE SERIES AMERICAN ASSOCIATION OF HISPANICS IN HIGHER EDUCATION 2013 Toward a Latino Attainment
STATE CAPITAL SPENDING ON PK 12 SCHOOL FACILITIES NORTH CAROLINA
 STATE CAPITAL SPENDING ON PK 12 SCHOOL FACILITIES NORTH CAROLINA NOVEMBER 2010 Authors Mary Filardo Stephanie Cheng Marni Allen Michelle Bar Jessie Ulsoy 21st Century School Fund (21CSF) Founded in 1994,
About the College Board. College Board Advocacy & Policy Center
 15% 10 +5 0 5 Tuition and Fees 10 Appropriations per FTE ( Excluding Federal Stimulus Funds) 15% 1980-81 1981-82 1982-83 1983-84 1984-85 1985-86 1986-87 1987-88 1988-89 1989-90 1990-91 1991-92 1992-93
UIC HEALTH SCIENCE COLLEGES
 Academic Mission Report: Board of Trustees March 10, 2010 Joseph A. Flaherty, MD Dean, College of Medicine INNOVATION EXCELLENCE SERVICE Brief History 1858 Illinois Eye and Ear Infirmary opens 1859 College
Trends in Student Aid and Trends in College Pricing
 Trends in Student Aid and Trends in College Pricing 2012 NYSFAAA Conference Katrina Delgrosso Senior Educational Manager Agenda What is the College Board Advocacy & Policy Center? Trends in College Pricing
Director, Ohio State Agricultural Technical Institute
 Director, Ohio State Agricultural Technical Institute The Ohio State University invites applications and nominations for the position of Director, Ohio State Agricultural Technical Institute (Ohio State
CURRENT POSITION: Angelo State University, San Angelo, Texas
 Raelye Taylor Self, Ed.D Angelo State University College of Education Department of Curriculum and Instruction ASU Station #10921 San Angelo, Texas 76909 Phone: 325-486-6773 Email: Raelye.Self@angelo.edu
Texas Bioscience Institute Educating Scientists For The Future. Nelda Howton
 Texas Bioscience Institute Educating Scientists For The Future Nelda Howton www.texasbioscienceinstitute.com Nov. 20, 2007 Impact of the Health Care Industry Temple is home to three hospitals and the Texas
INTERPRETATIONS. Condensed FY 2009 Annual Report RESEARCH. Norman Campus
 Norman Campus RESEARCH INTERPRETATIONS Condensed FY 2009 Annual Report THE UNIVERSITY OF OKLAHOMA OFFICE OF THE VICE PRESIDENT OF RESEARCH NORMAN CAMPUS AND NORMAN CAMPUS PROGRAMS AT OU TULSA Norman Campus
FORT HAYS STATE UNIVERSITY AT DODGE CITY
 FORT HAYS STATE UNIVERSITY AT DODGE CITY INTRODUCTION Economic prosperity for individuals and the state relies on an educated workforce. For Kansans to succeed in the workforce, they must have an education
EDUCATIONAL ATTAINMENT
 EDUCATIONAL ATTAINMENT By 2030, at least 60 percent of Texans ages 25 to 34 will have a postsecondary credential or degree. Target: Increase the percent of Texans ages 25 to 34 with a postsecondary credential.
All Hands on Deck! Engaging Faculty Voices to Rise Above the Storm!
 All Hands on Deck! Engaging Faculty Voices to Rise Above the Storm! Introduction Five R s to Diversify Engineering Faculties Recruiting Faculty Colleagues Relating to Faculty Colleagues Retaining Colleagues
San Antonio Breast Cancer Symposium
 San Antonio Breast Cancer Symposium SABCS UPDATE Saturday, January 20, 2018 Kleberg Auditorium Alkek Building, 1st Floor Baylor College of Medicine, One Baylor Plaza Houston, TX 77030 Featuring highlights
Program Change Proposal:
 Program Change Proposal: Provided to Faculty in the following affected units: Department of Management Department of Marketing School of Allied Health 1 Department of Kinesiology 2 Department of Animal
INDEPENDENT STATE OF PAPUA NEW GUINEA.
 Education Act 1983 (Consolidated to No 13 of 1995) [lxxxiv] Education Act 1983, INDEPENDENT STATE OF PAPUA NEW GUINEA. Being an Act to provide for the National Education System and to make provision (a)
Massachusetts Department of Elementary and Secondary Education. Title I Comparability
 Massachusetts Department of Elementary and Secondary Education Title I Comparability 2009-2010 Title I provides federal financial assistance to school districts to provide supplemental educational services
THE COLLEGE OF WILLIAM AND MARY IN VIRGINIA INTERCOLLEGIATE ATHLETICS PROGRAMS FOR THE YEAR ENDED JUNE 30, 2005
 THE COLLEGE OF WILLIAM AND MARY IN VIRGINIA INTERCOLLEGIATE ATHLETICS PROGRAMS FOR THE YEAR ENDED JUNE 30, 2005 - T A B L E O F C O N T E N T S INDEPENDENT AUDITOR S REPORT ON APPLICATION OF AGREED-UPON
FY Matching Scholarship Grant Allocations by County Based on Free and Reduced Lunch (FRL) Population 1
 Population 1") FY 2015-2016 Matching Scholarship Grant Allocations by County Based on Free and Reduced Lunch (FRL) Population 1 Y NAME K-12 FRL % FRL % OF STATE FRL Population Graduates in class of 2014 Estimated number
FY 2015-2016 Matching Scholarship Grant Allocations by County Based on Free and Reduced Lunch (FRL) Population 1 Y NAME K-12 FRL % FRL % OF STATE FRL Population Graduates in class of 2014 Estimated number
Texas A&M University-Texarkana
 LEGISLATIVE APPROPRIATIONS REQUEST For Fiscal Years 216 and 217 Submitted to the Governor s Office of Budget Planning and Policy and the Legislative Budget Board by Texas A&M University-Texarkana October
Strategic Plan Dashboard Results. Office of Institutional Research and Assessment
 29-21 Strategic Plan Dashboard Results Office of Institutional Research and Assessment Binghamton University Office of Institutional Research and Assessment Definitions Fall Undergraduate and Graduate
Financial Plan. Operating and Capital. May2010
 10 Financial Plan Operating and Capital May2010 Published by: The Division of Planning and Budget Cornell University 440 Day Hall Ithaca, New York 14853 http://dpb.cornell.edu 607 255 0155 May 2010 Edited
HOUSE OF REPRESENTATIVES AS REVISED BY THE COMMITTEE ON EDUCATION APPROPRIATIONS ANALYSIS
 BILL #: HB 269 HOUSE OF REPRESENTATIVES AS REVISED BY THE COMMITTEE ON EDUCATION APPROPRIATIONS ANALYSIS RELATING TO: SPONSOR(S): School District Best Financial Management Practices Reviews Representatives
Examining the Structure of a Multidisciplinary Engineering Capstone Design Program
 Paper ID #9172 Examining the Structure of a Multidisciplinary Engineering Capstone Design Program Mr. Bob Rhoads, The Ohio State University Bob Rhoads received his BS in Mechanical Engineering from The
DELIVERING A DEMAND LED SYSTEM IN THE U.S. THE ALAMO COMMUNITY COLLEGES APPROACH
 DELIVERING A DEMAND LED SYSTEM IN THE U.S. THE ALAMO COMMUNITY COLLEGES APPROACH LEARNING AND SKILLS DEVELOPMENT AGENCY NORTHERN IRELAND DR. BRUCE LESLIE, CHANCELLOR THE ALAMO COMMUNITY COLLEGES 40
Program Review
 De Anza College, Cupertino, CA 1 Description and Mission of the Program A) The Manufacturing and CNC Program (MCNC) offers broad yet in-depth curriculum that imparts a strong foundation for direct employment
2016 Match List. Residency Program Distribution by Specialty. Anesthesiology. Barnes-Jewish Hospital, St. Louis MO
 2016 Match List Residency Program Distribution by Specialty Anesthesiology Cleveland Clinic Foundation - Ohio, Cleveland OH University of Arkansas Medical School - Little Rock, Little Rock AR University
University of Central Florida Board of Trustees Finance and Facilities Committee
 ITEM: FFC-1 University of Central Florida Board of Trustees Finance and Facilities Committee SUBJECT: Minor Amendment to the University of Central Florida 2015-25 Campus Master Plan Update DATE: December
2015 Academic Program Review. School of Natural Resources University of Nebraska Lincoln
 2015 Academic Program Review School of Natural Resources University of Nebraska Lincoln R Executive Summary Natural resources include everything used or valued by humans and not created by humans. As a
Identifying Users of Demand-Driven E-book Programs: Applications for Collection Development
 Identifying Users of Demand-Driven E-book Programs: Applications for Collection Development Background Information In 2003 San José State University (SJSU) and the City of San José formed a unique partnership
Council on Postsecondary Education Funding Model for the Public Universities (Excluding KSU) Bachelor's Degrees
 Bachelor's Degrees") Bachelor's Degrees Institution 2013-14 2014-15 2015-16 UK 3,988 4,238 4,540 UofL 2,821 2,832 2,705 EKU 2,508 2,532 2,559 MoSU 1,144 1,166 1,306 MuSU 1,469 1,512 1,696 NKU 2,143 2,214 2,196 WKU 2,751 2,704
Bachelor's Degrees Institution 2013-14 2014-15 2015-16 UK 3,988 4,238 4,540 UofL 2,821 2,832 2,705 EKU 2,508 2,532 2,559 MoSU 1,144 1,166 1,306 MuSU 1,469 1,512 1,696 NKU 2,143 2,214 2,196 WKU 2,751 2,704
Texas Public Libraries:
 Texas Public Libraries: Economic Benefits and Return on Investment Prepared for: Texas State Library and Archives Commission By the: Bureau of Business Research IC² Institute The University of Texas at
AB104 Adult Education Block Grant. Performance Year:
 AB104 Adult Education Block Grant Performance Year: 2015-2016 Funding source: AB104, Section 39, Article 9 Version 1 Release: October 9, 2015 Reporting & Submission Process Required Funding Recipient Content
A Comparison of State of Florida Charter Technical Career Centers to District Non-Charter Career Centers,
 A Comparison of State of Florida Charter Technical Career to District Non-Charter Career, 2013-14 At a Glance In school year 2013-14, there were 4,502 students enrolled in the state of Florida s charter
Value of Athletics in Higher Education March Prepared by Edward J. Ray, President Oregon State University
 Materials linked from the 5/12/09 OSU Faculty Senate agenda 1. Who Participates Value of Athletics in Higher Education March 2009 Prepared by Edward J. Ray, President Oregon State University Today, more
The Policymaking Process Course Syllabus
 The Policymaking Process Course Syllabus GOVT 4370 Policy Making Process Fall 2007 Paul J. Bonicelli, PhD Assistant Administrator United States Agency for International Development (USAID) 1300 Pennsylvania
Michigan State University
 Michigan State University Dean of the College of Agriculture and Natural Resources Michigan State University (MSU), the nation s premier land-grant university, invites applications and nominations for
Communities in Schools of Virginia
 Communities in Schools of Virginia General Information Contact Information Nonprofit Communities in Schools of Virginia Address 413 Stuart Circle, Unit 303 Richmond, VA 23220 Phone 804 237-8909 Fax 804
CHAPTER XI DIRECT TESTIMONY OF REGINALD M. AUSTRIA ON BEHALF OF SOUTHERN CALIFORNIA GAS COMPANY AND SAN DIEGO GAS & ELECTRIC COMPANY
 Application No: A.1-09-00 Exhibit No.: Witness: R. Austria Application of Southern California Gas Company (U 90 G) and San Diego Gas & Electric Company (U 90 G) to Recover Costs Recorded in the Pipeline
Northwest-Shoals Community College - Personnel Handbook/Policy Manual 1-1. Personnel Handbook/Policy Manual I. INTRODUCTION
 Northwest-Shoals Community College - Personnel Handbook/Policy Manual 1-1 Personnel Handbook/Policy Manual I. INTRODUCTION Northwest-Shoals Community College - Personnel Handbook/Policy Manual 1-2 I. INTRODUCTION
Data Glossary. Summa Cum Laude: the top 2% of each college's distribution of cumulative GPAs for the graduating cohort. Academic Honors (Latin Honors)
") Institutional Research and Assessment Data Glossary This document is a collection of terms and variable definitions commonly used in the universities reports. The definitions were compiled from various
Institutional Research and Assessment Data Glossary This document is a collection of terms and variable definitions commonly used in the universities reports. The definitions were compiled from various
ALAMO CITY OPHTHALMOLOGY
 34th ANNUAL ALAMO CITY OPHTHALMOLOGY C LINICAL CO NFERE N C E Original Research, Ethics, Patient Safety Projects Saturday, April 12, 2014 San Antonio Country Club 4100 N New Braunfels Avenue 78209 Sponsored
Cynthia M. Stanley, Ph.D., LRT, CTRS
 Cynthia M. Stanley, Ph.D., LRT, CTRS Winston Salem State University 601 Martin Luther King, Jr. Drive Anderson Center, Suite C017 Winston-Salem, NC 27110 (336) 750-2588 stanleyc@wssu.edu EDUCATIONAL BACKGROUND
Trends in Higher Education Series. Trends in College Pricing 2016
 Trends in Higher Education Series Trends in College Pricing 2016 See the Trends in Higher Education website at trends.collegeboard.org for figures and tables in this report and for more information and
Moving the Needle: Creating Better Career Opportunities and Workforce Readiness. Austin ISD Progress Report
 Moving the Needle: Creating Better Career Opportunities and Workforce Readiness Austin ISD Progress Report 2013 A Letter to the Community Central Texas Job Openings More than 150 people move to the Austin
UCB Administrative Guidelines for Endowed Chairs
 UCB Administrative Guidelines for Endowed Chairs I. General A. Purpose An endowed chair provides funds to a chair holder in support of his or her teaching, research, and service, and is supported by a
Greetings, Ed Morris Executive Director Division of Adult and Career Education Los Angeles Unified School District
 Greetings, The thesis of my presentation at this year s California Adult Education Administrators (CAEAA) Conference was that the imprecise and inconsistent nature of the statute authorizing adult education
David Erwin Ritter Associate Professor of Accounting MBA Coordinator Texas A&M University Central Texas
 David Erwin Ritter Associate Professor of Accounting MBA Coordinator Texas A&M University Central Texas Education Doctor of Business Administration (1986) Juris Doctor (1996) Master of Business Administration
Trends in College Pricing
 Trends in College Pricing 2009 T R E N D S I N H I G H E R E D U C A T I O N S E R I E S T R E N D S I N H I G H E R E D U C A T I O N S E R I E S Highlights Published Tuition and Fee and Room and Board
Dr. Tang has been an active member of CAPA since She was Co-Chair of Education Committee and Executive committee member ( ).
.") 2015 CAPA Candidates Profiles For President-elect (alphabetic order): Dr. Ping Tang Dr. Ping Tang is a Professor at Department of Pathology and Laboratory Medicine, University of Rochester Medical Center,
2015 CAPA Candidates Profiles For President-elect (alphabetic order): Dr. Ping Tang Dr. Ping Tang is a Professor at Department of Pathology and Laboratory Medicine, University of Rochester Medical Center,
46 Children s Defense Fund
 Nationally, about 1 in 15 teens ages 16 to 19 is a dropout. Fewer than two-thirds of 9 th graders in Florida, Georgia, Louisiana and Nevada graduate from high school within four years with a regular diploma.
Reaching the Hispanic Market The Arbonne Hispanic Initiative
 Reaching the Hispanic Market The Arbonne Hispanic Initiative Hispanic Initiative Overview 2002 Arbonne en Español Started 2006 Initiated Hispanic Initiative 2007 Market Study & Survey Field Support» Jael
CAMPUS PROFILE MEET OUR STUDENTS UNDERGRADUATE ADMISSIONS. The average age of undergraduates is 21; 78% are 22 years or younger.
 CAMPUS PROFILE MEET OUR STUDENTS Freshmen are defined here as all domestic students entering in fall quarter from high school. These statistics include information drawn from records available at UC Davis.
2012 ACT RESULTS BACKGROUND
 Report from the Office of Student Assessment 31 November 29, 2012 2012 ACT RESULTS AUTHOR: Douglas G. Wren, Ed.D., Assessment Specialist Department of Educational Leadership and Assessment OTHER CONTACT
VOL VISION 2020 STRATEGIC PLAN IMPLEMENTATION
 VOL VISION 2020 STRATEGIC PLAN IMPLEMENTATION CONTENTS Vol Vision 2020 Summary Overview Approach Plan Phase 1 Key Initiatives, Timelines, Accountability Strategy Dashboard Phase 1 Metrics and Indicators
An Introduction to School Finance in Texas
 An Introduction to School Finance in Texas May 12, 2010 Sheryl Pace TTARA Research Foundation space@ttara.org (512) 472-8838 Texas Public Education System 1,300 school districts (#1 in the nation) 1,025
Teacher Supply and Demand in the State of Wyoming
 Teacher Supply and Demand in the State of Wyoming Supply Demand Prepared by Robert Reichardt 2002 McREL To order copies of Teacher Supply and Demand in the State of Wyoming, contact McREL: Mid-continent
A Financial Model to Support the Future of The California State University
 A Financial Model to Support the Future of The California State University Report of the Chancellor s Task Force for a Sustainable Financial Model for the CSU LETTER TO CHANCELLOR FROM THE CO-CHAIRS The
Welcome. Paulo Goes Dean, Eller College of Management Welcome Our region
 Welcome. Paulo Goes Dean, Welcome. Our region Outlook for Tucson Patricia Feeney Executive Director, Southern Arizona Market Chase George W. Hammond, Ph.D. Director, University of Arizona 1 Visit the award-winning
An Analysis of the El Reno Area Labor Force
 An Analysis of the El Reno Area Labor Force Summary Report for the El Reno Industrial Development Corporation and Oklahoma Department of Commerce David A. Penn and Robert C. Dauffenbach Center for Economic
The Economic Impact of College Bowl Games
 The Economic Impact of College Bowl Games September 2016 TABLE OF CONTENTS Contents Executive Summary 1 Introduction 2 Bowl Game EI Studies 4 Analysis 5 Limitations 7 Research Team 8 EXECUTIVE SUMMARY
MEMORANDUM. Leo Zuniga, Associate Vice Chancellor Communications
 MEMORANDUM To: From: Alamo Colleges Family Leo Zuniga, Associate Vice Chancellor Communications Date: March 26, 2013 Subject: Board Meeting Report On behalf of Dr. Leslie, the following is a summary of
SCICU Legislative Strategic Plan 2018
 The primary objective of the South Carolina Independent Colleges and Universities Legislative Strategic Plan is to establish an agenda and course of action for a program of education and advocacy on matters
Laura G. Jones-Swann
 Laura G. Jones-Swann Email: lalaswann@gmail.com EDUCATION 1975-1977 Indian River Community College, Ft. Pierce, Florida 33450. DEGREE: Associate of Arts, awarded May 1977. 1977-1979 University of Texas
The City University of New York
 The City University of New York FY 2003-2004 Capital Budget Request and 5 Year Capital Plan Report to the Board of Trustees Committee on Facilities Planning and Management November 6, 2002 Objective &
College of Education Department of Educational Psychology SYLLABUS
 College of Education Department of Educational Psychology SYLLABUS Course: EPSY 6310.01R Ethical & Legal Issues in School Psychology Term: Summer I 2015 Day/Time: Tuesdays/Thursdays 5:00-10:15pm Location:
Strategic Plan Update, Physics Department May 2010
 Strategic Plan Update, Physics Department May 2010 Mission To generate and disseminate knowledge of physics and its applications. Vision The Department of Physics faculty will continue to conduct cutting
Educational History. B. A., 1988, University Center at Tulsa, Sociology. Professional Experience. Principal Positions:
 May 2013 Sheryl L. Skaggs, Ph.D. Curriculum Vitae School of Economic, Political and Policy Sciences Sociology and Public Policy The University of Texas at Dallas 800 W. Campbell Rd., GR 31; Richardson,
Evaluation of Teach For America:
 EA15-536-2 Evaluation of Teach For America: 2014-2015 Department of Evaluation and Assessment Mike Miles Superintendent of Schools This page is intentionally left blank. ii Evaluation of Teach For America:
A. Planning: All field trips being planned must follow the four step planning process. (See attached)
") I. EDUCATIONAL FIELD TRIPS Educational field trips are approved, planned educational activities that involve students in learning experiences difficult to duplicate in a classroom situation. The main criterion
I. EDUCATIONAL FIELD TRIPS Educational field trips are approved, planned educational activities that involve students in learning experiences difficult to duplicate in a classroom situation. The main criterion
Virginia Principles & Practices of Real Estate for Salespersons
 Volume 1: January 2015 Virginia Principles & Practices of Real Estate for Salespersons Please read the catalog in its entirety. To register for the VA Online Pre-Licensing Course click on the link on the
A Comparison of the ERP Offerings of AACSB Accredited Universities Belonging to SAPUA
 Association for Information Systems AIS Electronic Library (AISeL) SAIS 2004 Proceedings Southern (SAIS) 3-1-2004 A Comparison of the ERP Offerings of AACSB Accredited Universities Belonging to SAPUA Ronald
File Print Created 11/17/2017 6:16 PM 1 of 10
 Success - Key Measures Graduation Rate: 4-, 5-, and 6-Year 9. First-time, full-time entering, degree-seeking, students enrolled in a minimum of 12 SCH their first fall semester who have graduated from
FY year and 3-year Cohort Default Rates by State and Level and Control of Institution
 Student Aid Policy Analysis FY2007 2-year and 3-year Cohort Default Rates by State and Level and Control of Institution Mark Kantrowitz Publisher of FinAid.org and FastWeb.com January 5, 2010 EXECUTIVE
Ringer Library Operations Audit
 Ringer Library Operations Audit April 2014 City Internal Auditor s Office City of College Station File#: 13-03 Why We Did This Audit This audit was conducted per direction of the City of College Station
African American Male Achievement Update
 Report from the Department of Research, Evaluation, and Assessment Number 8 January 16, 2009 African American Male Achievement Update AUTHOR: Hope E. White, Ph.D., Program Evaluation Specialist Department
University of Arizona
 Annual Report Submission View Questionnaire (Edit) University of Arizona Annual Report Submission for the year 2009. Report has been submitted 1 times. Report was last submitted on 11/30/2009 7:12:09 PM.
Apply Texas. Tracking Student Progress
 Apply Texas Tracking Student Progress Common Admission Application System Apply Texas (AT) Originally, only for general academic teaching institutions; now, all public higher education institutions must
Guidelines for the Use of the Continuing Education Unit (CEU)
") Guidelines for the Use of the Continuing Education Unit (CEU) The UNC Policy Manual The essential educational mission of the University is augmented through a broad range of activities generally categorized
Guidelines for the Use of the Continuing Education Unit (CEU) The UNC Policy Manual The essential educational mission of the University is augmented through a broad range of activities generally categorized
2 Organizational. The University of Alaska System has six (6) Statewide Offices as displayed in Organizational Chart 2 1 :
 Statewide Offices as displayed in Organizational Chart 2 1 :") 2 Organizational The University of Alaska System has six (6) Statewide Offices as displayed in Organizational Chart 2 1 : Office of the President Office of Academic Affairs and Research Office of Strategy,
2 Organizational The University of Alaska System has six (6) Statewide Offices as displayed in Organizational Chart 2 1 : Office of the President Office of Academic Affairs and Research Office of Strategy,
THE ECONOMIC AND SOCIAL CONTRIBUTION OF THE UNIVERSITY OF NEBRASKA TO THE STATEWIDE ECONOMY
 THE ECONOMIC AND SOCIAL CONTRIBUTION OF THE UNIVERSITY OF NEBRASKA TO THE STATEWIDE ECONOMY JANUARY 2016 THE ECONOMIC AND SOCIAL CONTRIBUTION OF THE UNIVERSITY OF NEBRASKA TO THE STATEWIDE ECONOMY 1 TABLE
TEM. Tribal Energy Management Degree Program San Juan Community College School of Energy
 TEM Tribal Energy Management Degree Program San Juan Community College School of Energy Tribal Energy Management Degree Program A comprehensive degree program targeting Native American students, energy
TABLE OF CONTENTS FOR MEETING OF THE BOARD
 TABLE OF CONTENTS FOR MEETING OF THE BOARD Board Meeting: 11/15-16/2006 Austin, Texas A. Wednesday, November 15, 2006 CONVENE THE BOARD IN OPEN SESSION FOR THE 125 TH ANNIVERSARY CELEBRATION PROGRAM (U.
Shaping the History of Photography
 The Harry Ransom Center presents september 30 october 2, 2010 We are pleased to welcome you to the Ransom Center s ninth biennial Fleur Cowles Flair Symposium. The Flair Symposium, which is generously
Biomedical Sciences. Career Awards for Medical Scientists. Collaborative Research Travel Grants
 Biomedical Sciences Research in the medical sciences provides a firm foundation for improving human health. The Burroughs Wellcome Fund is committed to fostering the development of the next generation