Achievement Highlights
|
|
|
- Karen Francis
- 5 years ago
- Views:
Transcription
 CLASS III Achievement")


1 National Achievement Survey (Cycle 3) CLASS III Achievement Highlights 2014 Educational Survey Division NATIONAL COUNCIL OF EDUCATIONAL RESEARCH AND TRAINING Sri Aurobindo Marg, New Delhi
2 Supported by UNICEF in publication of this report
3 National Achievement Survey (Cycle 3) Class III Achievement Highlights 2014


4 Contents Background Overall Findings Performance in Language i. Average Scores in Language ii. Ability-wise Performance Performance in Mathematics i. Average Scores in Language ii. Ability-wise Performance


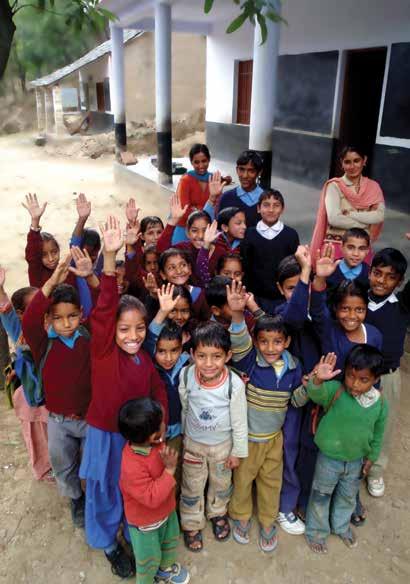
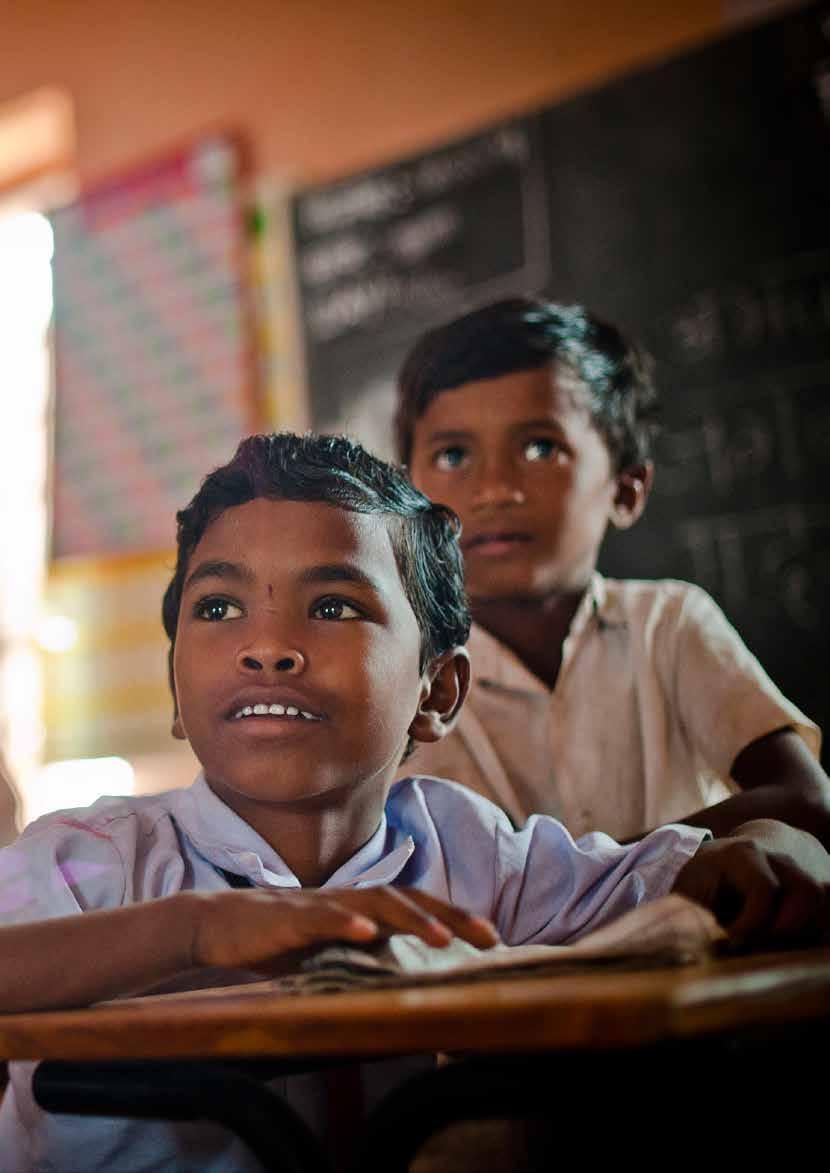
5 UNICEF/INDIA/TOM PIETRASIK Performance: Equity Analysis Distribution and Dispersion of Student Performance Way Forward Appendix: A Note on Methodology
 Act 2009, government is obligated in ensuring eight years of quality education for all children in the age group 6-14 years.")
6 Background Coverage of Class III Cycle 3 study: 34 States/ UTs 298 Districts 7,046 Schools 1,04,374 Students (except Lakshadweep) 1 With the enactment of The Right of Children to Free and Compulsory Education (RTE) Act 2009, government is obligated in ensuring eight years of quality education for all children in the age group 6-14 years. Over the past decade or so since the beginning of the Sarva Shikha Abhiyan (SSA) programme, there has been a significant increase in the number of schools and in the enrolment of children in government schools, most notably a large proportion of children from amongst Scheduled Castes, Scheduled Tribes, Muslims and girls have joined the schooling system. Most of these children are also first-generation learners, coupled with the fact that they also come from very impoverished socio-economic backgrounds, which present unique challenges for the education system to adequately support the diverse learning needs of students. While high enrolment and diverse classrooms are a sign of healthy inclusion and participation in the education system, it is equally important that all children receive a good quality education. One of the key indicators of quality education is to understand whether children s learning achievement is improving over time in an equitable manner. To monitor improvement in children s learning levels and to periodically assess the health of the government education system as a whole, the National Council of Educational Research and Training (NCERT) has been periodically conducting National Achievement Surveys (NAS) since 2001, for Class III, V and VIII. The NAS report gives a national and state-level picture, rather than scores for individual students, schools or districts. The purpose of these assessments is to obtain an overall picture of what students in specific classes know and can do and to use these findings to identify gaps and diagnose areas that need improvement. This information can then be used to impact policies and interventions for improving children s learning under the SSA programme. Who has joined elementary schools in the past 5 years? (Between and ) Total enrolment increased by lakhs, distributed as follows: lakhs 22% lakhs 44% lakhs 9% Boys lakhs 14% lakhs 56% Girls lakhs 55% Gen SC ST OBC.72 lakhs 41% lakhs 59% Muslim Other than Muslim Source: District Information System for Education (DISE), NUEPA, New Delhi
 conducted in 2013.")
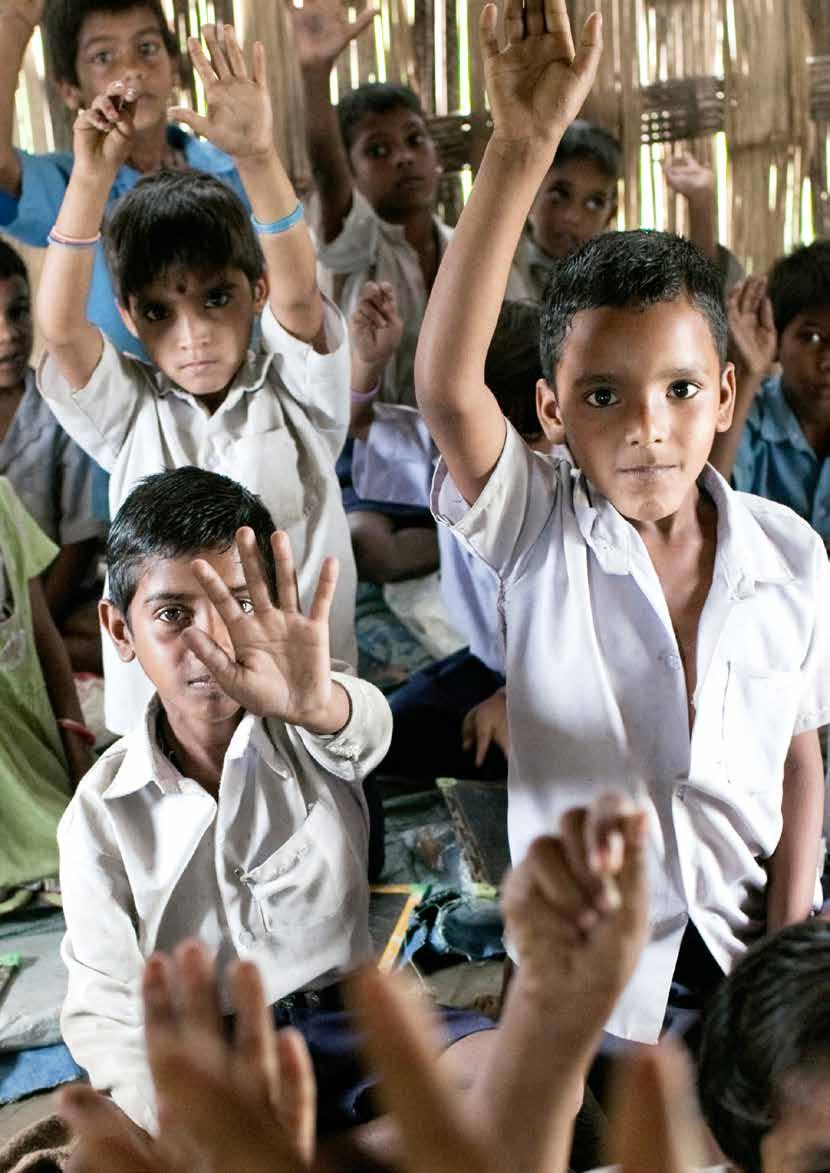
7 UNICEF/INDIA/PABLO BARTHOLOMEW Cycles of National Achievement Surveys conducted under SSA Class III Class V Class VIII Language, Maths Language, Maths, EVS Language, Maths, Social Science, Science This report summarises the findings of the NAS Class III (Cycle 3) conducted in Some important key features of this survey are highlighted below: Key Features of the Class III (Cycle 3) study: Assessed student abilities in Language (listening, recognition of words and reading comprehension) and in Mathematics (numbers, basic operations, measurement, data handling, patterns, money and geometry) For the first time, uses international technique of Item Response Theory (IRT) for Class III assessments, which measures the true ability of students to respond correctly to different levels of difficulty in tests, allows comparison of scores over time and increases the efficiency, accuracy and usefulness of results Conducted tests through child-friendly manner like reading questions aloud so children would feel at ease and answer comfortably Involved rigorous training and monitoring of field investigators to ensure quality of data through standardized test administration Standardized tests were administered in 16 languages of instruction across the country 2

8 Overall Findings 3

9 Overall, Class III children in 34 states/uts were able to answer 64% of language items correctly and 66% of mathematics questions correctly. Performance in Language Performance in Mathematics State/UT Percentage Daman & Diu 74 State/UT Percentage Daman & Diu 77 Dadra & Nagar Haveli 73 Puducherry 75 Mizoram 73 Dadra & Nagar Haveli 74 Puducherry 73 Tamil Nadu 74 Tripura 73 Karnataka 73 Goa 71 Manipur 71 Sikkim 71 Mizoram 71 Tamil Nadu 71 Punjab 71 Karnataka Kerala Kerala Tripura Maharashtra Andhra Pradesh 69 Manipur 69 Gujarat 69 West Bengal 69 Himachal Pradesh 69 Gujarat 67 Maharashtra 69 A & N Islands 66 A & N Islands 68 Himachal Pradesh 65 Sikkim 68 Meghalaya 65 Uttar Pradesh 68 Nagaland 65 West Bengal 67 Andhra Pradesh 64 Assam 66 National Average 64 Goa 66 Assam 63 National Average 66 Punjab 63 Jharkhand 65 Uttar Pradesh 63 Nagaland 65 Odisha 62 Madhya Pradesh 64 Delhi 61 Meghalaya 63 Arunachal Pradesh Delhi 63 Chandigarh 59 Odisha 63 Jharkhand 58 Arunachal Pradesh 62 Madhya Pradesh 58 Haryana 62 Rajasthan 58 Haryana 57 Uttarakhand 57 Jammu and Kashmir 56 Bihar 53 Chhattisgarh 51 Uttarakhand 62 Jammu and Kashmir 61 Rajasthan 61 Chandigarh Bihar 57 Chhattisgarh 53 4 UNICEF/INDIA/Dhiraj Singh

10 Students Performance in Language UNICEF India/2013/Vishwanathan 5

11 The ability to understand a simple text is a skill that is fundamental to learning. Without acquiring basic language skills in the primary classes, children have difficulty succeeding in school as they move on to higher grades, as well as in coping with other subjects. To gauge students language development, students were assessed on their skills in: 1. Listening comprehension (using multiple choice questions based on a passage read aloud by the investigator), 2. Word recognition (by matching the picture provided to the correct word from two given options), 3. Reading comprehension (by being asked to read a calendar/paragraph/advertisement and then locate specific information or draw conclusions) 6 UNICEF/INDIA/Prashanth Vishwanathan
 No.")
12 Average Scores in Language Jammu & Kashmir Himachal Pradesh Punjab Chandigarh Uttarakhand Haryana Delhi Sikkim Arunachal Pradesh 7 Gujarat Diu & Daman Dadra & Nagar Haveli Lakshadweep Goa Rajasthan Meghalaya Jharkhand Madhya Pradesh West Bengal Chhattisgarh Tripura Odisha Maharashtra Kerala Karnataka State's Average is significantly ABOVE the National Average (States/UTs: 14) No. significant difference in average score than National Average (States/UTs: 5) Uttar Pradesh Andhra Pradesh Tamil Nadu Puducherry Bihar State's Average is significantly BELOW the National Average (States/UTs: 15) UT not included in the Report (UT: 1) Assam Andaman & Nicobar Islands UNICEF India/2013/PRASANTH Vishwanathan Mizoram Nagaland Manipur State/UT Average Score Tripura 281 Daman & Diu 280 Puducherry 280 Mizoram 278 Dadra & Nagar Haveli 274 Goa 274 Sikkim 274 Tamil Nadu 274 Kerala 273 Maharashtra 271 West Bengal 271 Karnataka 267 Manipur 267 A & N Islands 262 Gujarat 262 National Average 257 Himachal Pradesh 256 Nagaland 255 Andhra Pradesh 253 Assam 253 Delhi 253 Meghalaya 252 Uttar Pradesh 252 Odisha 250 Punjab 249 Arunachal Pradesh 247 Chandigarh 243 Jharkhand 242 Madhya Pradesh 239 Uttarakhand 239 Haryana 238 Rajasthan 238 Jammu & Kashmir 232 Bihar 227 Chhattisgarh 226

13 The national average score in language is 257, on a scale ranging from 0 to states scored significantly above the national average, of which the high performers were Tripura, Daman & Diu, Puducherry & Mizoram 15 states scored significantly below the national average, of which the low performers were Chhattisgarh, Bihar, Jammu & Kashmir, Rajasthan & Haryana 8 UNICEF India/2013/PRASANTH Vishwanathan
14 0 Ability-wise Performance in Language Listening Word Recognition Overall, 65% of Class III students were able to listen to a passage with understanding Overall, 86% of Class III students were able to recognize words Tripura West Bengal Daman & Diu Mizoram Gujarat Punjab Himachal Pradesh Sikkim Goa Dadra & Nagar Haveli Puducherry Maharashtra Karnakata Kerala Meghalaya Tamil Nadu Uttar Pradesh A&N Islands Delhi Manipur National Average Nagaland Jharkhand Odisha Madhya Pradesh Rajasthan Uttarakhand Haryana Assam Andhra Pradesh Chandigarh Arunachal Pradesh Bihar Chhattisgarh Jammu & Kashmir Mizoram Kerala Tripura Goa Meghalaya West Bengal Punjab Tamil Nadu Himachal Pradesh Daman & Diu Karnakata Puducherry Andhra Pradesh Sikkim A&N Islands Delhi Maharashtra Dadra & Nagar Haveli Nagaland Uttarakhand Jharkhand National Average Manipur Chandigarh Uttar Pradesh Assam Gujarat Madhya Pradesh Arunachal Pradesh Haryana Rajasthan Odisha Chhattisgarh Jammu & Kashmir Bihar Students had to attempt six questions with three options based on the passage read to them by the Field Investigator Students had to match the pictures to the correct word from the given two options 9
15 Reading Comprehension Overall, 59% of Class III students were able to read a passage with understanding Puducherry Dadra & Nagar Haveli Daman & Diu Tamil Nadu Mizoram Goa Tripura Sikkim Kerala Manipur Maharashtra Karnakata West Bengal A&N Islands Gujarat Andhra Pradesh Nagaland Assam Meghalaya National Average Himachal Pradesh Odisha Uttar Pradesh Arunachal Pradesh Punjab Delhi Chandigarh Jammu & Kashmir Madhya Pradesh Jharkhand Rajasthan Haryana Uttarakhand Bihar Chhattisgarh Sample Item: Reading Comprehension Read the following passage and encircle the answers of the questions. You must have seen butterflies. Do you know where a butterfly comes from? The mother butterfly lays an egg on a leaf or plant. A small caterpillar comes out of the egg. The caterpillar eats leaves and grows bigger. Then the caterpillar attaches itself to a leaf and makes a large cocoon. This is a kind of shell that protects it from other animals. Inside the cocoon it grows wings and legs. Finally, the cocoon opens and the new beautiful butterfly comes out. It slowly opens its wings and then it flies away. Cocoon is a kind of 1. Plant. 2. Shell. 3. Butterfly. Sample Item: Word Recognition Look at the pictures and recognise the correct word for the picture. Then encircle the correct answer. 1.Table 2.Chair Percent Correct 50% Percent Correct 85% Students had to locate information, interpret/ grasp ideas and infer/evaluate from the given text 10
16 Students Performance in Mathematics 11


 3.")
 5.")
 7.")
17 In mathematics, key skills to be learnt in early primary grades include knowing and using numbers, learning and understanding the value of numbers, knowing key symbols and comparing and arranging objects. These skills form the foundation for a large set of mathematical operations which students will use in later stages of schooling as well as in real life. To find out about students mathematical development, students were assessed on their skills in: 1. Addition (of two and three digit numbers and simple word problems) 2. Subtraction (of three digit numbers with and without borrowing and simple word problems) 3. Multiplication (of two digit number by a single digit and simple word problems) 4. Division (understanding the meaning of simple division operations) 5. Number placement (recognizing and arranging numbers in a sequence) 6. Geometry (identifying two-dimensional figures) 7. Patterns (identifying simple number patterns) 8. Measurement (comparing length, weight and reading time and calender) 9. Money (addition and subtraction) 10. Data handling (drawing conclusions from data) 12
 No.")
18 Average Scores in Mathematics Jammu & Kashmir 13 Gujarat Diu & Daman Dadra & Nagar Haveli Goa Lakshadweep Rajasthan Himachal Pradesh Punjab Chandigarh Uttarakhand Haryana Delhi Kerala Madhya Pradesh Maharashtra Karnataka State's Average is significantly ABOVE the National Average (States/UTs:14) No. significant difference in average score than National Average (States/UTs: 8) Uttar Pradesh Tamil Nadu Chhattisgarh Andhra Pradesh Meghalaya Jharkhand West Bengal Tripura Odisha Puducherry Bihar Sikkim State's Average is significantly BELOW the National Average (States/UTs: 12) UT not included in the Report (UT: 1) Arunachal Pradesh Assam Andaman & Nicobar Islands Mizoram Nagaland Manipur State/UT Average Score Daman & Diu 279 Puducherry 271 Tamil Nadu 271 Dadra & Nagar Haveli 267 Karnataka 265 Mizoram 265 Kerala 264 Manipur 263 Maharashtra 262 Tripura 262 Andhra Pradesh 259 Himachal Pradesh 258 Punjab 258 Sikkim 257 Uttar Pradesh 257 A & N Islands 255 Gujarat 255 West Bengal 255 National Average 252 Assam 249 Jharkhand 249 Nagaland 249 Goa 248 Arunachal Pradesh 245 Delhi 244 Madhya Pradesh 243 Uttarakhand 243 Meghalaya 241 Odisha 241 Chandigarh 240 Jammu & Kashmir 240 Haryana 238 Rajasthan 236 Bihar 230 Chhattisgarh 222

19 The national average score in mathematics is 252, on a scale ranging from 0 to states scored significantly above the national average, of which the high performance was in Daman & Diu, Tamil Nadu, Puducherry, Karnataka and D&N Haveli 12 states scored significantly below the national average, of which the low performers were Chhattisgarh, Bihar, Rajasthan, Haryana and Jammu & Kashmir 14
20 Ability-wise performance in Mathematics Performance of Students in Addition Performance of Students in Subtraction Overall, 69% of Class III students were able to solve problems based on Addition Overall, 65% of Class III students were able to solve problems based on Subtraction Tripura Daman & Diu Dadra & Nagar Haveli Karnataka Punjab West Bengal Kerala Mizoram Tamil Nadu Himachal Pradesh Gujarat Manipur Goa A&N Islands Andhra Pradesh Puducherry Uttar Pradesh Nagaland National Average Jharkhand Assam Maharashtra Madhya Pradesh Arunachal Pradesh Meghalaya Sikkim Odisha Haryana Delhi Bihar Uttarakhand Chandigarh Jammu & Kashmir Rajasthan Chhattisgarh Karnataka Tripura Dadra & Nagar Haveli Uttar Pradesh Tamil Nadu Mizoram Daman & Diu Punjab Himachal Pradesh Gujarat West Bengal Manipur Madhya Pradesh Puducherry Andhra Pradesh Jharkhand Kerala Assam National Average Maharashtra Sikkim Jammu & Kashmir Haryana Rajasthan A&N Islands Goa Odisha Uttarakhand Bihar Nagaland Meghalaya Delhi Arunachal Pradesh Chandigarh Chhattisgarh Sample Item: Addition Percent Correct 74% Add ? We get : Sample Item: Subtraction Percent Correct 54% Subtract ? We get :
21 Performance of Students in Multiplication Performance of Students in Division Overall, 63% of Class III students were able to solve problems based on Multiplication Overall, 57% of Class III students were able to solve problems based on Division Daman & Diu Dadra & Nagar Haveli Gujarat Uttar Pradesh Puducherry Tamil Nadu Karnataka Himachal Pradesh Andhra Pradesh Jharkhand Punjab Assam Manipur Tripura Delhi Uttarakhand Mizoram National Average Rajasthan A&N Islands Haryana Goa Jammu & Kashmir Maharashtra Odisha Kerala Sikkim Bihar Madhya Pradesh West Bengal Nagaland Chandigarh Meghalaya Arunachal Pradesh Chhattisgarh Daman & Diu Puducherry Dadra & Nagar Haveli Tamil Nadu West Bengal Tripura Manipur Gujarat Uttar Pradesh Karnataka A&N Islands Andhra Pradesh Mizoram Maharashtra Himachal Pradesh Assam Sikkim Meghalaya National Average Jharkhand Uttarakhand Kerala Punjab Madhya Pradesh Odisha Jammu & Kashmir Rajasthan Delhi Haryana Nagaland Goa Bihar Chandigarh Arunachal Pradesh Chhattisgarh Sample Item: Multiplication Percent Correct % Multiply 24 x 5? We get : Sample Item: Division Percent Correct 58% 56 Students form seven equal groups. How many students are in each group? We get :
22 Performance of Students in Place Value Performance of Students in Geometry Overall, 59% of Class III students were able to solve problems based on Place Value Overall, 66% of Class III students were able to solve problems based on Shapes Daman & Diu Dadra & Nagar Haveli Manipur Puducherry Himachal Pradesh Karnakata Tamil Nadu Kerala Andhra Pradesh Gujarat Haryana Madhya Pradesh Uttar Pradesh Meghalaya Goa Punjab Maharashtra Sikkim Assam Mizoram National Average Odisha Jammu & Kashmir Jharkhand Nagaland Uttarakhand Rajasthan Arunachal Pradesh Delhi Chhattisgarh Bihar Chandigarh A&N Islands West Bengal Tripura Puducherry Daman & Diu Karnakata Tamil Nadu Dadra & Nagar Haveli Sikkim Mizoram Goa Punjab Manipur Tripura Kerala Nagaland Maharashtra West Bengal A&N Islands Gujarat Meghalaya National Average Assam Jammu & Kashmir Andhra Pradesh Uttar Pradesh Arunachal Pradesh Himachal Pradesh Odisha Chandigarh Jharkhand Delhi Uttarakhand Rajasthan Haryana Madhya Pradesh Bihar Chhattisgarh Sample Item: Place Value Which is the largest three digit number using 2, 3 and 4 only once? Sample Item: Geometry Which of the following shape is not shown in the figure below? Percent Correct 43% 234 Percent Correct 67% Rectangle 432 Triangle Circle
23 18 UNICEF/INDA /Vishwan
24 Performance of Students in Measurement Performance of Students in Money Overall, 66% of Class III students were able to solve problems related to Measurement Overall, 78% of Class III students were able to solve problems related to Money Puducherry Daman & Diu Tripura Tamil Nadu Karnakata Mizoram West Bengal Sikkim Dadra & Nagar Haveli Maharashtra A&N Islands Punjab Manipur Andhra Pradesh Himachal Pradesh Uttar Pradesh Kerala Nagaland Goa National Average Assam Gujarat Jharkhand Odisha Delhi Rajasthan Arunachal Pradesh Uttarakhand Chandigarh Meghalaya Haryana Madhya Pradesh Jammu & Kashmir Bihar Chhattisgarh Daman & Diu Puducherry Mizoram Tamil Nadu Meghalaya Sikkim Kerala Karnakata Maharashtra Dadra & Nagar Haveli Andhra Pradesh Nagaland Tripura Punjab Chandigarh Manipur A&N Islands Himachal Pradesh West Bengal Arunachal Pradesh Goa National Average Uttar Pradesh Delhi Odisha Gujarat Assam Haryana Madhya Pradesh Rajasthan Uttarakhand Jharkhand Jammu & Kashmir Bihar Chhattisgarh Sample Item: Measurement Percent Correct 85% What is the time by this watch? o clock o clock 12 o clock Sample Item: Money Percent Correct 75% Your mother gave you Rs. 50. She gave the money in three notes. Which of the following shows the notes she gave?
25 Performance of Students in Data Handling Performance of Students in Patterns Overall, 77% of Class III students were able to solve problems on Data Handling Overall, 69% of Class III students were able to solve problems on Patterns Puducherry Karnakata Tamil Nadu Kerala Tripura Punjab Maharashtra Dadra & Nagar Haveli A&N Islands Sikkim Mizoram West Bengal Manipur Daman & Diu Himachal Pradesh Andhra Pradesh Chandigarh Nagaland Goa Meghalaya National Average Gujarat Delhi Arunachal Pradesh Uttar Pradesh Uttarakhand Assam Madhya Pradesh Haryana Jharkhand Odisha Rajasthan Jammu & Kashmir Chhattisgarh Bihar Puducherry A&N Islands Kerala Daman & Diu Dadra & Nagar Haveli Tripura Chandigarh Tamil Nadu Sikkim Andhra Pradesh Arunachal Pradesh West Bengal Karnakata Punjab Mizoram Delhi Maharashtra Manipur Himachal Pradesh Nagaland National Average Gujarat Uttarakhand Goa Uttar Pradesh Assam Jharkhand Madhya Pradesh Jammu & Kashmir Odisha Haryana Rajasthan Meghalaya Chhattisgarh Bihar Sample Item: Data Handling Percent Correct 73% 15 August 22 September 20 October 10 November The chart below shows the Observe the number given number of books sold to class Sample Item: below. What comes after 130? Patterns 3 students. In which month 100, 110, 120, 130,? were the least number of books sold? 66% August November 135 December December Percent Correct

26 Performance: Equity Analysis 21
27 22 UNICEF/INDIA/Lana Slezic
28 Performance by Gender Language Jammu & Kashmir Gujarat Diu & Daman Dadra & Nagar Haveli Himachal Pradesh Chandigarh Punjab Uttarakhand Delhi Rajasthan Haryana Madhya Pradesh Maharashtra Uttar Pradesh Chhattisgarh Bihar Jharkhand Odisha Sikkim Meghalaya West Bengal Tripura Arunachal Pradesh Assam Manipur Mizoram Nagaland Goa Lakshadweep Karnataka Kerala Andhra Pradesh Puducherry Tamil Nadu Andaman & Nicobar Islands Girls students are doing significantly better (States/UTs: 2) Boys students are doing significantly better (State:1) No significant difference between Boys and Girls students (States/UTs: 31) UT not included in the Report (UT:1) State/UT Boys Avg (SE) Girls Avg (SE) A & N Islands 261 (3.0) 264 (3.6) Andhra Pradesh 252 (2.9) 255 (2.7) Arunachal Pradesh 247 (2.9) 247 (3.9) Assam 254 (2.4) 251 (2.1) Bihar 228 (2.8) 227 (2.6) Chandigarh 241 (3.1) 245 (2.8) Chhattisgarh 228 (3.1) 225 (2.2) D & N Haveli 272 (3.7) 277 (3.1) Daman & Diu 278 (10.0) 281 (12.0) Delhi 250 (2.9) 256 (4.2) Goa 272 (3.3) 276 (3.2) Gujarat 261 (2.2) 263 (2.6) Haryana 238 (3.4) 237 (2.5) Himachal Pradesh 253 (2.5) 259 (2.6) Jammu & Kashmir 231 (2.5) 233 (2.8) Jharkhand 241 (3.2) 243 (2.9) Karnataka 268 (3.3) 266 (3.3) State/UT Boys Avg (SE) Girls Avg (SE) Kerala 268 (2.1) 277 (2.6) Madhya Pradesh 243 (2.5) 234 (2.5) Maharashtra 2 (2.2) 273 (3.5) Manipur 266 (4.1) 267 (3.9) Meghalaya 251 (2.3) 253 (2.4) Mizoram 278 (2.6) 277 (2.5) Nagaland 251 (3.2) 257 (4.0) Odisha 250 (2.5) 250 (2.4) Puducherry 274 (3.6) 285 (3.0) Punjab 248 (2.1) 250 (2.7) Rajasthan 240 (2.8) 237 (2.8) Sikkim 273 (2.5) 275 (2.5) Tamil Nadu 272 (3.0) 277 (3.4) Tripura 282 (2.6) 281 (2.7) Uttar Pradesh 255 (2.5) 249 (2.6) Uttarakhand 239 (4.1) 239 (3.4) West Bengal 272 (3.1) 2 (3.2) No significant difference between performance of boys and girls in language, except for Madhya Pradesh (boys higher), Kerala & Puducherry (girls higher) National Average Boys: 256 (0.6) Girls: 258 (0.6) 23 Note: Standard Error has been given in parenthesis
29 Performance by Gender Mathematics Jammu & Kashmir Rajasthan Gujarat Diu & Daman Dadra & Nagar Haveli Himachal Pradesh Punjab Chandigarh Uttarakhand Haryana Delhi Maharashtra Uttar Pradesh Madhya Pradesh Chhattisgarh Bihar Jharkhand Odisha Sikkim Meghalaya Assam West Bengal Tripura Arunachal Pradesh Manipur Mizoram Nagaland Goa Lakshadweep Andhra Pradesh Karnataka Puducherry Tamil Nadu Kerala Andaman & Nicobar Islands Girls students are doing significantly better (State:1) Boys students are doing significantly better (States/UTs: None) No significant difference between Boys and Girls students (States/UTs: 33) UT not included in the Report (UT: 1) State/UT Boys Avg (SE) Girls Avg (SE) A & N Islands 254 (3.0) 257 (3.4) Andhra Pradesh 2 (2.8) 259 (2.3) Arunachal Pradesh 245 (3.1) 245 (3.0) Assam 249 (2.5) 249 (2.7) Bihar 231 (3.4) 230 (3.7) Chandigarh 241 (3.1) 239 (3.0) Chhattisgarh 223 (2.3) 221 (3.8) D & N Haveli 266 (3.0) 268 (2.5) Daman & Diu 278 (6.8) 279 (4.6) Delhi 245 (4.3) 244 (3.4) Goa 247 (3.1) 249 (3.0) Gujarat 255 (2.4) 254 (3.1) Haryana 242 (2.8) 235 (3.2) Himachal Pradesh 258 (3.3) 259 (2.7) Jammu & Kashmir 240 (3.2) 241 (3.0) Jharkhand 247 (3.4) 251 (3.2) Karnataka 265 (2.6) 265 (3.1) State/UT Boys Avg (SE) Girls Avg (SE) Kerala 261 (2.2) 268 (1.9) Madhya Pradesh 246 (2.6) 241 (3.4) Maharashtra 262 (2.0) 262 (3.6) Manipur 261 (3.1) 264 (3.3) Meghalaya 243 (2.3) 240 (1.9) Mizoram 266 (2.5) 264 (2.5) Nagaland 249 (3.1) 248 (4.0) Odisha 242 (3.1) 240 (2.7) Puducherry 268 (3.0) 275 (2.5) Punjab 257 (2.7) 2 (2.4) Rajasthan 236 (3.2) 235 (2.6) Sikkim 258 (2.5) 256 (2.5) Tamil Nadu 271 (3.2) 2 (3.8) Tripura 263 (2.4) 2 (3.5) Uttar Pradesh 259 (2.5) 256 (2.8) Uttarakhand 247 (4.5) 240 (3.7) West Bengal 256 (2.9) 255 (3.1) No significant difference between the performance of boys and girls in mathematics, except for Kerala (girls higher) National Average Boys: 253 (0.5) Girls: 252 (0.5) Note: Standard Error has been given in parenthesis 24
30 Performance by Rural-Urban Language Jammu & Kashmir Gujarat Diu & Daman Dadra & Nagar Haveli Himachal Pradesh Punjab Chandigarh Uttarakhand Haryana Delhi Rajasthan Uttar Pradesh Madhya Pradesh Maharashtra Chhattisgarh Bihar Jharkhand Odisha Sikkim Meghalaya West Bengal Tripura Arunachal Pradesh Assam Mizoram Nagaland Manipur Goa Lakshadweep Andhra Pradesh Karnataka Puducherry Tamil Nadu Kerala Andaman & Nicobar Islands Rural students are doing significantly better (States/UTs: 2) Urban students are doing significantly better (States/UTs: 7) No significant difference between Rural and Urban students (States/UTs: 25) UT not included in the Report (UT:1) State/UT Rural (SE) Urban (SE) A & N Islands 263 (3.0) 262 (7.6) Andhra Pradesh 252 (2.5) 264 (6.4) Arunachal Pradesh 245 (2.9) 254 (9.0) Assam 253 (2.1) 251 (8.2) Bihar 227 (2.5) 235 (10.2) Chandigarh 246 (6.0) 243 (3.0) Chhattisgarh 226 (2.5) 230 (6.8) D & N Haveli 277 (2.7) 251 (12.6) Daman & Diu 273 (7.5) 309 (13.4) Delhi 252 (4.9) 254 (3.0) Goa 273 (3.6) 275 (3.6) Gujarat 262 (2.1) 263 (7.0) Haryana 235 (2.5) 252 (6.1) Himachal Pradesh 256 (2.1) 257 (10.0) Jammu & Kashmir 231 (2.7) 258 (5.7) Jharkhand 241 (3.0) 259 (7.6) Karnataka 267 (3.5) 264 (4.8) State/UT Rural (SE) Urban (SE) Kerala 272 (2.3) 277 (4.3) Madhya Pradesh 238 (2.1) 246 (8.8) Maharashtra 273 (3.0) 264 (3.6) Manipur 265 (3.8) 278 (14.2) Meghalaya 253 (2.1) 250 (5.4) Mizoram 274 (2.5) 289 (4.9) Nagaland 256 (3.0) 249 (13.2) Odisha 250 (2.1) 246 (6.4) Puducherry 278 (4.3) 281 (3.8) Punjab 247 (2.3) 256 (5.8) Rajasthan 238 (2.4) 240 (12.3) Sikkim 275 (2.4) 254 (13.9) Tamil Nadu 275 (3.5) 272 (5.0) Tripura 280 (2.5) 290 (3.8) Uttar Pradesh 251 (2.4) 261 (8.9) Uttarakhand 241 (3.8) 229 (6.2) West Bengal 267 (3.4) 285 (3.9) No significant difference in the performance of rural and urban students in language, except for Maharashtra and Dadra and Nagar Haveli (rural higher) and Jammu & Kashmir, Jharkhand, Mizoram, Tripura and Daman & Diu (urban higher) National Average Rural: 256 (0.6) Urban: 2 (1.4) 25 Note: Standard Error has been given in parenthesis
31 Performance by Rural-Urban Mathematics Jammu & Kashmir Gujarat Diu & Daman Dadra & Nagar Haveli Goa Lakshadweep Himachal Pradesh Punjab Chandigarh Uttarakhand Haryana Delhi Rajasthan Maharashtra Kerala Madhya Pradesh Karnataka Tamil Nadu Uttar Pradesh Chhattisgarh Andhra Pradesh Puducherry Bihar Odisha Jharkhand Sikkim Meghalaya West Bengal Tripura Arunachal Pradesh Assam Andaman & Nicobar Islands Manipur Mizoram Nagaland Rural students are doing significantly better (States/UTs: 2) Urban students are doing significantly better (States/UTs: 5) No significant difference between Rural and Urban students (States/UTs: 27) UT not included in the Report (UT: 1) State/UT Rural (SE) Urban (SE) A & N Islands 258 (3.1) 246 (7.5) Andhra Pradesh 259 (2.2) 2 (7.2) Arunachal Pradesh 243 (2.7) 253 (8.0) Assam 249 (2.4) 253 (9.2) Bihar 230 (3.4) 246 (9.6) Chandigarh 244 (8.8) 239 (3.1) Chhattisgarh 222 (2.6) 214 (7.0) D & N Haveli 268 (2.1) 262 (12.7) Daman & Diu 273 (3.9) 308 (5.8) Delhi 244 (5.8) 244 (3.1) Goa 249 (3.5) 248 (4.0) Gujarat 255 (2.4) 253 (7.6) Haryana 237 (3.5) 243 (8.9) Himachal Pradesh 259 (2.8) 243 (13.2) Jammu & Kashmir 240 (2.9) 250 (3.0) Jharkhand 248 (3.3) 252 (8.7) Karnataka 267 (3.0) 259 (4.5) State/UT Rural (SE) Urban (SE) Kerala 262 (2.0) 273 (4.9) Madhya Pradesh 242 (2.7) 255 (5.1) Maharashtra 266 (2.8) 248 (3.8) Manipur 264 (3.1) 2 (6.7) Meghalaya 242 (2.1) 236 (5.0) Mizoram 264 (2.6) 2 (3.9) Nagaland 253 (3.3) 228 (10.6) Odisha 241 (2.8) 243 (8.3) Puducherry 2 (4.2) 273 (2.6) Punjab 256 (2.6) 268 (4.3) Rajasthan 235 (2.4) 239 (13.8) Sikkim 258 (2.4) 241 (17.0) Tamil Nadu 271 (4.0) 268 (5.2) Tripura 2 (3.1) 271 (5.2) Uttar Pradesh 258 (2.5) 254 (8.6) Uttarakhand 245 (3.9) 234 (7.2) West Bengal 254 (3.2) 2 (4.9) No significant difference between rural and urban children s performance in mathematics in 27 states/uts National Average Rural: 252 (0.6) Urban: 253 (1.3) Note: Standard Error has been given in parenthesis 26
32 Performance by Social Group Language Mathematics National Average SC ST OBC 240 National Average SC ST OBC State/UT SC ST OBC Others Andhra Pradesh Arunachal Pradesh 251 (3.0) 251 (6.8) 254 (3.3) 261 (4.8) 285 (7.1) 249 (4.1) 253 (6.4) 239 (3.5) Assam 252 (5.8) 2 (4.9) 253 (4.0) 251 (2.0) Bihar 228 (4.0) 232 (7.9) 226 (2.6) 228 (5.6) Chhattisgarh 216 (2.9) 226 (4.0) 228 (3.2) 247 (6.9) Delhi 249 (3.7) 234 (12.4) 250 (8.6) 255 (3.0) Goa 268 (5.0) 273 (5.7) 284 (5.0) 273 (3.2) Gujarat 262 (4.0) 263 (4.3) 262 (2.3) 262 (4.1) Haryana 237 (3.1) 239 (9.9) 238 (3.4) 238 (4.0) Himachal Pradesh Jammu & Kashmir 251 (3.0) 263 (3.7) 262 (4.9) 256 (3.0) 236 (6.7) 223 (6.6) 235 (7.1) 234 (3.3) Jharkhand 243 (4.5) 236 (6.3) 246 (3.1) 244 (7.6) Karnakata 268 (4.8) 266 (6.4) 264 (3.6) 272 (4.2) Kerala 267 (3.1) 266 (11.6) 273 (2.7) 274 (3.0) Madhya Pradesh 240 (4.1) 233 (3.5) 241 (2.5) 246 (4.5) Maharashtra 265 (3.2) 271 (7.0) 273 (3.3) 272 (2.8) Manipur 289 (19.2) 2 (5.2) 267 (5.1) 292 (14.2) Meghalaya 224 (5.2) 252 (2.0) 266 (8.6) 297 (17.6) Mizoram 258 (10.9) 279 (2.6) 275 (5.6) 268 (0.7) Nagaland 266 (13.3) 252 (4.0) 256 (5.0) 272 (6.0) Odisha 242 (4.6) 241 (3.2) 258 (2.9) 2 (5.8) Punjab 247 (2.4) 275 (13.8) 252 (2.7) 254 (3.6) Rajasthan 243 (4.5) 229 (4.8) 242 (3.3) 232 (4.0) Sikkim 264 (4.6) 273 (2.9) 277 (2.8) 274 (4.7) Tamil Nadu 275 (4.7) 283 (2.6) 273 (3.6) 276 (6.8) Tripura 278 (4.2) 279 (3.7) 283 (2.9) 285 (4.5) Uttar Pradesh 249 (3.1) 249 (10.9) 252 (3.0) 257 (3.5) Uttarakhand 237 (4.3) 247 (12.3) 238 (4.2) 240 (5.7) West Bengal 267 (5.1) 265 (10.3) 278 (5.6) 273 (3.1) A&N Islands 292 (8.2) 235 (8.2) 265 (4.7) 266 (3.4) Chandigarh 245 (3.7) 197 (16.3) 254 (10.7) 243 (2.8) Puducherry 278 (3.6) 311 (19.7) 279 (3.5) 282 (5.8) Dadra & Nagar Haveli 265 (16.1) 278 (2.7) 267 (10.0) 250 (12.9) Daman & Diu 2 (17.0) 2 (7.9) 288 (8.5) 281 (21.7) National Average (Social Group) 256 (1.3) 255 (1.4) 259 (0.9) 261 (1.2) State/UT SC ST OBC Others Andhra Pradesh Arunachal Pradesh 2 (3.3) 256 (6.4) 258 (3.0) 262 (4.7) 254 (22.5) 247 (4.0) 253 (9.7) 238 (3.3) Assam 246 (6.0) 249 (5.1) 245 (5.1) 252 (2.6) Bihar 232 (4.4) 226 (14.8) 231 (3.7) 226 (5.8) Chhattisgarh 211 (3.8) 219 (4.8) 226 (3.9) 240 (9.0) Delhi 235 (4.9) 221 (15.6) 239 (6.5) 247 (2.9) Goa 244 (9.2) 254 (5.2) 252 (4.4) 247 (3.2) Gujarat 255 (4.1) 254 (4.1) 253 (2.5) 265 (5.4) Haryana 237 (3.9) 206 (26.5) 239 (3.2) 242 (5.3) Himachal Pradesh Jammu & Kashmir 251 (4.2) 264 (6.0) 268 (4.1) 2 (3.7) 242 (8.9) 227 (6.2) 244 (5.8) 243 (3.5) Jharkhand 254 (4.8) 246 (6.9) 252 (3.2) 233 (6.2) Karnakata 265 (3.9) 267 (4.8) 263 (3.3) 268 (3.8) Kerala 261 (3.4) 248 (12.7) 265 (2.0) 266 (3.8) Madhya Pradesh 245 (4.2) 236 (3.1) 247 (2.7) 258 (5.9) Maharashtra 255 (3.1) 269 (6.5) 261 (3.9) 262 (2.5) Manipur 246 (22.3) 259 (3.8) 267 (5.7) 272 (6.9) Meghalaya 232 (6.9) 243 (1.8) 232 (8.0) 265 (36.3) Mizoram 265 (7.7) 265 (2.5) 268 (8.8) 238 (1.9) Nagaland 262 (17.8) 247 (4.0) 253 (6.4) 250 (4.2) Odisha 240 (4.3) 230 (4.7) 248 (3.1) 255 (5.4) Punjab 256 (2.6) 295 (11.8) 2 (3.2) 264 (3.7) Rajasthan 241 (3.9) 229 (5.9) 238 (3.2) 227 (4.9) Sikkim 245 (4.3) 256 (3.1) 261 (2.6) 257 (4.6) Tamil Nadu 268 (3.7) 289 (8.8) 2 (4.1) 271 (7.2) Tripura 258 (4.3) 257 (5.5) 266 (3.1) 265 (3.4) Uttar Pradesh 256 (3.1) 255 (6.9) 255 (2.7) 266 (4.6) Uttarakhand 243 (4.9) 250 (16.2) 237 (5.1) 246 (6.0) West Bengal 255 (5.0) 237 (6.0) 262 (3.7) 256 (3.1) A&N Islands 267 (15.4) 235 (9.8) 2 (4.1) 257 (3.4) Chandigarh 241 (3.4) 220 (13.7) 248 (6.4) 240 (3.0) Puducherry 267 (4.0) 297 (6.3) 271 (2.8) 280 (5.8) Dadra & Nagar Haveli 272 (12.3) 2 (2.3) 261 (7.9) 248 (8.8) Daman & Diu 282 (8.9) 268 (9.3) 281 (6.2) 282 (9.9) National Average (Social Group) 251 (1.5) 250 (1.6) 254 (0.8) 254 (1.4) 27 Note: Standard Error has been given in parenthesis
33 Performance of Scheduled Caste (SC) Students in Language and Mathematics (13 states where SC population is above national average of 16.63% * ) State/UT % of SC Population* Language Mathematics Chandigarh Delhi Haryana Himachal Pradesh Karnataka Odisha Punjab Rajasthan Tamil Nadu Tripura Uttar Pradesh Uttarakhand West Bengal National Average Below national average (SC) Equal or more than national average (SC) In Karnataka, Tamil Nadu, Tripura and West Bengal, students performance in language and mathematics is more than the national average In Chandigarh, Delhi, Haryana, Odisha, Rajasthan and Uttarakhand, students performance in language and mathematics is less than the national average In Himachal Pradesh, Punjab and Uttar Pradesh, students performance is lower than the national average in language, but higher than the national average in mathematics Performance of Scheduled Tribe (ST) Students in Language and Mathematics (18 states where ST population is above national average of 8.61% * ) State/UT % of ST Population* Language Mathematics Arunachal Pradesh Assam Chhattisgarh D & N Haveli Goa Gujarat Jammu & Kashmir Jharkhand Madhya Pradesh Maharashtra Manipur Meghalaya Mizoram Nagaland Odisha Rajasthan Sikkim Tripura National Average Below national average (ST) Equal or more than national average (ST) In Dadra & Nagar Haveli, Goa, Gujarat, Maharashtra, Manipur, Mizoram, Sikkim and Tripura, students performance is more than the national average in both language and mathematics In Arunachal Pradesh, Chhattisgarh, Jammu and Kashmir, Jharkhand, Madhya Pradesh, Meghalaya, Nagaland, Odisha and Rajasthan, students performance is less than the national average in both language and mathematics Performance of students in Assam is lower than the national average in mathematics but higher than the national average in language * Source: Primary Census Abstract for Total population, Scheduled Castes and Scheduled Tribes, 2011, Office of the Registrar General & Census Commissioner, India 28

34 Distribution of Students by Performance (Percent Correct Answers) 29
35 30 UNICEF/INDIA/2013/Ferguson
36 Distribution of students by correct responses Language (Percent students) Mathematics (Percent students) % 36-50% % 36-50% % Above 75% % Above 75% About 30% students answered more than 75% 39% students answered more than 75% questions correctly, while only 10% students questions correctly, while only 9% students were below 35% answered below 35% 31 Range of correct answers (Language) State/UT 0-35% 36-50% 51-75% Above 75% A&N Islands Andhra Pradesh Arunachal Pradesh Assam Bihar Chandigarh Chhattisgarh Dadra & Nagar Haveli Daman & Diu Delhi Goa Gujarat Haryana Himachal Pradesh Jammu & Kashmir Jharkhand Karnakata Kerala Madhya Pradesh Maharashtra Manipur Meghalaya Mizoram Nagaland Odisha Puducherry Punjab Rajasthan Sikkim Tamil Nadu Tripura Uttar Pradesh Uttarakhand West Bengal National Average Range of correct answers (Mathematics) State/UT 0-35% 36-50% 51-75% Above 75% A&N Islands Andhra Pradesh Arunachal Pradesh Assam Bihar Chandigarh Chhattisgarh Dadra & Nagar Haveli Daman & Diu Delhi Goa Gujarat Haryana Himachal Pradesh Jammu & Kashmir Jharkhand Karnakata Kerala Madhya Pradesh Maharashtra Manipur Meghalaya Mizoram Nagaland Odisha Puducherry Punjab Rajasthan Sikkim Tamil Nadu Tripura Uttar Pradesh Uttarakhand West Bengal National Average

37 Language Mathematics In 15 states/uts more than 30% students were in the 75% and above range The majority of students scored between 51-75% in language In 13 states more than 10% students were in 0-35% range The percentage of students who scored below 35% marks in language is highest in Bihar and Chhattisgarh In 17 states/uts more than 40% students were in 75% and above range Nearly 24% students obtained less than 50% marks in Mathematics In Bihar and Chhattisgarh, about 23% students scored less than 35%, whereas in Puducherry and Daman & Diu less than 2% students secured below 35% in Mathematics In Karnataka, Maharashtra, Mizoram, Punjab, Sikkim, Tamil Nadu and Tripura less than 5% students were in 0-35% range 32 UNICEF/INDIA/2010
38 Percentile Scores in Language State/UTs 10 th percentile 25 th percentile 50 th percentile 75 th percentile 90 th percentile Range A & N Islands Andhra Pradesh Arunachal Pradesh Assam Bihar Chandigarh Chhattisgarh Dadra & Nagar Haveli Daman & Diu Delhi Goa Gujarat Haryana Himachal Pradesh Jammu & Kashmir Jharkhand Karnataka Kerala Madhya Pradesh Maharashtra Manipur Meghalaya Mizoram Nagaland Odisha Puducherry Punjab Rajasthan Sikkim Tamil Nadu Tripura Uttar Pradesh Uttarakhand West Bengal National Note : Ranges may not agree due to rounding. Range In States like Tripura, Meghalaya, Assam, Madhya Pradesh and Mizoram, the student scores in language are more concentrated over a narrow range, i.e. the performance of different students within the states is more homogenous In states like Manipur, Bihar, Odisha, Kerala and Arunachal Pradesh, the language scores are more widely spread out, i.e. the performance of different students within the states is more heterogeneous 33 Percentile Scores It is the score on a test below which a given percentage of student scores fall. In order to give information about the performance of low, middle and high performing students, results are computed at five key percentile points (10th, 25th, 50th, 75th and 90th).
39 Percentile Scores in Mathematics State/UTs 10 th percentile 25 th percentile 50 th percentile 75 th percentile 90 th percentile Range A & N Islands Andhra Pradesh Arunachal Pradesh Assam Bihar Chandigarh Chhattisgarh Dadra & Nagar Haveli Daman & Diu Delhi Goa Gujarat Haryana Himachal Pradesh Jammu & Kashmir Jharkhand Karnataka Kerala Madhya Pradesh Maharashtra Manipur Meghalaya Mizoram Nagaland Odisha Puducherry Punjab Rajasthan Sikkim Tamil Nadu Tripura Uttar Pradesh Uttarakhand West Bengal National Note : Ranges may not agree due to rounding. Range In States/UTs like Dadra & Nagar Haveli, Daman & Diu, Puducherry and Tripura student scores in mathematics are more concentrated over a narrow range, i.e. the performance of different students within the states is more homogenous In states like Bihar, Himachal Pradesh, Manipur, Uttar Pradesh and Jharkhand, the mathematics scores are more widely spread out, i.e. the performance of different students within the states is more heterogeneous 34

40 Way Forward UNICEF/INDIA 35
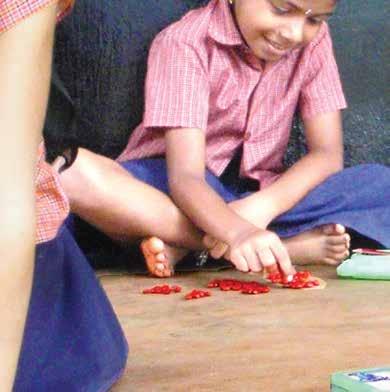
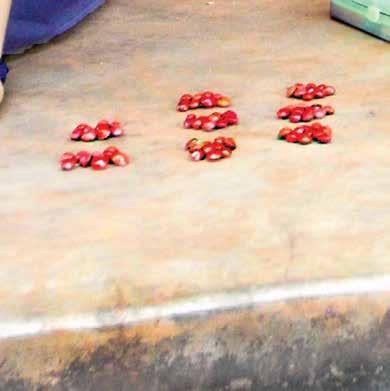
41 Learning in early primary grades lays the foundation for effective learning in one s life. The NAS Class III (Cycle 3) reveals that the average score of children is 64% and 66% in Language and Mathematics respectively and more than two-thirds of children are scoring above 50%. However, improvement is needed especially in abilities such as listening and reading with comprehension, as well as understanding place value, subtraction and division. Large-scale assessments by themselves cannot result in quality improvement, unless the system is ready to reflect on the findings and use them for improving the quality of teaching and learning processes. Thus each state needs to carefully analyse the current learning levels of their children and understand the gap areas as well as the reasons for low learning. This information could then be used to redesign interventions such as teacher training, curriculum and textbook design and on-site teacher support, so as to improve children s learning. This also has implications for performance of schools, their monitoring and the roles and responsibilities of teacher/school/ support institutions like BRCs/DIETs/SCERTs. It is also important to disseminate the NAS findings in an easily understandable manner and to discuss them with all relevant stakeholders, especially teachers, teacher support institutions and educational functionaries, to build their capacity to understand and reflect on the findings and take appropriate action thereafter. The purpose of such large-scale assessments will only be fulfilled when the findings reach back to the classroom and result in improvement in children s learning. There are various things that teachers can do at their level, in light of the findings of the NAS study. The study reveals that in Language, children are performing relatively better in word recognition but are facing difficulty when it comes to listening and reading with understanding and answering questions related to the text. Thus, teachers could provide more opportunities during the teaching-learning process for children to both read and listen to a wide variety of reading materials. Children should then be given the opportunity to explain the meaning of the text in their own words, discuss with their peers, ask questions, express the meaning creatively through drawing or acting out, etc. Similarly in mathematics, children seem to be doing quite well on practical application questions related to money and data handling, but seem to be struggling with topics like place value, subtraction and division. Perhaps teachers can spend more time in relating these concepts to practical examples from children s everyday lives and surroundings and use locally available materials such as sticks, stones, beans to help children understand better abstract concepts of addition, subtraction, division etc. Ultimately, it would be most useful if teachers themselves can regularly assess their own students and identify which children require additional support on specific topics. Such simple efforts by teachers would have a huge impact in enhancing children s learning. While NAS provides a broad snapshot of national and state-level trends, states are encouraged to undertake state-specific large-scale assessments in order to obtain a more nuanced picture of how specific districts and blocks are performing. This would help to design appropriate interventions to improve children s learning. Tracking improvements in learning over time can help assess the impact of specific quality-related interventions and help policy and decision makers to take evidence-based decisions. 36
42 Appendix: A Note on Methodology In the year 2000, the programme of National Achievement Surveys (NAS), originally conceived by NCERT as an independent project, was incorporated into the Government s flagship project Sarva Shiksha Abhiyan. NCERT is responsible for planning, developing tools, conducting the surveys and reporting the results under SSA by the Ministry of Human Resource Development (MHRD). NAS Class III (Cycle-3) is the latest survey in which information was gathered from a sample comprising 1,04,374 students in 7,046 schools across 34 States and Union Territories (UTs). The subjects covered were Language and Mathematics. Introduction of Best Practices in Assessment In NAS Cycle 3, an approach known as Item Response Theory (IRT) was used, in addition to the classical approach. In classical approach, also known as Classical Test Theory (CTT) the outcomes are reported simply as the proportion or percentage of correct answers. IRT has been used keeping in line with the best practice of major international surveys such as Programme for International Student Assessment (PISA), Progress in International Reading Literacy Study (PIRLS) and Trends in International Mathematics and Science Studies (TIMSS). IRT uses mathematical models that assume a statistical connection between the difficulty level of the test item, the ability of the student and the probability of that student being successful on a particular item. For example, students with higher ability scores are more likely to succeed on any item than their peers of lower ability. IRT has many advantages over the classical test theory such as : IRT measures the true ability of students regardless of different levels of difficulty of tests, by calculating the probability of a student to respond to an item correctly. IRT analysis places students and test items on the same numerical scale. It provides us to create meaningful maps of item difficulty and student ability. In IRT, the difficulty parameter for an item does not depend on the group of test takers. In IRT multiple test booklets may be used to increase measurement points in any subject and these can also be linked. IRT make it possible to compare scores from tests used in different NAS cycles or state test scores over time, which may help in monitoring progress in the system over time. When IRT is used appropriately, it can increase the efficiency, accuracy or usefulness of a wide variety of measurement processes. 37
43 Another important point of deviation from the previous two surveys was related to test construction and administration. It was felt that since Class III children are too young to read questions on their own and respond the MCQs on their own, it does not indicate a true measure of their ability. Therefore, an element of scaffolding was introduced where-in the field administrator read out the MCQ items loud to the child. The element of scaffolding introduced was standardized to reduce inter variability amongst the field investigators. Achievement tests were designed to assess the core contents of curricular areas which required a large number of items to be tested. At the same time, assigning a large number of items to each student may affect the quality of their responses. For this purpose, multiple booklets having common/anchor items were developed, which could then be linked together. It helps in limiting the number of items administered to each student. Development of Tools For collecting the information for the survey, subject tests and three questionnaires were developed. Questionnaires For this survey, three questionnaires were developed to collect information on a) schools, b) teachers and c) pupils and their backgrounds. Tests For any large survey, the tools employed need to be simple, understandable, valid and reliable. The first exercise, hence, was to collect the syllabi and the textbooks of Language and Mathematics from all the states/uts. These were then analysed from the point of view of the content areas covered and abilities acquired. The common core content was identified for developing the tests. Based on the analysis, assessment frameworks were developed in both subjects. The frameworks described the content areas and abilities covered in the tests, the number and type of items used for testing and other details of the exercise. Development of subject-specific tools In language, listening, recognition of the correct word for picture and reading comprehension abilities were tested. The work for the test development was guided by the framework developed for the language test. For development of the tests, two sub-groups were formed, one for English and the other for Hindi. Thus two master copies were prepared which were then translated to 16 languages. For generating items, examples from various sources including National Assessment of Educational Progress (NAEP) and Early Grade Reading Assessment (EGRA) were referred. The items developed were piloted to ensure 38
[For Admission Test to VI Class] Based on N.C.E.R.T. Pattern. By J. N. Sharma & T. S. Jain UPKAR PRAKASHAN, AGRA 2
![[For Admission Test to VI Class] Based on N.C.E.R.T. Pattern. By J. N. Sharma & T. S. Jain UPKAR PRAKASHAN, AGRA 2](/thumbs/71/65941921.jpg "[For Admission Test to VI Class] Based on N.C.E.R.T. Pattern. By J. N. Sharma & T. S. Jain UPKAR PRAKASHAN, AGRA 2") [For Admission Test to VI Class] Based on N.C.E.R.T. Pattern By J. N. Sharma & T. S. Jain 2015 UPKAR PRAKASHAN, AGRA 2 Publishers Dedicated to His Holiness Shri Nantin Maharaj Shyam Khet Nainital Hindi
[For Admission Test to VI Class] Based on N.C.E.R.T. Pattern By J. N. Sharma & T. S. Jain 2015 UPKAR PRAKASHAN, AGRA 2 Publishers Dedicated to His Holiness Shri Nantin Maharaj Shyam Khet Nainital Hindi
According to the Census of India, rural
 AAJEEVIKA-A FRESH LEASE OF LIFE FOR THE RURAL PEOPLE Dr. Mukesh Kumar Shrivastava According to the Census of India, rural population constitutes 68.84 percent of the total population of the country. Though,
NAVODAYA VIDYALAYA SAMITI PROSPECTUS FOR JAWAHAR NAVODAYA VIDYALAYA SELECTION TEST- 2014
 NAVODAYA VIDYALAYA SAMITI PROSPECTUS FOR JAWAHAR NAVODAYA VIDYALAYA SELECTION TEST- 2014 1. NAVODAYA VIDYALAYA SCHEME 1.1 Introduction In accordance with the National Policy of Education (1986) Government
NAVODAYA VIDYALAYA SAMITI PROSPECTUS FOR JAWAHAR NAVODAYA VIDYALAYA SELECTION TEST- 2016
 NAVODAYA VIDYALAYA SAMITI PROSPECTUS FOR JAWAHAR NAVODAYA VIDYALAYA SELECTION TEST- 2016 1. NAVODAYA VIDYALAYA SCHEME 1.1 Introduction In accordance with the National Policy of Education (1986) Government
National rural Health mission Ministry of Health and Family Welfare government of India, new delhi
 National rural Health mission Ministry of Health and Family Welfare government of India, new delhi Update on the ASHA Programme July 2011 C ontents Introduction... 1 1. Findings of the Recent Evaluations...
JOIN INDIAN COAST GUARD
 1 JOIN INDIAN COAST GUARD (MINISTRY OF DEFENCE) AS NAVIK (DOMESTIC BRANCH) 10 th ENTRY - 01/2018 BATCH APPLICATION WILL BE ACCEPTED ONLINE FROM 16 TO 23 OCT 2017 1. Applications are invited from Indian
NAVODAYA VIDYALAYA SAMITI PROSPECTUS FOR JAWAHAR NAVODAYA VIDYALAYA SELECTION TEST- 2018
 NAVODAYA VIDYALAYA SAMITI PROSPECTUS FOR JAWAHAR NAVODAYA VIDYALAYA SELECTION TEST- 2018 1. NAVODAYA VIDYALAYA SCHEME 1.1 Introduction In accordance with the National Policy of Education (1986) Government
NAVODAYA VIDYALAYA SAMITI PROSPECTUS FOR JAWAHAR NAVODAYA VIDYALAYA SELECTION TEST- 2015
 NAVODAYA VIDYALAYA SAMITI PROSPECTUS FOR JAWAHAR NAVODAYA VIDYALAYA SELECTION TEST- 2015 1. NAVODAYA VIDYALAYA SCHEME 1.1 Introduction In accordance with the National Policy of Education (1986) Government
NAVODAYA VIDYALAYA SAMITI PROSPECTUS FOR JAWAHAR NAVODAYA VIDYALAYA SELECTION TEST- 2015
 NAVODAYA VIDYALAYA SAMITI PROSPECTUS FOR JAWAHAR NAVODAYA VIDYALAYA SELECTION TEST- 2015 1. NAVODAYA VIDYALAYA SCHEME 1.1 Introduction In accordance with the National Policy of Education (1986) Government
व रण क ए आ दन-पत र. Prospectus Cum Application Form. न दय व kऱय सम त. Navodaya Vidyalaya Samiti ਨਵ ਦ ਆ ਦਵਦ ਆਦ ਆ ਸਦ ਤ. Navodaya Vidyalaya Samiti
 व रण क ए आ दन-पत र ENGLISH / ह द / ਪ ਜ ਬ Prospectus Cum Application Form PROSPECTUS IS FREE OF COST न दय व kऱय सम त Navodaya Vidyalaya Samiti ਨਵ ਦ ਆ ਦਵਦ ਆਦ ਆ ਸਦ ਤ व रण क तन:श ल क Navodaya Vidyalaya Samiti
Ref. No.YFI/ Dated:
 YOGA FEDERATION OF INDIA (REGD. UNDER THE SOCIETIES REGISTRATION ACT. XXI OF 1860 REGD. NO.1195 DATED 14.02.90) RECOGNIZED BY INDIAN OLYMPIC ASSOCIATION - OCTOBER, 1998 TO FEBRUARY, 2011 Affiliated to
JAWAHAR NAVODAYA VIDYALAYA, RAKH JAGANOO DISTT:UDHAMPUR (J&K)
") JAWAHAR NAVODAYA VIDYALAYA, RAKH JAGANOO DISTT:UDHAMPUR (J&K) ADMISSION NOTICE It is notified for all the concerned Students, Parents, ZEO s and CEO of District Udhampur that JNVST-2018 entrance Exam which
JAWAHAR NAVODAYA VIDYALAYA, RAKH JAGANOO DISTT:UDHAMPUR (J&K) ADMISSION NOTICE It is notified for all the concerned Students, Parents, ZEO s and CEO of District Udhampur that JNVST-2018 entrance Exam which
Systematic Assessment and Monitoring leading to Improving Quality of Education
 Systematic Assessment and Monitoring leading to Improving Quality of Education Abstract This study was aimed at assessment of quality of teaching-learning process and impact of interventions on actual
NATIONAL INSTITUTE OF HOMOEOPATHY
 (i) (ii) (iii) No.8-012/NIH/DAVP/2012 NATIONAL INSTITUTE OF HOMOEOPATHY (An Autonomous Organisation) Govt. of India Ministry of AYUSH GE Block, Sector-III, Salt Lake, Kolkata-700106 Website: www.nih.nic.in
Creating Teachers Communities of Learning. Report on the Subject Teacher Forum Program IT for Change
 Creating Teachers Communities of Learning Report on the Subject Teacher Forum Program IT for Change Table of Contents 1 Background...3 2 Goals of the programme...3 2.1 Subject Matter Expertise...3 2.2
Pragmatic Constraints affecting the Teacher Efficacy in Ethiopia - An Analytical Comparison with India
 Pragmatic Constraints, Affecting the Teacher Surapaneni B. & Sisay S. 81 REVIEW ARTICLE Pragmatic Constraints affecting the Teacher Efficacy in Ethiopia - An Analytical Comparison with India Surapaneni
HCFC Phase-Out Management Plan Servicing Sector
 Implemented by HCFC Phase-Out Management Plan Servicing Sector Roundtable Meeting 5 th March 2014 Seite 1 Implemented by HCFC Phase-Out Management Plan Servicing Sector Roundtable Meeting 5 th March 2014
PIRLS. International Achievement in the Processes of Reading Comprehension Results from PIRLS 2001 in 35 Countries
 Ina V.S. Mullis Michael O. Martin Eugenio J. Gonzalez PIRLS International Achievement in the Processes of Reading Comprehension Results from PIRLS 2001 in 35 Countries International Study Center International
Governors and State Legislatures Plan to Reauthorize the Elementary and Secondary Education Act
 Governors and State Legislatures Plan to Reauthorize the Elementary and Secondary Education Act Summary In today s competitive global economy, our education system must prepare every student to be successful
Sl. No. Name of the Post Pay Band & Grade Pay No. of Post(s) Category
 Category") National Institute of Open Schooling (An autonomous organization under the Deptt. of School Education & Literacy, MHRD Govt. of India) A-24-25, Institutional Area, Sector 62, NOIDA- 201309, Uttar Pradesh
National Institute of Open Schooling (An autonomous organization under the Deptt. of School Education & Literacy, MHRD Govt. of India) A-24-25, Institutional Area, Sector 62, NOIDA- 201309, Uttar Pradesh
International Journal of Innovative Research and Advanced Studies (IJIRAS) Volume 4 Issue 5, May 2017 ISSN:
 Volume 4 Issue 5, May 2017 ISSN:") Effectiveness Of Using Video Presentation In Teaching Biology Over Conventional Lecture Method Among Ninth Standard Students Of Matriculation Schools In Coimbatore District Ms. Shigee.K Master of Education,
Effectiveness Of Using Video Presentation In Teaching Biology Over Conventional Lecture Method Among Ninth Standard Students Of Matriculation Schools In Coimbatore District Ms. Shigee.K Master of Education,
Management and monitoring of SSHE in Tamil Nadu, India P. Amudha, UNICEF-India
 Management and monitoring of SSHE in Tamil Nadu, India P. Amudha, UNICEF-India Photo: UNICEF India UNICEF and the Government of Tamil Nadu collaborated on scaling up the SSHE program in Tamil Nadu, a state
Answer Key For The California Mathematics Standards Grade 1
 Introduction: Summary of Goals GRADE ONE By the end of grade one, students learn to understand and use the concept of ones and tens in the place value number system. Students add and subtract small numbers
Listening and Speaking Skills of English Language of Adolescents of Government and Private Schools
 Listening and Speaking Skills of English Language of Adolescents of Government and Private Schools Dr. Amardeep Kaur Professor, Babe Ke College of Education, Mudki, Ferozepur, Punjab Abstract The present
STATUS OF OPAC AND WEB OPAC IN LAW UNIVERSITY LIBRARIES IN SOUTH INDIA
 CHAPTER - 5 STATUS OF OPAC AND WEB OPAC IN LAW UNIVERSITY LIBRARIES IN SOUTH INDIA 5.0. Introduction Library automation implies the application of computers and utilization of computer based products and
Norms How were TerraNova 3 norms derived? Does the norm sample reflect my diverse school population?
 Frequently Asked Questions Today s education environment demands proven tools that promote quality decision making and boost your ability to positively impact student achievement. TerraNova, Third Edition
TIMSS ADVANCED 2015 USER GUIDE FOR THE INTERNATIONAL DATABASE. Pierre Foy
 TIMSS ADVANCED 2015 USER GUIDE FOR THE INTERNATIONAL DATABASE Pierre Foy TIMSS Advanced 2015 orks User Guide for the International Database Pierre Foy Contributors: Victoria A.S. Centurino, Kerry E. Cotter,
2013 TRIAL URBAN DISTRICT ASSESSMENT (TUDA) RESULTS
 RESULTS") 3 TRIAL URBAN DISTRICT ASSESSMENT (TUDA) RESULTS Achievement and Accountability Office December 3 NAEP: The Gold Standard The National Assessment of Educational Progress (NAEP) is administered in reading
3 TRIAL URBAN DISTRICT ASSESSMENT (TUDA) RESULTS Achievement and Accountability Office December 3 NAEP: The Gold Standard The National Assessment of Educational Progress (NAEP) is administered in reading
INFORMATION BOOKLET. Refer RUHS website (www.ruhsraj.org) for updated and relevant information.
 for updated and relevant information.") RAJASTHAN UNIVERSITY OF HEALTH SCIENCES Kumbha Marg, Sector-18, Pratap Nagar, Tonk Road, Jaipur -302033 Phone: 0141-2795527, 2795550; Fax: 0141-2795550 Website: www.ruhsraj.org RAJASTHAN CENTRALIZED ADMISSIONS
RAJASTHAN UNIVERSITY OF HEALTH SCIENCES Kumbha Marg, Sector-18, Pratap Nagar, Tonk Road, Jaipur -302033 Phone: 0141-2795527, 2795550; Fax: 0141-2795550 Website: www.ruhsraj.org RAJASTHAN CENTRALIZED ADMISSIONS
BASIC EDUCATION IN GHANA IN THE POST-REFORM PERIOD
 BASIC EDUCATION IN GHANA IN THE POST-REFORM PERIOD By Abena D. Oduro Centre for Policy Analysis Accra November, 2000 Please do not Quote, Comments Welcome. ABSTRACT This paper reviews the first stage of
THE UNITED REPUBLIC OF TANZANIA MINISTRY OF EDUCATION, SCIENCE, TECHNOLOGY AND VOCATIONAL TRAINING CURRICULUM FOR BASIC EDUCATION STANDARD I AND II
 THE UNITED REPUBLIC OF TANZANIA MINISTRY OF EDUCATION, SCIENCE, TECHNOLOGY AND VOCATIONAL TRAINING CURRICULUM FOR BASIC EDUCATION STANDARD I AND II 2016 Ministry of Education, Science,Technology and Vocational
Tamil Nadu RURAL. School enrollment and out of school children. Young children in pre-school and school
 ANALYSS BASED ON DATA FROM HOUSEHOLDS. 29 OUT OF 29 DSTRCTS School enrollment and out of school children Table 1: % Children in different types of schools Chart 1: Trends over time % Children out of school
Literacy Level in Andhra Pradesh and Telangana States A Statistical Study
 The International Journal of Engineering and Science (IJES) Volume 6 Issue 6 Pages PP 70-77 2017 ISSN (e): 2319 1813 ISSN (p): 2319 1805 Literacy Level in Andhra Pradesh and Telangana States A Statistical
RAJASTHAN CENTRALIZED ADMISSIONS TO BACHELOR OF PHYSIOTHERAPY COURSE-2017 (RCA BPT-2017) INFORMATION BOOKLET
 INFORMATION BOOKLET") RAJASTHAN UNIVERSITY OF HEALTH SCIENCES Kumbha Marg, Sector-18, Pratap Nagar, Tonk Road, Jaipur -302033 Phone: 0141-2792644, 2795527 Website: www.ruhsraj.org RAJASTHAN CENTRALIZED ADMISSIONS TO BACHELOR
RAJASTHAN UNIVERSITY OF HEALTH SCIENCES Kumbha Marg, Sector-18, Pratap Nagar, Tonk Road, Jaipur -302033 Phone: 0141-2792644, 2795527 Website: www.ruhsraj.org RAJASTHAN CENTRALIZED ADMISSIONS TO BACHELOR
The Comparative Study of Information & Communications Technology Strategies in education of India, Iran & Malaysia countries
 Australian Journal of Basic and Applied Sciences, 6(9): 310-317, 2012 ISSN 1991-8178 The Comparative Study of Information & Communications Technology Strategies in education of India, Iran & Malaysia countries
Grade 5 + DIGITAL. EL Strategies. DOK 1-4 RTI Tiers 1-3. Flexible Supplemental K-8 ELA & Math Online & Print
 Standards PLUS Flexible Supplemental K-8 ELA & Math Online & Print Grade 5 SAMPLER Mathematics EL Strategies DOK 1-4 RTI Tiers 1-3 15-20 Minute Lessons Assessments Consistent with CA Testing Technology
CREATING AWARENESS ABOUT PARLIAMENTARY SYSTEM AND PROCEDURES
 144 Handbook on the Working of Ministry of Parliamentary Affairs 15 CREATING AWARENESS ABOUT PARLIAMENTARY SYSTEM AND PROCEDURES BACKGROUND The 4th All India Whips Conference, held at Bombay in 1962, made
Accessing Higher Education in Developing Countries: panel data analysis from India, Peru and Vietnam
 Accessing Higher Education in Developing Countries: panel data analysis from India, Peru and Vietnam Alan Sanchez (GRADE) y Abhijeet Singh (UCL) 12 de Agosto, 2017 Introduction Higher education in developing
success. It will place emphasis on:
 1 First administered in 1926, the SAT was created to democratize access to higher education for all students. Today the SAT serves as both a measure of students college readiness and as a valid and reliable
Math Grade 3 Assessment Anchors and Eligible Content
 Math Grade 3 Assessment Anchors and Eligible Content www.pde.state.pa.us 2007 M3.A Numbers and Operations M3.A.1 Demonstrate an understanding of numbers, ways of representing numbers, relationships among
Integration of ICT in Teaching and Learning
 Integration of ICT in Teaching and Learning Dr. Pooja Malhotra Assistant Professor, Dept of Commerce, Dyal Singh College, Karnal, India Email: pkwatra@gmail.com. INTRODUCTION 2 st century is an era of
UK Institutional Research Brief: Results of the 2012 National Survey of Student Engagement: A Comparison with Carnegie Peer Institutions
 UK Institutional Research Brief: Results of the 2012 National Survey of Student Engagement: A Comparison with Carnegie Peer Institutions November 2012 The National Survey of Student Engagement (NSSE) has
Learning Lesson Study Course
 Learning Lesson Study Course Developed originally in Japan and adapted by Developmental Studies Center for use in schools across the United States, lesson study is a model of professional development in
First Grade Standards
 These are the standards for what is taught throughout the year in First Grade. It is the expectation that these skills will be reinforced after they have been taught. Mathematical Practice Standards Taught
OPAC and User Perception in Law University Libraries in the Karnataka: A Study
 ISSN 2229-5984 (P) 29-5576 (e) OPAC and User Perception in Law University Libraries in the Karnataka: A Study Devendra* and Khaiser Nikam** To Cite: Devendra & Nikam, K. (20). OPAC and user perception
Missouri Mathematics Grade-Level Expectations
 A Correlation of to the Grades K - 6 G/M-223 Introduction This document demonstrates the high degree of success students will achieve when using Scott Foresman Addison Wesley Mathematics in meeting the
Wonderworks Tier 2 Resources Third Grade 12/03/13
 Wonderworks Tier 2 Resources Third Grade Wonderworks Tier II Intervention Program (K 5) Guidance for using K 1st, Grade 2 & Grade 3 5 Flowcharts This document provides guidelines to school site personnel
Accountability in the Netherlands
 Accountability in the Netherlands Anton Béguin Cambridge, 19 October 2009 2 Ideal: Unobtrusive indicators of quality 3 Accountability System level international assessments National assessments School
What the National Curriculum requires in reading at Y5 and Y6
 What the National Curriculum requires in reading at Y5 and Y6 Word reading apply their growing knowledge of root words, prefixes and suffixes (morphology and etymology), as listed in Appendix 1 of the
Linking the Ohio State Assessments to NWEA MAP Growth Tests *
 Linking the Ohio State Assessments to NWEA MAP Growth Tests * *As of June 2017 Measures of Academic Progress (MAP ) is known as MAP Growth. August 2016 Introduction Northwest Evaluation Association (NWEA
Engineers and Engineering Brand Monitor 2015
 Engineers and Engineering Brand Monitor 2015 Key Findings Prepared for Engineering UK By IFF Research 7 September 2015 We gratefully acknowledge the support of Pearson in delivering this study Contact
A Pilot Study on Pearson s Interactive Science 2011 Program
 Final Report A Pilot Study on Pearson s Interactive Science 2011 Program Prepared by: Danielle DuBose, Research Associate Miriam Resendez, Senior Researcher Dr. Mariam Azin, President Submitted on August
Standards Alignment... 5 Safe Science... 9 Scientific Inquiry Assembling Rubber Band Books... 15
 Standards Alignment... 5 Safe Science... 9 Scientific Inquiry... 11 Assembling Rubber Band Books... 15 Organisms and Environments Plants Are Producers... 17 Producing a Producer... 19 The Part Plants Play...
A Study of Socio-Economic Status and Emotional Intelligence among Madrasa and Islamic School students towards Inclusive Development
 EUROPEAN ACADEMIC RESEARCH Vol. III, Issue 11/ February 2016 ISSN 2286-4822 www.euacademic.org Impact Factor: 3.4546 (UIF) DRJI Value: 5.9 (B+) A Study of Socio-Economic Status and Emotional Intelligence
West s Paralegal Today The Legal Team at Work Third Edition
 Study Guide to accompany West s Paralegal Today The Legal Team at Work Third Edition Roger LeRoy Miller Institute for University Studies Mary Meinzinger Urisko Madonna University Prepared by Bradene L.
Mathematics subject curriculum
 Mathematics subject curriculum Dette er ei omsetjing av den fastsette læreplanteksten. Læreplanen er fastsett på Nynorsk Established as a Regulation by the Ministry of Education and Research on 24 June
Educational system gaps in Romania. Roberta Mihaela Stanef *, Alina Magdalena Manole
 Available online at www.sciencedirect.com ScienceDirect Procedia - Social and Behavioral Scien ce s 93 ( 2013 ) 794 798 3rd World Conference on Learning, Teaching and Educational Leadership (WCLTA-2012)
Government of Tamil Nadu TEACHERS RECRUITMENT BOARD 4 th Floor, EVK Sampath Maaligai, DPI Campus, College Road, Chennai
 Advertisement No. 04/ 2017 Dated: 16.06.2017 Government of Tamil Nadu TEACHERS RECRUITMENT BOARD 4 th Floor, EVK Sampath Maaligai, DPI Campus, College Road, Chennai -600 006. NOTIFICATION / ADVERTISEMENT
E-3: Check for academic understanding
 Respond instructively After you check student understanding, it is time to respond - through feedback and follow-up questions. Doing this allows you to gauge how much students actually comprehend and push
User education in libraries
 International Journal of Library and Information Science Vol. 1(1) pp. 001-005 June, 2009 Available online http://www.academicjournals.org/ijlis 2009 Academic Journals Review User education in libraries
TIMSS Highlights from the Primary Grades
 TIMSS International Study Center June 1997 BOSTON COLLEGE TIMSS Highlights from the Primary Grades THIRD INTERNATIONAL MATHEMATICS AND SCIENCE STUDY Most Recent Publications International comparative results
Process Evaluations for a Multisite Nutrition Education Program
 Process Evaluations for a Multisite Nutrition Education Program Paul Branscum 1 and Gail Kaye 2 1 The University of Oklahoma 2 The Ohio State University Abstract Process evaluations are an often-overlooked
Himani Verma Educational Consultant with Learning Links Foundation
 Innovative Use of ICT for Educational and Community Development: A Case Study of two Educational Initiatives in SSA 1 Collaboration Schools in Tamil Nadu, India Himani Verma Educational Consultant with
Local Conformity of Inclusive Education at Classroom Levels in Asian Countries
 Local Conformity of Inclusive Education at Classroom Levels in Asian Countries University of Tsukuba JUN Kawaguchi 27 th Oct, 2016 18 th APEID-UNESCO Conference 1 Presentation contents International trend
Alignment of Australian Curriculum Year Levels to the Scope and Sequence of Math-U-See Program
 Alignment of s to the Scope and Sequence of Math-U-See Program This table provides guidance to educators when aligning levels/resources to the Australian Curriculum (AC). The Math-U-See levels do not address
key findings Highlights of Results from TIMSS THIRD INTERNATIONAL MATHEMATICS AND SCIENCE STUDY November 1996
 TIMSS International Study Center BOSTON COLLEGE Highlights of Results from TIMSS THIRD INTERNATIONAL MATHEMATICS AND SCIENCE STUDY Now Available International comparative results in mathematics and science
DIBELS Next BENCHMARK ASSESSMENTS
 DIBELS Next BENCHMARK ASSESSMENTS Click to edit Master title style Benchmark Screening Benchmark testing is the systematic process of screening all students on essential skills predictive of later reading
i didnt do my homework poem
 I didnt do my homework poem. Whichever kind of home loan you select, make sure to do your homework just before making a final decision. But the fact that not everyone likes the same thing is actually a
Central Institute of Educational Technology (CIET)
") Central Institute of Educational Technology (CIET) 13.01 Pilot Study of using Mobile Devices for Delivery of Educational Content and Interaction with the Students : To explore the possibilities of delivering
Central Institute of Educational Technology (CIET) 13.01 Pilot Study of using Mobile Devices for Delivery of Educational Content and Interaction with the Students : To explore the possibilities of delivering
STUDENT LEARNING ASSESSMENT REPORT
 STUDENT LEARNING ASSESSMENT REPORT PROGRAM: Sociology SUBMITTED BY: Janine DeWitt DATE: August 2016 BRIEFLY DESCRIBE WHERE AND HOW ARE DATA AND DOCUMENTS USED TO GENERATE THIS REPORT BEING STORED: The
University-Based Induction in Low-Performing Schools: Outcomes for North Carolina New Teacher Support Program Participants in
 University-Based Induction in Low-Performing Schools: Outcomes for North Carolina New Teacher Support Program Participants in 2014-15 In this policy brief we assess levels of program participation and
USE OF ONLINE PUBLIC ACCESS CATALOGUE IN GURU NANAK DEV UNIVERSITY LIBRARY, AMRITSAR: A STUDY
 USE OF ONLINE PUBLIC ACCESS CATALOGUE IN GURU NANAK DEV UNIVERSITY LIBRARY, AMRITSAR: A STUDY Shiv Kumar* and Ranjana Vohra+ The aim of the present study is to investigate the use of Online Public Access
VOCATIONAL QUALIFICATION IN YOUTH AND LEISURE INSTRUCTION 2009
 Requirements for Vocational Qualifications VOCATIONAL QUALIFICATION IN YOUTH AND LEISURE INSTRUCTION 2009 Regulation 17/011/2009 Publications 2013:4 Publications 2013:4 Requirements for Vocational Qualifications
Computers on Wheels!!
 Computers on Wheels!! Computer Education Through Mobile Computer Vans for Rural Children. The Project: Vidya Pratishthan s Institute of Information Technology (VIIT), Baramati, Dist. Pune, Maharashtra,
The Survey of Adult Skills (PIAAC) provides a picture of adults proficiency in three key information-processing skills:
 provides a picture of adults proficiency in three key information-processing skills:") SPAIN Key issues The gap between the skills proficiency of the youngest and oldest adults in Spain is the second largest in the survey. About one in four adults in Spain scores at the lowest levels in
SPAIN Key issues The gap between the skills proficiency of the youngest and oldest adults in Spain is the second largest in the survey. About one in four adults in Spain scores at the lowest levels in
Principal vacancies and appointments
 Principal vacancies and appointments 2009 10 Sally Robertson New Zealand Council for Educational Research NEW ZEALAND COUNCIL FOR EDUCATIONAL RESEARCH TE RŪNANGA O AOTEAROA MŌ TE RANGAHAU I TE MĀTAURANGA
ROLE OF TEACHERS IN CURRICULUM DEVELOPMENT FOR TEACHER EDUCATION
 ROLE OF TEACHERS IN CURRICULUM DEVELOPMENT FOR TEACHER EDUCATION Presented by Ms. Megha Sahebrao Jadhav 1 Dr.(Ms) Pratibha S Patankar 2 Golden Jubilee DRF, Assistant Professor, Department of Education,
EXECUTIVE SUMMARY. TIMSS 1999 International Science Report
 EXECUTIVE SUMMARY TIMSS 1999 International Science Report S S Executive Summary In 1999, the Third International Mathematics and Science Study (timss) was replicated at the eighth grade. Involving 41 countries
RAJASTHAN UNIVERSITY OF HEALTH SCIENCES Kumbha Marg, Sector-18, Pratap Nagar, Tonk Road, Jaipur Phone: ,
 RAJASTHAN UNIVERSITY OF HEALTH SCIENCES Kumbha Marg, Sector-18, Pratap Nagar, Tonk Road, Jaipur -302033 Phone: 0141-2795527, 2795550 Websites: www.ruhsraj.org www.ruhspmc2017.org RAJASTHAN CENTRALIZED
Research Update. Educational Migration and Non-return in Northern Ireland May 2008
 Research Update Educational Migration and Non-return in Northern Ireland May 2008 The Equality Commission for Northern Ireland (hereafter the Commission ) in 2007 contracted the Employment Research Institute
Calculators in a Middle School Mathematics Classroom: Helpful or Harmful?
 University of Nebraska - Lincoln DigitalCommons@University of Nebraska - Lincoln Action Research Projects Math in the Middle Institute Partnership 7-2008 Calculators in a Middle School Mathematics Classroom:
Are You Ready? Simplify Fractions
 SKILL 10 Simplify Fractions Teaching Skill 10 Objective Write a fraction in simplest form. Review the definition of simplest form with students. Ask: Is 3 written in simplest form? Why 7 or why not? (Yes,
Interpreting ACER Test Results
 Interpreting ACER Test Results This document briefly explains the different reports provided by the online ACER Progressive Achievement Tests (PAT). More detailed information can be found in the relevant
IMPERIAL COLLEGE LONDON ACCESS AGREEMENT
 IMPERIAL COLLEGE LONDON ACCESS AGREEMENT BACKGROUND 1. This Access Agreement for Imperial College London is framed by the College s mission, our admissions requirements and our commitment to widening participation.
Australia s tertiary education sector
 Australia s tertiary education sector TOM KARMEL NHI NGUYEN NATIONAL CENTRE FOR VOCATIONAL EDUCATION RESEARCH Paper presented to the Centre for the Economics of Education and Training 7 th National Conference
OVERVIEW OF CURRICULUM-BASED MEASUREMENT AS A GENERAL OUTCOME MEASURE
 OVERVIEW OF CURRICULUM-BASED MEASUREMENT AS A GENERAL OUTCOME MEASURE Mark R. Shinn, Ph.D. Michelle M. Shinn, Ph.D. Formative Evaluation to Inform Teaching Summative Assessment: Culmination measure. Mastery
Writing a Basic Assessment Report. CUNY Office of Undergraduate Studies
 Writing a Basic Assessment Report What is a Basic Assessment Report? A basic assessment report is useful when assessing selected Common Core SLOs across a set of single courses A basic assessment report
TA Script of Student Test Directions
 TA Script of Student Test Directions SMARTER BALANCED PAPER-PENCIL Spring 2017 ELA Grade 6 Paper Summative Assessment School Test Coordinator Contact Information Name: Email: Phone: ( ) Cell: ( ) Visit
Testimony to the U.S. Senate Committee on Health, Education, Labor and Pensions. John White, Louisiana State Superintendent of Education
 Testimony to the U.S. Senate Committee on Health, Education, Labor and Pensions John White, Louisiana State Superintendent of Education October 3, 2017 Chairman Alexander, Senator Murray, members of the
Indian Institute of Ayurvedic Pharmaceutical Sciences [ISO (9001:2008) Certified College]
![Indian Institute of Ayurvedic Pharmaceutical Sciences [ISO (9001:2008) Certified College]](/thumbs/71/66215122.jpg "Indian Institute of Ayurvedic Pharmaceutical Sciences [ISO (9001:2008) Certified College]") Indian Institute of Ayurvedic Pharmaceutical Sciences [ISO (9001:2008) Certified College] Gujarat Ayurved University [NAAC Accreditation Grade A with CGPA 3.28] Frequently Asked Questions (FAQs) 1. How
Indian Institute of Ayurvedic Pharmaceutical Sciences [ISO (9001:2008) Certified College] Gujarat Ayurved University [NAAC Accreditation Grade A with CGPA 3.28] Frequently Asked Questions (FAQs) 1. How
2 nd grade Task 5 Half and Half
 2 nd grade Task 5 Half and Half Student Task Core Idea Number Properties Core Idea 4 Geometry and Measurement Draw and represent halves of geometric shapes. Describe how to know when a shape will show
Executive Summary. Lava Heights Academy. Ms. Joette Hayden, Principal 730 Spring Dr. Toquerville, UT 84774
 Ms. Joette Hayden, Principal 730 Spring Dr. Toquerville, UT 84774 Document Generated On April 25, 2013 TABLE OF CONTENTS Introduction 1 Description of the School 2 School's Purpose 4 Notable Achievements
GLOBAL MEET FOR A RESURGENT BIHAR
 GLOBAL MEET FOR A RESURGENT BIHAR 19-21 January, 2007, Patna Venue: Hotel Maurya, Patna Organised by Institute for Human Development and The Bihar Times In collaboration with Government of Bihar Organising
Function Tables With The Magic Function Machine
 Brief Overview: Function Tables With The Magic Function Machine s will be able to complete a by applying a one operation rule, determine a rule based on the relationship between the input and output within
Karla Brooks Baehr, Ed.D. Senior Advisor and Consultant The District Management Council
 Karla Brooks Baehr, Ed.D. Senior Advisor and Consultant The District Management Council This paper aims to inform the debate about how best to incorporate student learning into teacher evaluation systems
Do students benefit from drawing productive diagrams themselves while solving introductory physics problems? The case of two electrostatic problems
 European Journal of Physics ACCEPTED MANUSCRIPT OPEN ACCESS Do students benefit from drawing productive diagrams themselves while solving introductory physics problems? The case of two electrostatic problems
(Effective from )
") PADHO PARDESH - SCHEME OF INTEREST SUBSIDY ON EDUCATIONAL LOANS FOR OVERSEAS STUDIES FOR THE STUDENTS BELONGING TO THE MINORITY COMMUNITIES (Effective from 2013-14) GOVERNMENT OF INDIA MINISTRY OF MINORITY
PADHO PARDESH - SCHEME OF INTEREST SUBSIDY ON EDUCATIONAL LOANS FOR OVERSEAS STUDIES FOR THE STUDENTS BELONGING TO THE MINORITY COMMUNITIES (Effective from 2013-14) GOVERNMENT OF INDIA MINISTRY OF MINORITY
EVALUATION OF AN INNOVATIVE SCHOOL EYE HEALTH EDUCATIONAL MODE
 EVALUATION OF AN INNOVATIVE SCHOOL EYE HEALTH EDUCATIONAL MODE G.V.S. Murthy L. Verma S. Ahuja ABSTRACT An innovative mode of using school children as health educators for transmitting messages on eye
Page 1 of 11. Curriculum Map: Grade 4 Math Course: Math 4 Sub-topic: General. Grade(s): None specified
: None specified") Curriculum Map: Grade 4 Math Course: Math 4 Sub-topic: General Grade(s): None specified Unit: Creating a Community of Mathematical Thinkers Timeline: Week 1 The purpose of the Establishing a Community
Curriculum Map: Grade 4 Math Course: Math 4 Sub-topic: General Grade(s): None specified Unit: Creating a Community of Mathematical Thinkers Timeline: Week 1 The purpose of the Establishing a Community
Faculty Details proforma for DU Web-site
 Faculty Performa Title Dr First Name SALEEM Last Name MIR Photograph Designation Assistant Professor Address Residence: 60-A (2 Floor) nd Ajit Singh Tokas Building Prateek Market, Munirka New Delhi - 110067