2015 RESULTS: SMARTER BALANCED ASSESSMENT CONSORTIUM (SBAC)
|
|
|
- Eustace Phelps
- 6 years ago
- Views:
Transcription
 SFUSD Board Presentation")
1 2015 RESULTS: SMARTER BALANCED ASSESSMENT CONSORTIUM (SBAC) SFUSD Board Presentation September 29, 2015
2 Presentation Outline Context of SBAC Participation on SBAC Districtwide SBAC Results SBAC Student Report (Parent Resources) School Action
3 Context of SBAC

4 Smarter Balanced Assessments
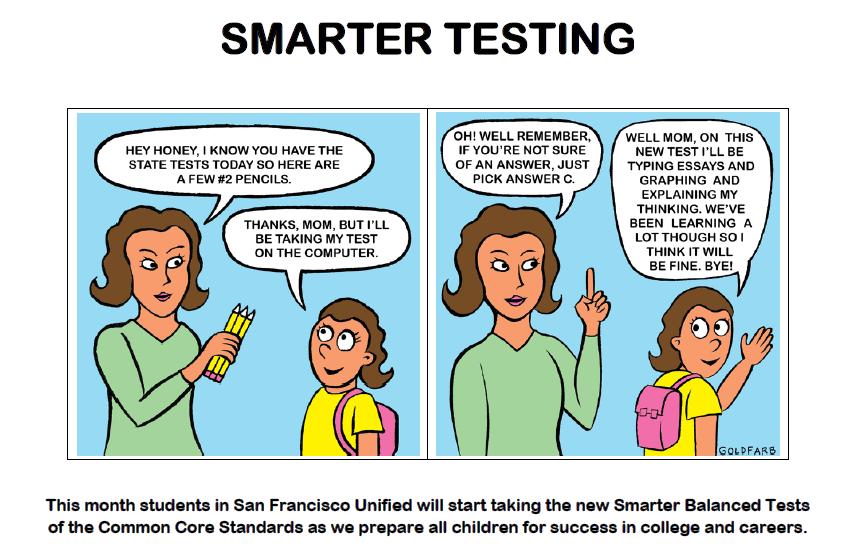
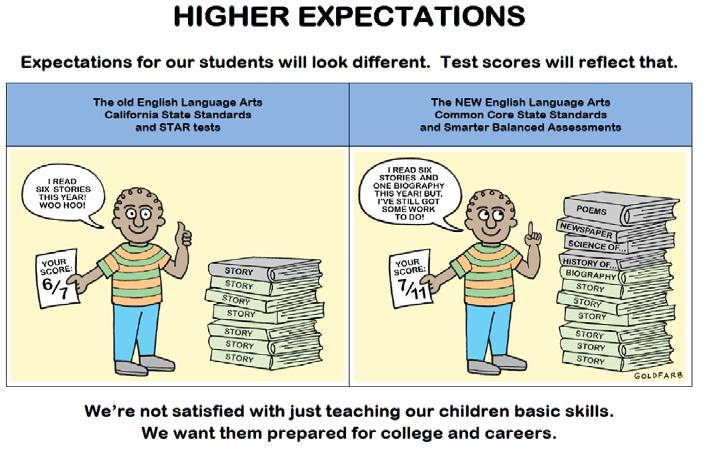
5 Smarter Balanced Assessment Facts The technology-based Smarter Balanced Assessments in Mathematics and English Language Arts measure progress toward the more rigorous California Common Core Standards. The Common Core State Standards in English Language Arts and Mathematics define what a student needs to know and be able to do to be college and career ready for the 21 st century. Shifts in Education: Shifts in curriculum standards and instruction inform assessment and accountability shifts. We see these tests as one of many ways to gauge our progress. This is a baseline year and this year s results cannot be compared to previous years results. However, SBAC is a vertically-aligned assessment that allows measuring growth from one grade level to the next. These tests include a wider variety of questions, requiring students to explain how they solve problems, think critically, reason with evidence, and write analytically.

6 Smarter Balanced Assessments (SBA) What s Different About Them? Source: LAUSD. Smarter Balanced Assessments (SBA) What s Different About Them?

7 Smarter Balanced Assessments (SBA) What s Different About Them? Source: LAUSD. Smarter Balanced Assessments (SBA) What s Different About Them?

8 Smarter Balanced Assessments (SBA) What s Different About Them? Source: LAUSD. Smarter Balanced Assessments (SBA) What s Different About Them?
9 Participation on SBAC
10 Participation on SBAC SBAC Content Areas State Target Percent of Enrolled Students Tested English Language Arts 95% 93% (25,237 students) Mathematics 95% 95.8% (26,102 students) Percent and number of Students Tested, but not reported* 2.5% (673 students) 0.6% (164 students) *NOTE: These figures do not include these scores that are being contested with the test publisher. The following schools have more than 25 students that are currently being contested: Presidio, Washington, Lawton, Glen Park, Lafayette, Longfellow, Rosa Parks, Starr King, Roosevelt, Everett **NOTE: 77 parents requested exemptions from SBAC Testing Source: CDE website and SFUSD
 Text-to-Speech (>500 students)")
11 Special Education and English Learner Testing Preparation Collaborated with Special Education Services and Multilingual Pathways Department Presented to the SFUSD Community Trained Staff District-wide Provided Site-level support Use of Universal Tools, Designated Supports and Accommodations Students with IEPs (approximately 3,500 students participated) Text-to-Speech (>500 students) Color Contrast (>250 students) Masking (>250 students) English Learner Students (approximately 8,000 students participated) Math Translated Glossary - multiple languages (>2,000 students) Math Translated Test Directions multiple languages (>1,000 students) Math Stacked Translations Spanish Only (>500 students)
12 Districtwide SBAC Results
13 Districtwide SBAC Results (ELA)

14 Districtwide SBAC Results (Math)
15 Districtwide SBAC Results (ELA, by Grade Level) 80% English Language Arts Percentage Standard Met Percentage Standard Exceeded Estimates based on Spring 2014 Smarter Balanced national field test 65% 60% 56% 48% 50% 49% 50% 49% 40% 20% 0% SFUSD Met or Exceeded % National Field Test Estimate % Grade 48% 50% 56% 49% 50% 49% 65% 38% 41% 44% 41% 38% 41% 41%
16 Districtwide SBAC Results (Math, by Grade Level) Mathematics Percentage Standard Exceeded Percentage Standard Met Estimates based on Spring 2014 Smarter Balanced national field test 80% 60% 55% 48% 47% 44% 49% 47% 50% 40% 20% 0% Grade SFUSD Met or Exceeded % National Field Test Estimate % 55% 48% 47% 44% 49% 47% 50% 39% 37% 33% 33% 33% 32% 33%
17 Districtwide SBAC Results (by Subgroups) Met or Exceeded Standards English-Language Arts Mathematics All Students Gender Females Males Ethnicity Economic Status Special Education Status Language Fluency American Indian or Alaska Native Asian Black or African American Ethnicity -- Two or More Races Filipino Hispanic or Latino Native Hawaiian or Pacific Islander White Economically Disadvantaged Not Economically Disadvantaged Students with Disability Students with No Reported Disability English Learner English Only Initially-Fluent English Proficient (I-FEP) Reclassified-Fluent English Proficient (R-FEP) 67 60
18 Districtwide SBAC Results (ELA, by SES & Ethnicity) English Language Arts Economically Disadvantaged Not Economically Disadvantaged Percent Met or Exceeded Standards Black or African American Hispanic or Latino Filipino Ethnicity -- Two or More Races Asian White Not Economically Disadvantaged Economically Disadvantaged Difference
19 Districtwide SBAC Results (Math, by SES & Ethnicity) Mathematics Economically Disadvantaged Not Economically Disadvantaged 100 Percent Met or Exceeded Standards Black or African American Hispanic or Latino Filipino Ethnicity -- Two or More Races White Asian Not Economically Disadvantaged Economically Disadvantaged Difference
20 Districtwide SBAC Results (ELA, Comparison to State and Other Districts) English Language Arts San Francisco San Diego State 44 Long Beach 42 Sacramento 35 Los Angeles 33 Oakland 29 Fresno 27 Santa Ana 25
21 Districtwide SBAC Results (Math, Comparison to State and Other Districts) Mathematics San Francisco 48 San Diego 41 State 33 Long Beach 31 Sacramento 29 Los Angeles 25 Oakland 23 Santa Ana 21 Fresno 18
22 Districtwide SBAC Results (ELA & Math, Comparison to State and Other Districts by Targeted Subgroups) ELA Standard Met or Exceeded (%) Overall and SFUSD STATE Los Angeles Fresno Sacramento Long Beach Oakland Santa Ana San Diego Targeted Subgroups Overall African American na 33 Latino English Learners Low SES SpEd Math Standard Met or Exceeded (%) Overall and SFUSD State Los Angeles Fresno Sacramento Long Beach Oakland Santa Ana San Diego Targeted Subgroups Overall African American na 21 Latino English Learners Low SES SpEd
23 SBAC, Correlation to Other Indicators Indicators SBAC ELA SBAC Math % Targeted Students* Chronic Absenteeism Scholastic Reading Inventory (SRI).83 Common Learning Assessments (CLA), Part A ELA.66 Common Learning Assessments (CLA), Part A Math.56 *% Targeted Students include: African-American, Latino, and Samoan Students
24 Highlights of SBAC Results Aspect Highlight Participation > 25,000 in grades 3 8 and 11 Overall Results Halfway to the goal: 52% Met or Exceeded Standards in ELA, 48% Met or Exceeded Standards in Math Comparisons grade level results (% proficient) are higher than predicted, STATE, and other peer districts program level results (English Learners, Special Education, and SED students) excelled relative to peer districts African American and Latino students are lower relative to most peer districts Subgroup Results Highest in ELA/Math: Initially-Fluent English Proficient students Lowest in ELA: Special Education students Lowest in Math: African American students Correlations High positive correlations: District Progress Measures in ELA and Math High negative correlations: Chronic Absenteeism & Concentration of Ethnically Targeted Subgroups (AA, L, Samoan)
25 SBAC Student Report (Parent Resources) NOTE: As a parent, you should receive your student score report within the next two weeks. If not, please contact us at

26 Student Score Report

27 Student Score Report (page 1)

28 Student Score Report (page 2)
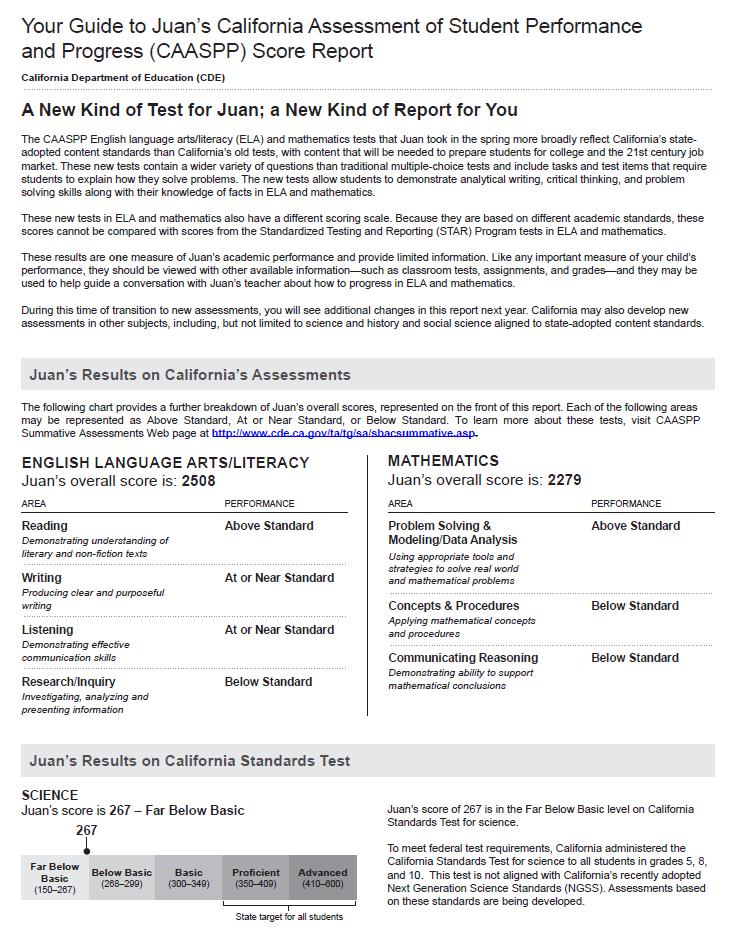
29 Student Score Reports Scores should NOT BE COMPARED to results from the Standardized Testing and Reporting (STAR) program because they are based on different academic standards These results are ONLY ONE OF MANY MEASURES of academic performance: classroom tests, assignments, report cards, teacher conferences, grades, projects These scores are a starting point -- a BASELINE for the progress we expect students to make over time

30 SBAC Parent Resources


31 Resource List for Parents California Assessment of Student Performance and Progress (CAASPP)


32 School Action with Results
33 Progress Measures Leading to SBAC Academic Domain SRI + F&P, Fall ELA SBAC Interim Assessment Block (IAB) ELA Writing Task (grades 3-10) CELDT Window ends 10/30 Math SBAC Interim Assessment Block (IAB) Math Milestone Task (grades K-Alg 2 SRI + F&P, Spring Integrated Writing Assessment (Grd 3, 6, and 9) 2/9 2/19 SBAC Testing 3/10-5/26 (Tentative) CELDT Window ends 10/30 Fall Interim District Assessments Tasks: 10/15 11/13 IABs: TBD Spring Interim District Assessments ELA: 1/4-2/12 Math: 1/25 2/29 IWA 2/9 2/19 SBAC 3/10-5/26 INSTRUCTION ELA Math Spiral 1 (ends mid Oct) Spiral 2 (end winter break) Spiral 3 (end mid-march) Spiral 4 (EOY) Unit 1 Unit 2 Unit 3 Unit 4 Unit 5 Unit 6 Unit 7 Unit 8 Unit 9 Unit 10 Week 1 Aug 17 Week 19 Jan 4 Week 38 May 26 RPA, J.Reyes

34 Context of SBAC: School Quality Improvement Index
Summary of Selected Data Charter Schools Authorized by Alameda County Board of Education
 Summary of Selected Data Charter Schools Authorized by Alameda County Board of Education Prepared for the Alameda County Board of Education November 10, 2015 Alameda County Office of Education Charter
Section V Reclassification of English Learners to Fluent English Proficient
 Section V Reclassification of English Learners to Fluent English Proficient Understanding Reclassification of English Learners to Fluent English Proficient Decision Guide: Reclassifying a Student from
John F. Kennedy Middle School
 John F. Kennedy Middle School CUPERTINO UNION SCHOOL DISTRICT Steven Hamm, Principal hamm_steven@cusdk8.org School Address: 821 Bubb Rd. Cupertino, CA 95014-4938 (408) 253-1525 CDS Code: 43-69419-6046890
Status of Women of Color in Science, Engineering, and Medicine
 Status of Women of Color in Science, Engineering, and Medicine The figures and tables below are based upon the latest publicly available data from AAMC, NSF, Department of Education and the US Census Bureau.
Sunnyvale Middle School School Accountability Report Card Reported Using Data from the School Year Published During
 Sunnyvale Middle School School Accountability Report Card Reported Using Data from the 2014-15 School Year Published During 2015-16 By February 1 of each year, every school in California is required by
Shelters Elementary School
 Shelters Elementary School August 2, 24 Dear Parents and Community Members: We are pleased to present you with the (AER) which provides key information on the 23-24 educational progress for the Shelters
Port Graham El/High. Report Card for
 School: District: Kenai Peninsula Grades: K - 12 School Enrollment: 20 Title I School? No Title 1 Program: Accreditation: Report Card for 2008-2009 A Title 1 school receives federal money in support low-achieving
Coming in. Coming in. Coming in
 212-213 Report Card for Glenville High School SCHOOL DISTRICT District results under review by the Ohio Department of Education based upon 211 findings by the Auditor of State. Achievement This grade combines
Student Mobility Rates in Massachusetts Public Schools
 Student Mobility Rates in Massachusetts Public Schools Introduction The Massachusetts Department of Elementary and Secondary Education (ESE) calculates and reports mobility rates as part of its overall
Kansas Adequate Yearly Progress (AYP) Revised Guidance
 Revised Guidance") Kansas State Department of Education Kansas Adequate Yearly Progress (AYP) Revised Guidance Based on Elementary & Secondary Education Act, No Child Left Behind (P.L. 107-110) Revised May 2010 Revised May
Kansas State Department of Education Kansas Adequate Yearly Progress (AYP) Revised Guidance Based on Elementary & Secondary Education Act, No Child Left Behind (P.L. 107-110) Revised May 2010 Revised May
Psychometric Research Brief Office of Shared Accountability
 August 2012 Psychometric Research Brief Office of Shared Accountability Linking Measures of Academic Progress in Mathematics and Maryland School Assessment in Mathematics Huafang Zhao, Ph.D. This brief
Bella Vista High School School Accountability Report Card Reported Using Data from the School Year Published During
 Bella Vista High School School Accountability Report Card Reported Using Data from the 2014-15 School Year Published During 2015-16 By February 1 of each year, Every school in California is required by
University of Utah. 1. Graduation-Rates Data a. All Students. b. Student-Athletes
 University of Utah FRESHMAN-COHORT GRADUATION RATES All Students Student-Athletes # 2009-10 Graduation Rate 64% 64% Four-Class Average 61% 64% Student-Athlete Graduation Success Rate 87% 1. Graduation-Rates
NATIONAL CENTER FOR EDUCATION STATISTICS
 NATIONAL CENTER FOR EDUCATION STATISTICS Palm Desert, CA The Integrated Postsecondary Education Data System (IPEDS) is the nation s core postsecondary education data collection program. It is a single,
George A. Buljan Middle School School Accountability Report Card Reported Using Data from the School Year Published During
 George A. Buljan Middle School School Accountability Report Card Reported Using Data from the 2015-16 School Year Published During 2016-17 By February 1 of each year, every school in California is required
Dyer-Kelly Elementary School School Accountability Report Card Reported Using Data from the School Year Published During
 Dyer-Kelly Elementary School School Accountability Report Card Reported Using Data from the 2014-15 School Year Published During 2015-16 By February 1 of each year, every school in California is required
Cooper Upper Elementary School
 LIVONIA PUBLIC SCHOOLS http://cooper.livoniapublicschools.org 215-216 Annual Education Report BOARD OF EDUCATION 215-16 Colleen Burton, President Dianne Laura, Vice President Tammy Bonifield, Secretary
California State University EAP Updates 2016
 California State University EAP Updates 2016 CSU San Bernardino EAP Director Faye Wong CSU Office of the Chancellor Student Academic Services Carolina C Cardenas Academic Outreach and Early Assessment
CSU East Bay EAP Breakfast. CSU Office of the Chancellor Student Academic Services Lourdes Kulju Academic Outreach and Early Assessment
 CSU East Bay EAP Breakfast CSU Office of the Chancellor Student Academic Services Lourdes Kulju Academic Outreach and Early Assessment 2015 CAASPP EAP Testing 3.2 million students tested in grades 3-11.
File Print Created 11/17/2017 6:16 PM 1 of 10
 Success - Key Measures Graduation Rate: 4-, 5-, and 6-Year 9. First-time, full-time entering, degree-seeking, students enrolled in a minimum of 12 SCH their first fall semester who have graduated from
A Guide to Adequate Yearly Progress Analyses in Nevada 2007 Nevada Department of Education
 A Guide to Adequate Yearly Progress Analyses in Nevada 2007 Nevada Department of Education Note: Additional information regarding AYP Results from 2003 through 2007 including a listing of each individual
Kahului Elementary School
 Kahului Elementary Code: 405 Status and Improvement Report Year 2014-15 Focus On Standards Grades K-5 Focus on Standards Description Contents Setting Student Profile Community Profile Improvement Summary
ENGLISH. English PROGRAM GUIDE. Program Guide. effective for the school year
 ENGLISH English LEARNER Learner Program Guide PROGRAM GUIDE effective for the 2012 2013 school year A word from the Superintendent Dear Parents and Caring Adults, Thank you for taking the time to learn
Cooper Upper Elementary School
 LIVONIA PUBLIC SCHOOLS www.livoniapublicschools.org/cooper 213-214 BOARD OF EDUCATION 213-14 Mark Johnson, President Colleen Burton, Vice President Dianne Laura, Secretary Tammy Bonifield, Trustee Dan
The Achievement Gap in California: Context, Status, and Approaches for Improvement
 The Achievement Gap in California: Context, Status, and Approaches for Improvement Eva L. Baker, EdD - University of California, Los Angeles, Center for Research on Evaluation, Standards, and Student Testing
ILLINOIS DISTRICT REPORT CARD
 -6-525-2- HAZEL CREST SD 52-5 HAZEL CREST SD 52-5 HAZEL CREST, ILLINOIS and federal laws require public school districts to release report cards to the public each year. 2 7 ILLINOIS DISTRICT REPORT CARD
ILLINOIS DISTRICT REPORT CARD
 -6-525-2- Hazel Crest SD 52-5 Hazel Crest SD 52-5 Hazel Crest, ILLINOIS 2 8 ILLINOIS DISTRICT REPORT CARD and federal laws require public school districts to release report cards to the public each year.
CAMPUS PROFILE MEET OUR STUDENTS UNDERGRADUATE ADMISSIONS. The average age of undergraduates is 21; 78% are 22 years or younger.
 CAMPUS PROFILE MEET OUR STUDENTS Freshmen are defined here as all domestic students entering in fall quarter from high school. These statistics include information drawn from records available at UC Davis.
Arthur E. Wright Middle School 1
 A.E. Wright Middle School 4029 N. Las Virgenes Road, Calabasas, CA 91302 (818) 880-4614 Fax (818) 878-0453 Serving Grades Six through Eight CDS Code: 19-64683-6014781 aewrightmiddleschool.net Elias Miles,
and Beyond! Evergreen School District PAC February 1, 2012
 2011 2014 and Beyond! Evergreen School District PAC February 1, 2012 Presenta(on Outcomes What does the portrait of a 21 century learner look like? What are the Common Core Standards? Why do we have Common
Data Diskette & CD ROM
 Data File Format Data Diskette & CD ROM Texas Assessment of Academic Skills Fall 2002 through Summer 2003 Exit Level Test Administrations Attention Macintosh Users To accommodate Macintosh systems a delimiter
CDS Code
 THE SINGLE PLAN FOR STUDENT ACHIEVEMENT AT CLAY ELEMENTARY SCHOOL 2017-18 37-68338-6039390 CDS Code This is a plan of actions to be taken to raise the academic performance of students and improve the school
Dyer-Kelly Elementary 1
 San Juan Unified School Dyer-Kelly Elementary School 2008-2009 School Accountability Report Card Deborah Wegsteen, Principal School Address: 2236 Edison Ave. Sacramento, CA 95821-1607 916-566-2150 Dr.
12-month Enrollment
 12-month Enrollment 2016-17 Institution: Potomac State College of West Virginia University (237701) Overview 12-month Enrollment Overview The 12-Month Enrollment component collects unduplicated student
El Toro Elementary School
 El Toro Elementary School 2013-14 Published During 2014-15 El Toro Elementary Contact Information (School Year 2014-15) 455 East Main Ave. Morgan Hill, CA 95037-3745 (408) 201-6380 Principal: Contact E-mail
Local Educational Agency California Assessment of Student Performance and Progress Student Data File Layout
 Local Educational Agency California Assessment of Student 2015 16 Student Data File Layout Results for the following: Smarter Balanced Summative Assessments for English Language Arts/Literacy and California
BUILDING CAPACITY FOR COLLEGE AND CAREER READINESS: LESSONS LEARNED FROM NAEP ITEM ANALYSES. Council of the Great City Schools
 1 BUILDING CAPACITY FOR COLLEGE AND CAREER READINESS: LESSONS LEARNED FROM NAEP ITEM ANALYSES Council of the Great City Schools 2 Overview This analysis explores national, state and district performance
Malcolm X Elementary School 1731 Prince Street Berkeley, CA (510) Grades K-5 Alexander Hunt, Principal
 Grades K-5 Alexander Hunt, Principal") Malcolm X Elementary School 1731 Prince Street Berkeley, CA 94703 (510) 644-6313 Grades K-5 Alexander Hunt, Principal alexanderhunt@berkeley.net 2012-13 School Accountability Report Card Published During
Malcolm X Elementary School 1731 Prince Street Berkeley, CA 94703 (510) 644-6313 Grades K-5 Alexander Hunt, Principal alexanderhunt@berkeley.net 2012-13 School Accountability Report Card Published During
Adult Education ACCE Presentation. Neil Kelly February 2, 2017
 Adult Education ACCE Presentation Neil Kelly February 2, 2017 Agenda The Adult Education Universe Data and Accountability System Adult Education Funding California Dreaming Adult Education Big Picture
World s Best Workforce Plan
 2017-18 World s Best Workforce Plan District or Charter Name: PiM Arts High School, 4110-07 Contact Person Name and Position Matt McFarlane, Executive Director In accordance with Minnesota Statutes, section
READY OR NOT? CALIFORNIA'S EARLY ASSESSMENT PROGRAM AND THE TRANSITION TO COLLEGE
 READY OR NOT? CALIFORNIA'S EARLY ASSESSMENT PROGRAM AND THE TRANSITION TO COLLEGE Michal Kurlaender University of California, Davis Policy Analysis for California Education March 16, 2012 This research
School Accountability Report Card Published During the School Year
 Met Sacramento High School 810 V St. Sacramento, CA 95818 916.395.5417 Grades 9-12 Vince Wolfe, Principal vince-wolfe@metsacramento.org metsacramento.org 2014-15 School Accountability Report Card Published
Student Support Services Evaluation Readiness Report. By Mandalyn R. Swanson, Ph.D., Program Evaluation Specialist. and Evaluation
 Student Support Services Evaluation Readiness Report By Mandalyn R. Swanson, Ph.D., Program Evaluation Specialist and Bethany L. McCaffrey, Ph.D., Interim Director of Research and Evaluation Evaluation
Raising All Boats: Identifying and Profiling High- Performing California School Districts
 Raising All Boats: Identifying and Profiling High- Performing California School Districts Mette Huberman, Tom Parrish, Melissa Arellanes, Raquel González, & Jenny Scala American Institutes for Research
School Accountability Report Card Published During the School Year
 El Toro High School 25255 Toledo Way Lake Forest CA, 92630 (949) 586-6333 Grades 9-12 Terri Gusiff, Principal Terri.Gusiff@svusd.org www.schools@svusd.org 2015-16 School Accountability Report Card Published
State of New Jersey
 OVERVIEW 1213 GRADE SPAN KG6 116946 GALLOWAY, NEW JERSEY 85 This school's academic performance is about average when compared to schools across the state. Additionally, its academic performance is very
UW-Waukesha Pre-College Program. College Bound Take Charge of Your Future!
 UW-Waukesha Pre-College Program College Bound 2017 Take Charge of Your Future! This is a great program to increase your knowledge on various subjects. Students will be engaged in workshops and hands-on
Basic Skills Initiative Project Proposal Date Submitted: March 14, Budget Control Number: (if project is continuing)
") Basic Skills Initiative Project Proposal 2016-2017 Date Submitted: March 14, 2016 Check One: New Proposal: Continuing Project: X Budget Control Number: (if project is continuing) Control # 87-413 - EOPS
Basic Skills Initiative Project Proposal 2016-2017 Date Submitted: March 14, 2016 Check One: New Proposal: Continuing Project: X Budget Control Number: (if project is continuing) Control # 87-413 - EOPS
National Survey of Student Engagement The College Student Report
 The College Student Report This is a facsimile of the NSSE survey (available at nsse.iub.edu/links/surveys). The survey itself is administered online. 1. During the current school year, about how often
University of Arizona
 Annual Report Submission View Questionnaire (Edit) University of Arizona Annual Report Submission for the year 2009. Report has been submitted 1 times. Report was last submitted on 11/30/2009 7:12:09 PM.
SAT Results December, 2002 Authors: Chuck Dulaney and Roger Regan WCPSS SAT Scores Reach Historic High
 ABOUT THE SAT 2001-2002 SAT Results December, 2002 Authors: Chuck Dulaney and Roger Regan WCPSS SAT Scores Reach Historic High The Scholastic Assessment Test (SAT), more formally known as the SAT I: Reasoning
Frank Phillips College. Accountability Report
 Frank Phillips College Accountability Report January 2016 Accountability System, January 2016 1 of 22 Participation - Key Measures Enrollment 1. Fall Headcount (Unduplicated) Fall 2000 Fall 2014 Fall 2015
Engage Educate Empower
 Engage Educate Empower John F. Kennedy High School B Engage Educate Empower John F. Kennedy High School C Engage Educate Empower JFK Approved AP Courses Subject 2012-13 2013-14 2014-15 2015-16 Biology
Raw Data Files Instructions
 Raw Data Files Instructions Colleges will report the above information for students in the Main Cohort for each of the reporting timeframes and the system will calculate the sub cohorts and metrics based
Iowa School District Profiles. Le Mars
 Iowa School District Profiles Overview This profile describes enrollment trends, student performance, income levels, population, and other characteristics of the public school district. The report utilizes
SFY 2017 American Indian Opportunities and Industrialization Center (AIOIC) Equity Direct Appropriation
 Equity Direct Appropriation") SFY 2017 American Indian Opportunities and Industrialization Center (AIOIC) Equity Direct Appropriation Report to the Legislature as required by 2016 Minnesota Session Laws, Chapter 189, H.F. 2749, Article
SFY 2017 American Indian Opportunities and Industrialization Center (AIOIC) Equity Direct Appropriation Report to the Legislature as required by 2016 Minnesota Session Laws, Chapter 189, H.F. 2749, Article
https://secure.aacte.org/apps/peds/print_all_forms.php?view=report&prin...
 1 of 35 4/25/2012 9:56 AM A» 2011 PEDS» Institutional Data inst id: 3510 Institutional Data A_1 Institutional Information This information will be used in all official references to your institution. Institution
SMILE Noyce Scholars Program Application
 ONLINE POST-BABACCALAUREATE TEACHER PREPARATION PROGRAM SMILE yce Scholars Program Application Introduction: Rio Salado College is soliciting applicants for the Science and Math Innovative Learning Environments
KENT STATE UNIVERSITY
 KENT STATE UNIVERSITY Regents STARTALK Teacher Leadership Academy: Chinese, Russian Director: Brian J. Baer / Co-director: Theresa A. Minick Program Dates: Thursday, July 7 - Saturday, July 16 Summer 2016
5 Programmatic. The second component area of the equity audit is programmatic. Equity
 5 Programmatic Equity It is one thing to take as a given that approximately 70 percent of an entering high school freshman class will not attend college, but to assign a particular child to a curriculum
John F. Kennedy Junior High School
 John F. Kennedy Junior High 2010-2011 Accountability Report Card Jason Strickland, Principal Address: 1000 East Florinda Street Hanford, CA 93232 559.585.3850 Hanford Elementary Paul J. Terry, Superintendent
Omak School District WAVA K-5 Learning Improvement Plan
 Omak School District WAVA K-5 Learning Improvement Plan 2015-2016 Vision Omak School District is committed to success for all students and provides a wide range of high quality instructional programs and
Educational Attainment
 A Demographic and Socio-Economic Profile of Allen County, Indiana based on the 2010 Census and the American Community Survey Educational Attainment A Review of Census Data Related to the Educational Attainment
School Accountability Report Card Published During the School Year
 George Washington Carver School of Arts and Science 10101 Systems Pkwy. Sacramento, CA 95827 916.228.5751 Grades 9-12 Allegra Alessandri, Ed.D, Principal allegra-alessandri@scusd.edu 2014-15 School Accountability
San Luis Coastal Unified School District School Accountability Report Card Published During
 San Luis Coastal Unified School District Grade 7 through Grade 8 Kyle Pruitt, Ph.D. - Principal E-mail: kpruitt@slcusd.org 1555 El Moro Road Los Osos, CA 93402 Phone: (805) 534-2835 Fax: (805) 528-5133
Institution of Higher Education Demographic Survey
 Institution of Higher Education Demographic Survey Data from all participating institutions are aggregated for the comparative studies by various types of institutional characteristics. For that purpose,
Arlington Elementary All. *Administration observation of CCSS implementation in the classroom and NGSS in grades 4 & 5
 GOAL 1: Professional Development Arlington Elementary School will implement an effective, cohesive and sustainable professional development model that maximizes the conditions of learning for all students.
The Demographic Wave: Rethinking Hispanic AP Trends
 The Demographic Wave: Rethinking Hispanic AP Trends Kelcey Edwards & Ellen Sawtell AP Annual Conference, Las Vegas, NV July 19, 2013 Exploring the Data Hispanic/Latino US public school graduates The Demographic
Minnesota s Consolidated State Plan Under the Every Student Succeeds Act (ESSA)
") Minnesota s Consolidated State Plan Under the Every Student Succeeds Act (ESSA) To be submitted to the U.S. Department of Education in September 2017 IMPORTANT NOTE: This is an early draft prepared for
Minnesota s Consolidated State Plan Under the Every Student Succeeds Act (ESSA) To be submitted to the U.S. Department of Education in September 2017 IMPORTANT NOTE: This is an early draft prepared for
DLM NYSED Enrollment File Layout for NYSAA
 Enrollment Field Definitions AYP_School_ Identifier Alphanumeric; 30 No The BEDSCODE of the DISTRICT that has Committee on Special Education (CSE) responsibility for the student. Must include any leading
SINGLE PLAN FOR STUDENT ACHIEVEMENT. Peter Johansen High School
 SINGLE PLAN FOR STUDENT ACHIEVEMENT Peter Johansen High School 50 711755030135 CDS Code Non TITLE 1: TITLE 1 Schoolwide: X TITLE 1 Targeted Assistance: Date of this revision: 10/18/16 This is a plan of
Wisconsin 4 th Grade Reading Results on the 2015 National Assessment of Educational Progress (NAEP)
") Wisconsin 4 th Grade Reading Results on the 2015 National Assessment of Educational Progress (NAEP) Main takeaways from the 2015 NAEP 4 th grade reading exam: Wisconsin scores have been statistically flat
Wisconsin 4 th Grade Reading Results on the 2015 National Assessment of Educational Progress (NAEP) Main takeaways from the 2015 NAEP 4 th grade reading exam: Wisconsin scores have been statistically flat
History. 344 History. Program Student Learning Outcomes. Faculty and Offices. Degrees Awarded. A.A. Degree: History. College Requirements
 344 History History History is the disciplined study of the human past. Santa Barbara City College offers a varied and integrated curriculum in history. For the major, the History Department provides the
Los Angeles City College Student Equity Plan. Signature Page
 Los Angeles City College Student Equity Plan Signature Page Los Angeles Community College Los Angeles City College President, Board of Trustees Date District Chancellor: College President: Academic Senate
Desert Valley High School SELF-STUDY REPORT
 SELF-STUDY REPORT Submitted to the Western Association of Schools and Colleges 104 Magnolia Street Brawley, CA 92227 Brawley Union High School District March 20-22, 2017 Brawley Union High School District
The Condition of College & Career Readiness 2016
 The Condition of College and Career Readiness This report looks at the progress of the 16 ACT -tested graduating class relative to college and career readiness. This year s report shows that 64% of students
APPLICANT INFORMATION. Area Code: Phone: Area Code: Phone:
 MARQUETTE UNIVERSITY HEALTH CAREERS OPPORTUNITY PROGRAM College Science Enrichment Program (CSEP) & Pre-Enrollment Support Program (PESP) Website: http://www.mu.edu/hcop INSTRUCTIONS: Please type or print
African American Male Achievement Update
 Report from the Department of Research, Evaluation, and Assessment Number 8 January 16, 2009 African American Male Achievement Update AUTHOR: Hope E. White, Ph.D., Program Evaluation Specialist Department
ASSESSMENT OVERVIEW Student Packets and Teacher Guide. Grades 6, 7, 8
 ASSESSMENT OVERVIEW Student Packets and Teacher Guide Grades 6, 7, 8 2015 To help you more fully understand the assessments, extra commentary for each slide is located at the bottom of it. Some Terms Formative
Guide to the Program in Comparative Culture Records, University of California, Irvine AS.014
 http://oac.cdlib.org/findaid/ark:/13030/kt2f59q8v9 No online items University of California, Irvine AS.014 Finding aid prepared by Processed by Mary Ellen Goddard and Michelle Light; machine-readable finding
Colorado s Unified Improvement Plan for Schools for Online UIP Report
 Colorado s Unified Improvement Plan for Schools for 2015-16 Online UIP Report Organization Code: 2690 District Name: PUEBLO CITY 60 Official 2014 SPF: 1-Year Executive Summary How are students performing?
Serving Country and Community: A Study of Service in AmeriCorps. A Profile of AmeriCorps Members at Baseline. June 2001
 Serving Country and Community: A Study of Service in AmeriCorps Cambridge, MA Lexington, MA Hadley, MA Bethesda, MD Washington, DC Chicago, IL Cairo, Egypt Johannesburg, South Africa A Profile of AmeriCorps
Missouri 4-H University of Missouri 4-H Center for Youth Development
 Missouri 4-H University of Missouri 4-H Center for Youth Development Missouri 4-H Key Award Purpose To Encourage: A quality educational programs for all members. A safe environment where all youth feel
46 Children s Defense Fund
 Nationally, about 1 in 15 teens ages 16 to 19 is a dropout. Fewer than two-thirds of 9 th graders in Florida, Georgia, Louisiana and Nevada graduate from high school within four years with a regular diploma.
PUBLIC INFORMATION POLICY
 CALIFORNIA STATE POLYTECHNIC UNIVERSITY, POMONA Landscape Architecture College of Environmental Design PUBLIC INFORMATION POLICY Landscape Architecture Accreditation Board (LAAB) accredited programs are
Great Teachers, Great Leaders: Developing a New Teaching Framework for CCSD. Updated January 9, 2013
 Great Teachers, Great Leaders: Developing a New Teaching Framework for CCSD Updated January 9, 2013 Agenda Why Great Teaching Matters What Nevada s Evaluation Law Means for CCSD Developing a Teaching Framework
NC Education Oversight Committee Meeting
 NC Education Oversight Committee Meeting November 7, 2017 Nathan Currie, Superintendent Bridget Phifer, NCCA Board Chair Agenda School Demographics Achievements & Improvements Critical Needs Q&A Mission
Campus Diversity & Inclusion Strategic Plan
 Campus Diversity & Inclusion Strategic Plan 1 Table of Contents Message from the President... 3 Executive Summary... 4 Goals of the 2020 Vision Plan... 5 Functional Definition of Diversity... 7 Four Dimensions
TRANSFER APPLICATION: Sophomore Junior Senior
 : Sophomore Junior Senior 2714 W Augusta Phone: 773.534.9718 Fax: 773.534.4022 Email: admissions@chiarts.org Web: www.chiarts.org CPS Mail Run: G.S.R. #35 FRESHMAN APPLICATION STEPS Thank you for your
Rural Education in Oregon
 Rural Education in Oregon Overcoming the Challenges of Income and Distance ECONorthwest )'3231-'7 *-2%2') 40%22-2+ Cover photos courtesy of users Lars Plougmann, San José Library, Jared and Corin, U.S.Department
Transportation Equity Analysis
 2015-16 Transportation Equity Analysis Each year the Seattle Public Schools updates the Transportation Service Standards and bus walk zone boundaries for use in the upcoming school year. For the 2014-15
International: Three-Year School Improvement Plan to September 2016 (Year 2)
") International: Three-Year School Improvement Plan 2016-17 to 2017-18 September 2016 (Year 2) Bellevue School District Mission: To provide all students with an exemplary college preparatory education so
International: Three-Year School Improvement Plan 2016-17 to 2017-18 September 2016 (Year 2) Bellevue School District Mission: To provide all students with an exemplary college preparatory education so
Local Control and Accountability Plan and Annual Update Template
 Page 1 of 69 Introduction: LEA: Monroe Middle School Contact (Name, Title, Email, Phone Number): Dawnel Sonntag, Principal, dsonntag@campbellusd.org, (408) 341-7026 LCAP Year: 2015-2016 Local Control and
Cupertino High School Accountabiltiy Report Card. Kami Tomberlain, Principal FREMONT UNION HIGH SCHOOL DISTRICT
 Cupertino High Kami Tomberlain, Principal Address: 10100 Finch Avenue, Cupertino, CA 95014 408-366-7300 FREMONT UNION HIGH SCHOOL DISTRICT 2010-2011 Accountabiltiy Report Card Profile Cupertino is a four-year
Samuel Enoka Kalama Intermediate School
 Code: 420 Samuel Enoka Kalama Intermediate Status and Improvement Report Year 2014-15 Focus On Standards Grades 6-8 Contents This Status and Improvement Report has been prepared as part of the Department's
Moving the Needle: Creating Better Career Opportunities and Workforce Readiness. Austin ISD Progress Report
 Moving the Needle: Creating Better Career Opportunities and Workforce Readiness Austin ISD Progress Report 2013 A Letter to the Community Central Texas Job Openings More than 150 people move to the Austin
Institution-Set Standards: CTE Job Placement Resources. February 17, 2016 Danielle Pearson, Institutional Research
 Institution-Set Standards: CTE Job Placement Resources February 17, 2016 Danielle Pearson, Institutional Research Standard 1.B.3 states: The institution establishes institution-set standards for student
Demographic Analysis for Alameda Unified School District
 Demographic Analysis for Alameda Unified School District December 14, 2009 Kirsten Vital, Superintendent Board of Trustees Mike McMahon, President Ron Mooney, Vice President Tracy Jensen, Trustee Trish
Hokulani Elementary School
 Hokulani Elementary Code: 109 Status and Improvement Report Year -11 Contents Focus On Standards Grades K-5 This Status and Improvement Report has been prepared as part of the Department's education accountability
Getting Results Continuous Improvement Plan
 Page of 9 9/9/0 Department of Education Market Street Harrisburg, PA 76-0 Getting Results Continuous Improvement Plan 0-0 Principal Name: Ms. Sharon Williams School Name: AGORA CYBER CS District Name: