India Microfinance Geographical Index
|
|
|
- Avis Black
- 6 years ago
- Views:
Transcription


1 India Microfinance Geographical Index For March 2015 Quarter

2 India Microfinance Geographical Index A tool to measure microfinance service penetration across India
3 2 India Microfinance Geographical Index Author: Mohita Khamar, Market Intelligence Lead Renso Martinez, Operations Manager Editors: Blaine Stephens, Chief Operating Officer Sachin Hirani, Regional Manager Asia Nikhil Gehani, Marketing and Communications Manager Data Collection & Processing: Shikha Agarwal, Analyst Prakhar Saxena, Analyst Rekha Dokka, Coordinator Supported by SIDBI SFMC Vertical: Prakash Kumar, General Manager Neeraj Srivastava, Asst. General Manager Rachana Gupta, Manager Designer: M V Rajeevan, Graphic Designer Disclaimer: This publication is available for use in research and analysis. Data and content may only be used for non-commercial purposes. If the material is published or distributed, it should be attributed to MIX with the appropriate citation. MIX has taken due care and caution in preparing this report, it has obtained the information from the institutions. Thus MIX relies on the information submitted and does not guarantee the accuracy, adequacy or completeness of any information and is not responsible for any errors in transmission. This document has been prepared under Scaling Up Sustainable and Responsible Microfinance project funded by World Bank and implemented by SIDBI. However, the contents do not necessarily reflect views of World Bank/ SIDBI.
4 India Microfinance Geographical Index 3 MIX promotes responsible financial services for underserved communities through data analytics and market insight. We do this through two decision support platforms, MIX Market and FINclusion Lab. As basic infrastructure for responsible and inclusive markets, these platforms provide a necessary ecosystem to enable and inspire coordinated investment, effective policy, and positive social outcomes for the financially underserved. Small Industries Development Bank of India (SIDBI), set up on April 2, 1990 under an Act of Indian Parliament, is the Principal Financial Institution for the Promotion, Financing and Development of the Micro, Small and Medium Enterprise (MSME) sector and for Coordination of the functions of the institutions engaged in similar activities.
5 4 India Microfinance Geographical Index Acknowledgement MIX would like to thank the Small Industries Development Bank of India (SIDBI) for supporting the Indian Microfinance Platform ( which displays the data of Indian microfinance institutions (MFIs) and provides additional sector analysis. MIX s collaboration with SIDBI facilitates data collection within the sector, standardizes the data collected and provides analytical tools that present an in-depth analysis of the financial and operating trends in the industry. MIX is privileged to take this opportunity to showcase the result of this collaboration: the India Microfinance Geographical Index. The India Microfinance Geographical Index is part of an interactive platform created by MIX that maps the reach of Indian MFIs across the various states and districts. MIX is grateful to all the institutions in the sector that have provided the comprehensive geographical data at state and district level in a timely manner. MIX would not have been able to provide access to this data and create this analytical platform without the strong support and dedication from all the institutions that contribute to building transparency in the industry.
 initiative of the Bank in collaboration with the World Bank and MIX.")
6 India Microfinance Geographical Index 5 Foreword - SIDBI On behalf of Small Industries Development Bank of India (SIDBI), I am pleased to present the India Microfinance Geographical Index as part of the on-going India Micro Finance Platform (IMFP) initiative of the Bank in collaboration with the World Bank and MIX. IMFP has been designed to promote greater transparency in the microfinance sector as part of overarching architecture of furtherance of the Responsible Lending practices in the microfinance space in India. As is well known, SIDBI has, over the years, been playing the key market maker role in the Micro Finance Institutions (MFI) space. It has undertaken various initiatives, such as Capacity Assessment Rating - a holistic assessment of MFIs, Code of Conduct Assessment (COCA), creating awareness about responsible financing, developing & disseminating best practices, assisting MFIs in implementing best practices, etc., towards promoting responsible financing in the micro finance sector. IMFP is another such enabling initiative by SIDBI for the orderly and regulated growth of the sector. IMFP aims to promote greater transparency and responsible microfinance through the development of a common information platform and move the sector towards better governance through formalized monitoring of the microfinance code of conduct by independent organizations. Microfinance Geographical Index is one of the subcomponents of the overall IMFP framework. Microfinance Geographical Index is based on quantitative factors that attempt to capture certain dimensions of financial inclusion including the penetration of credit and a proxy of its quality based on a geographical context in order to identify areas based in how served they are and where the microfinance institutions can improve progressively access to financial services to their clients starting with the provision of credit. I take this opportunity to compliment the MIX team for their dedicated efforts in developing and executing the IMFP intervention successfully, including the analytical. I would also like to thank the MFIs for sharing the information timely with MIX and making IMFP a reality without which this would not have been achieved. The World Bank has been a long standing partner of SIDBI and supporting the various responsible lending initiatives undertaken by SIDBI for the progress of the sector and this initiative has been supported under the World Bank assisted Scaling up Sustainable and Responsible Microfinance Project. I am sure the World Bank would partner more such initiatives in the interest of the progress of the sector. I sincerely hope that this effort adds greater value to all the stakeholders in the microfinance sector, which has been successfully playing its role in progressively achieving women empowerment and financial inclusion across India. S Ramakrishnan Chief General Manager SIDBI, Head Office

7 6 India Microfinance Geographical Index Foreword - MIX MIX has worked with its partners in the microfinance sector over the last decade to bring to light new data and to develop insight on microfinance that helps sector actors answer pressing questions in guiding healthy market development. From institutional sustainability and product offerings to social performance, successive waves of market development have each called for new information and tools to help actors make sense of the sector developments for their respective roles. In today s financial services environment, data limited to institutional performance and country level aggregates are not sufficient to support healthy market development. New entrants need to navigate the existing landscape of financial services; long standing microfinance players need to assess the impact of competition on their own growth plans; and policy makers need to evaluate gaps and concentrations in cities, districts and local markets to develop policy to support financial inclusion. In all these instances, we need better tools to understand the financial services offerings across the varied landscapes of a given country. MIX s Microfinance Geographical Index developed in partnership with SIDBI under the India Microfinance Platform (IMFP), evaluates the level of microfinance service on a district-by-district basis across India. It assigns each district a score from highly served to not served based on MFI presence and service levels relative to local market opportunities, creating a simple reference for analysing market concentration and gaps. This first geographic index builds on quarterly data reported by MFIs under this partnership and uses a simple quantitative methodology to create a robust tool to track market developments in each district over time. MIX would like to thank SIDBI for its support and all participating MFIs for their continued collaboration in providing timely, complete data on the geographic scope of their operations. The resulting information and analysis will help guide Indian MFIs and lenders in strengthening responsible finance in the sector. Blaine Stephens Chief Operating Officer MIX
8 India Microfinance Geographical Index 7 Introduction In October 2010, the microfinance crisis in Andhra Pradesh ushered in an era of reforms that forever altered the microfinance sector in India and, likely, around the world 1. While the rapid shift in political and regulatory frameworks impacted the operations of microfinance institutions (MFIs), this tragic incident also highlighted the importance of monitoring the geographical reach of institutions across the country. Specifically, it illuminated the need to understand the level of microfinance service on a district-by-district and state-by-state basis. Because India is home to around 21% of the world s unbanked adults 2, the microfinance sector plays a key role in providing financial services across the country. Yet, the cultural and economic landscape of India is also strikingly diverse, and enormous variation exists between states. In some states, like Jharkhand, over 35% of the population lives below the poverty line, while in other states, like Kerala, less than 10% of the population is classified as poor. Because of the disparity between states and also districts it is necessary to have a detailed view of microfinance operations from a subnational perspective. In June 2013, MIX partnered with SIDBI and began collecting the geographical data from the MFIs to improve the transparency of the microfinance industry. Through geospatial mapping of institutional reach, the Microfinance Geographical Index enables actors to easily monitor the concentration of microfinance services across India and, where necessary, take any corrective action through policy, regulation, or investment. The Microfinance Geographical Index measures the geographical spread of microfinance institutions. In this first edition, the Microfinance Geographical Index covers 642 districts and 35 states/uts at a quarterly interval. The current index scores are calculated based on the data provided by the institutions for the period of December 2014 quarter, March 2015 quarter and June 2015 quarter. This can be viewed on MIX Market and FinclusionLab. The following analysis is divided into three sections: 1. Methodology for the Index 2. State-level Analysis 3. District-level Analysis The accompanying online tool consists of four tabbed sections to allow users to explore various aspects of the geographic distribution of microfinance services. The sections are (1) Index, which provides a visual presentation of the various indices; (2) Institution Analysis, which allows users to view the geographical spread of MFIs at the state and district level on four indicators (number of branches, loans disbursed for the quarter, number of loans outstanding, and gross loan portfolio); (3) Market Analysis, which allows users to view institutional-level coverage while incorporating various demographic metrics. 1. https: / Microfinance-Nov-2010.pdf 2. http: /
9 8 India Microfinance Geographical Index Methodology for the Index Concept The objective of the Microfinance Geographical Index is to enable stakeholders to easily, and simply, visualize the geographical concentration of microfinance services at the state and district levels. The goal is to enhance understanding of the distribution of microfinance services across regions by providing actionable insight into the industry. The index focuses on relative credit penetration, service point access, and loan duration. By assessing on various factors listed below the index scores each state and district to identify the coverage of microcredit during a specific period of time. The Microfinance Geographical Index aggregates data at two geographical levels (state and district). The methodology is framed in a manner that includes the portfolio spread of the institution, their operation network and outreach levels. The information received by MIX on the geographical areas of each of the institution is based on self-reported data. The data is aggregated at state and district level individually; penetration at the state and districts levels is composed of five metrics which are compared and summarized in an aggregated score. These categories help facilitate the identification of areas with high or low level of access to credit. Approach 1. MFIs report district and state level information to MIX on a quarterly basis. These geographical data include indicators such as: a. Number of MFI institutions in each district and state 3 b. Number of branches c. Value of loans disbursed during the period d. Number of outstanding loans e. Gross loan portfolio 2. Data reported at the state and district level are aggregated and compared against institution-level data from financial statements and other management reports submitted by the institutions. Data discrepancies are removed from the calculation. 3. Demographic data has been used as complementary data in order to measure credit coverage in relation to the indicators mentioned above. The relationship is then converted into metrics to identify the index score 4. Poverty data are used as complementary data for the purpose of state index calculation. This has been sourced from poverty estimates for , based on the survey conducted by the National Sample Survey Offices (NSSO) Illiterate population is used as complementary data for the district index calculation. It is used as a proxy to the 3. Number of institution that have reported geographical information during the quarter 4. http: /planningcommission.nic.in/reports/genrep/pov_rep0707.pdf
10 India Microfinance Geographical Index 9 Poor Population due to unavailability of the data at district level. Illiterate population is based on a calculation performed by MIX. 6. All metrics considered for the index calculation are converted to a percentile scale that allows comparison across factors which have different levels of distribution. Metrics are listed in the following section. 7. A simple average is calculated based on all individual percentiles of each metric to obtain a unique value per area (district and state). The final score value are based on the percentile score. 8. Using the final index score per area, the results are then divided into four groups: highly served, served, low served, and unserved. In addition, we have identified areas such as unclassified where the data is not complete across all metrics and no operations where none of the MFIs are working in these geographies. Metrics calculation The geographical data submitted by the MFIs are available at an institution level on the MIX Market platform. For the index, the institution-level data are consolidated for each of the indicators at the district and state level. The five metrics have been calculated to measure the level of penetration as described above. 1. Loan coverage: Market coverage based on loans outstanding. Defined as: Number of loans outstanding / (Poor Population in the case of State and Illiterate population in the case of District). Relation: This metric has a direct relationship. If the value is higher it means the area has a relatively greater number of loan accounts. 2. Branch coverage: Market coverage based on MFI s infrastructure. Defined as: Number of branches / (Poor Population in the case of State and Illiterate population in the case of District). Relation: This metric has a direct relationship. If the value is higher it means the area will have a greater number of branches covered. 3. Loans per branch: Estimate of productivity in the area. Defined as: Number of loans outstanding / Number of branches. Relation: The relation is direct meaning districts/states with higher values correspond to more productive infrastructure. 4. Average loan balance: Average loan outstanding per clients. Defined as: Gross loan portfolio / Number of loans outstanding. Relation: In microfinance, the number of clients covered is more important than the portfolio size itself,
11 10 India Microfinance Geographical Index and the relatively small loan sizes are compensated by a higher number of clients covered. This metric is inversely related, as smaller average loan balances reduce debt load for clients. 5. Term of the credit: The credit term is calculated to derive an estimate of when the loan will be repaid by the client (in months); assuming the loan tenure will remain the same for every loan. Defined by: Gross loan portfolio x 3 5 / Amount of loans disbursed during the quarter. Relation: The relation of the credit term is direct meaning the longer the term of credit the lower the obligation of the debt service. With respect to the available data, the metrics highlighted above are used to create the index. Consistent data over the next quarter will introduce the ability to view the dynamic changes and trends across each metric. Scoring Pattern The districts and states have been grouped based on the ranges (explained below) and the aggregate calculation explained in the methodology. The scores of the index vary from state to district based on the geographic information submitted by the MFI for a particular quarter. It will change based on indicator information reported by the institutions. The scoring is calculated for three quarters: December 2014, March 2015, and June An option to drill down into the data points is also available for these time periods. The Microfinance Geographical Index is divided into the following categories that indicate different levels of geographical penetration: Geographical Index Level Geographical Index Score Highly Served District/State % score greater than 75% Served District/State % score between 50% to 75% Low served District/State % score between 25% to 50% Unserved District/State %score less than 25% Unclassified No Operations The geographical data has been submitted by MFIs at district/state level, but does not have complete indicator information that has been used for the calculation of the score and thus such district/state move into unclassified range. E.g. If an MFI has reported only two indicator information i.e. no. of loans outstanding and amount outstanding but failed to report number of branches and disbursement during the period at district/state level. District or the State which does not have any data reported by MFI for the period and thus is considered to have no business operation in the given place. 5. The loan disbursement value is a quarterly value and thus three represents number of months for the calculation of the credit term.
12 India Microfinance Geographical Index 11 Usefulness The Microfinance Geographical Index provides a new, detailed perspective for measuring the level of financial inclusion provided by the microfinance sector in India. The index identifies areas that have high concentrations of microfinance lending, and those areas which have less. Furthermore, the index enables MFIs to identify their current geographical reach, informing decisions to expand to provide services to new geographies. Additionally, funders that focus on priority-sector lending through MFIs can measure penetration levels and locate areas that are underserved Limitations There are a few limitations of the Microfinance Geographical Index that should be considered. First, the index is based on self-reported data from MFIs, and this data could vary on a quarterly based on the number of institutions that respond. Additionally, the calculation and analysis is restricted to four data points collect from each institutions, as listed above. It is also important to note that the number of institutions reporting at the state level differs from the number reporting at the district level. Finally, the index calculation is based on the geographical data for a particular quarter and, currently, there is no way to compare to an aggregate score of previous quarters.

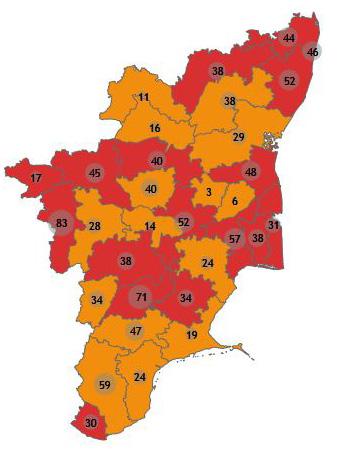
13 12 India Microfinance Geographical Index Microfinance Geographical Index results An analysis of MFI coverage at the state level The national coverage of microfinance institutions presents an aggregate view on the financial inclusion picture at the all India level, one that is useful for tracking broad policy goals in international forums. But a view on microfinance service access that is useful to policy makers and financial service providers alike within India must start at the state-level and dive deeper to uncover the variations across the vast territory and landscapes that make up India. The reasons for these variations are numerous, but having an accurate and up-to-date view of this subnational data helps uncover opportunities to expand operations in particular states while ensuring proper monitoring and regulation in others. The below map summarizes the microfinance penetration levels of the 35 states based on the index scores for March 2015 quarter. n n n n n n Highly Served (>75%) Served (50-75%) Low Served (25-50%) Unserved (<25%) Unclassified (Incomplete data) No Operations Map not to scale
14 India Microfinance Geographical Index 13 An analysis of index coverage at the state level For the quarter ending on March 31, 2015, there are fifteen states that are categorised as Served with scores ranging between 50% to 75%. Five of the 35 states and union territories in India are categorised as Highly Served while eight are classified as Low Served. One note of interest is that Delhi, which was under the Served classification as of December 31, 2014 moved up to the Highly Served category over the March 2015 quarter. Table 1 & Graph 1: The below table explains the total spread of states in the different index category. % of State coverage Mar -15 Category # of States # of States Dec -14 Mar -15 Highly served 5 5 Served Low Served 9 8 Unserved 4 3 Unclassified 0 1 No Operations 3 3 Total % 8% 3% 43% 9% 14% n Highly Served n Served n Low Served n Unserved n Unclassified n No Operations Top 5 states in each index category Highly Served (> 75% Score) Served (50% - 75% Score) Puducherry 88.2% Puducherry 72.5% Kerala 82.1% Kerala 69.3% Delhi 79.5% Delhi 65.9% Tamil Nadu 78.8% Tamil Nadu 64.5% Karnataka 77.7% Karnataka 62.6% Low Served (> 25% - 50% Score) Unserved (< 25% Score) Uttar Pradesh Madhya Pradesh Bihar 42.4% 39.2% 37.5% Nagaland Mizorom Manipur 14.6% 18.0% 22.5% Jharkhand 28.9% Jammu and Kashmir 27.3%

15 14 India Microfinance Geographical Index High concentration in the south region Some regions have higher concentrations of MFIs than others. Southern states, including Karnataka, Kerala, and Tamil Nadu have scores that place them within the Highly Served category for the period ending March 31, During that same period, Karnataka and Tamil Nadu rank among the top five states in terms of MFI coverage. Andhra Pradesh, a state that was classified as a Highly Served state in December 2014 quarter, dropped to the Served category by the end of March 2015 quarter. Karnataka - Highly served (78%) Out of 30 districts in Karnataka, 14 (almost 50%) districts are highly served. Dakishna Kannada and Shimoga being highest in terms of GLP of Rs. 570 and Rs. 517 crore respectively. Rest of the districts are rated as served category with Tumkur having the highest GLP of 410 crore. This concentration of service at the state level and across almost 50% of the districts warrants review by policy makers and MFIs, as it may indicate approaching saturation for microcredit across the state. States with broad MFI presence There are states that, for one reason or the other, have attracted more MFIs to set up operations. For example, Madhya Pradesh has the broadest MFI presence with 34 different MFIs operating within its borders. Maharashtra follows with 28 institutions, while Tamil Nadu, Karnataka, and Bihar are home to 25, 23, and 22 different MFIs, respectively. These microfinance institutions have around 5,115 branches and a loan size of approximately Rs. 23,019 crore during the first quarter of Number of MFIs by State Madhya Pradesh Maharashtra Tamil Nadu Karnataka Bihar Gujarat Uttar Pradesh West Bengal Chattisgarh Odisha Rajasthan Jharkhand Puducherry Uttarkhand Haryana Assam Delhi Kerala Andhra Pradesh Meghalaya Punjab Himachal Pradesh Tripura Goa Sikkim


16 India Microfinance Geographical Index 15 Higher outreach levels with low index score Several populous states totalling more than 12 crore people below the poverty line like Bihar, Madhya Pradesh and Uttar Pradesh have relatively low total service levels, despite large existing microfinance portfolios. Uttar Pradesh has received 42 percentage score that moves it to the low served category when compared to the poor population as the base. Madhya Pradesh has scored 39 percentage and Bihar has 38 percentage. Madhya Pradesh has scored low in terms of loan coverage per branch, where the institutions can target to expand further. Madhya Pradesh - Low served (39%) Madhya Pradesh, the state with the most institutions operating (34 Institution) had 797 branches and a loan portfolio of Rs. 2,371 crore as of March 2015 quarter. While the state is classified as low served, the majority of its districts reached the served level in the index. This stronger penetration in numerous districts and gap in service at the state level might indicate growth opportunities for the MFIs already present in the state. The state covers 2,450 loans per branch with no highly served district. It has a poor population of 2.34 crore (32% of total population). This could be the state to be looked at in coming quarters. North-eastern region As the map and state rankings clearly show, states in the north-eastern region such as Nagaland, Mizoram and Manipur earned low scores and are categorised as Unserved. Given the lack of reliable infrastructure, political uncertainty, and difficult terrain found in these states, the costs and challenges for MFIs operating in the area increases. States like Sikkim or Tripura that fall into the served category benefit from the presence of regional actors, such as Bandhan and RGVN that have built out their network in these adjacent states (based on the date summited to MIX as on March 2015 quarter). States with movement in Index category from December 2014 to March 2015 quarter Name of State / Union Territory 31-Dec Mar-15 Andaman and Nicobar Served Unclassified Andhra Pradesh Highly served Served Arunachal Pradesh Unserved Low Served Delhi Served Highly served Haryana Low Served Served Himachal Pradesh Unserved Low Served Manipur Low Served Unserved Odisha Low Served Served
17 16 India Microfinance Geographical Index District-level Analysis Just like the state-level analysis, viewing MFI coverage at the district level can illuminate additional insights and greater understanding of the financial inclusion realities found on the ground. The Microfinance Geographical Index calculation covers 642 districts across India and 67 microfinance institutions reported geographical data across these districts to MIX for March 2015 quarter. There is, however, a difference in the number of institutions that report state- and district-level information and, because of this; the respective data differ at the aggregate level. Thus, readers should keep in mind that there is incongruity between the state- and district-level analyses. n n n n n n Highly Served (>75%) Served (50-75%) Low Served (25-50%) Unserved (<25%) Unclassified (Incomplete data) No Operations Map not to scale
18 India Microfinance Geographical Index 17 A large number of district are Served in India In the March 2015 quarter, less than 8% of districts were classified as Highly Served, 41% as Served, and 25% as Low Served. Most of the Highly Served districts were from the states of Kerala, Karnataka, and Tamil Nadu (Graph 3). 262 districts in this time period fell into the Served category, an increase from 236 districts in the previous quarter. Table 2 & Graph 2: The below table explains the total spread of districts in the different index category. % of District coverage Mar -15 Category # of District # of District Dec -14 Mar -15 Highly served Served Low Served Unserved 12 9 Unclassified No Operations Total % 4% 21% 25% 8% 41% n Highly Served n Served n Low Served n Unserved n Unclassified n No Operations Top 5 districts in each index category Highly Served (> 75% Score) Served (50% - 75% Score) Bangalore Urban 91.8% Mathura 75.0% Mysore 90.2% Davanagere 75.0% Dakshina Kannada 89.2% Faridkot 74.7% Nilgiris 88.2% Agra 74.7% Chamarajnagar 87.9% Bagalkot 74.6% Low Served (> 25% - 50% Score) Unserved (< 25% Score) Ri Bhoi 50.0% Sitamarhi 24.7% Bhojpur 49.9% Pilibhit 24.1% Panchmahal 49.7% Jhabua 24.1% Betul 49.7% Palamu 23.7% Paschim Medinipur 49.5% Adilabad 23.2%
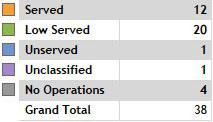
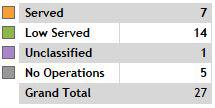
19 18 India Microfinance Geographical Index Concentration of Highly Served districts Unsurprisingly, the states which are categorised as Highly Served tend to be home to the districts that are also in the same category. For example, Tamil Nadu has a total of 32 districts, 17 of which are Highly Served and the other 15 being Served. Similarly, Karnataka has 14 districts that rank in the high category and Kerala has 11 districts. Thus these districts and states highlight the potential saturation in these areas. On the other hand index highlights state like Maharashtra which has only 2 district categories as highly served and drives MFIs to expand further in other districts Graph 3: Concentration of Highly Served Districts Tamil Nadu Karnataka Kerala Uttar Pradesh Maharashtra Puducherry Uttarakhand Uttar Pradesh state with highest number of districts in operation Uttar Pradesh has approximately 6 crore of poor population in the state covering 28% of the total poor population of the country. The state has highest number of district with MFI operations in 72 districts. During the March 2015 quarter, of the total districts count the state had 35 districts that were classified as Served and 27 districts classified as Low Served where MFIs have scope to increase its reach. Across the state, there are 16 different microfinance institutions in operation and a total of 903 branches, according to district level data reported during the March 2015 quarter. These MFIs registered a total of 2,575 loan accounts with a loan size of Rs. 3,340 crore during the same time period. Districts which moved to Highly served Index category from December 2014 to March 2015 quarter. S.no Name of District Name of State / UT 31-Dec Mar-15 1 Alappuzha Kerala Served Highly served 2 Bulandshahr Uttar Pradesh Served Highly served 3 Chikkaballapur Karnataka Served Highly served 4 Dindigul Tamil Nadu Served Highly served 5 Ernakulam Kerala Served Highly served 6 Haridwar Uttarakhand Served Highly served 7 Jhansi Uttar Pradesh Low Served Highly served 8 Kanchipuram Tamil Nadu Served Highly served 9 Kanyakumari Tamil Nadu Served Highly served 10 Karaikal Puducherry Unclassified Highly served
20 India Microfinance Geographical Index Kasaragod Kerala Unclassified Highly served 12 Kollam Kerala Served Highly served 13 Kottayam Kerala Served Highly served 14 Malappuram Kerala Unclassified Highly served 15 Palakkad Kerala Low Served Highly served 16 Pathanamthitta Kerala Unclassified Highly served 17 Thrissur Kerala Served Highly served 18 Vellore Tamil Nadu Served Highly served 19 Idukki Kerala No Operations Highly served 20 Thiruvananthapuram Kerala No Operations Highly served Districts which slipped from Highly served Index category from December 2014 to March 2015 quarter S.no Name of District Name of State / UT 31-Dec Mar-15 1 Agra Uttar Pradesh Highly served Served 2 Ahmedabad Gujarat Highly served Served 3 Bhopal Madhya Pradesh Highly served Served 4 Chitradurga Karnataka Highly served Served 5 Dewas Madhya Pradesh Highly served Served 6 Dharwad Karnataka Highly served Served 7 Gonda Uttar Pradesh Highly served Low Served 8 Indore Madhya Pradesh Highly served Served 9 Kaushambi Uttar Pradesh Highly served Served 10 Kolkata West Bengal Highly served Served 11 Meerut Uttar Pradesh Highly served Served 12 Pune Maharashtra Highly served Served 13 Saharanpur Uttar Pradesh Highly served Served 14 Sri Potti Sriramulu Nellore Andhra Pradesh Highly served Served 15 Tumkur Karnataka Highly served Served 16 Ujjain Madhya Pradesh Highly served Served


21 20 India Microfinance Geographical Index Top 10 states by GLP and its outreach information Karnataka: 31st March 2015 West Bengal: 31st March 2015 Map labeled with # of branches Map labeled with # of branches Tamil Nadu: 31st March 2015 Uttar Pradesh: 31st March 2015 Map labeled with # of branches Map labeled with # of branches


22 India Microfinance Geographical Index 21 Maharashtra: 31st March 2015 Bihar: 31st March 2015 Map labeled with # of branches Madhya Pradesh: 31st March 2015 Map labeled with # of branches Assam: 31st March 2015 Map labeled with # of branches Map labeled with # of branches


23 22 India Microfinance Geographical Index Odisha: 31st March 2015 Kerala: 31st March % 5% 7% 25% Map labeled with # of branches Map labeled with # of branches
24 India Microfinance Geographical Index 23 Conclusion Looking at microfinance institutions operations at the state and district levels provides a more composite picture on the coverage and gaps in the current microfinance landscape. The index has the potential to highlight areas of overconcentration that should be monitored for potential overheating, just as it can be used by MFIs in identifying areas for future growth potential. The insight generated through these and similar analyses can provide various financial inclusion stakeholders policymakers, regulators, operators, and others with the knowledge necessary to make informed, effective decisions. MIX will continue collecting this quarterly data through the Microfinance Geographical Index to provide an up-to-date viewpoint of MFI coverage across Indian states and districts. The refreshed data, presented through the online tool, will allow users to drill down into specific locations while also looking at trends over time. Through this, the intention is to provide the most accurate picture of microfinance coverage across India and enable industry actors to increase reach, monitor the market, and ensure a healthy environment for clients and operators alike.
25 24 India Microfinance Geographical Index Annexure State Name Highly served Low Served No Operations Served Unclassified Unserved Total Uttar Pradesh Madhya Pradesh Bihar Maharashtra Rajasthan Tamil Nadu Karnataka Odisha Assam Gujarat Jharkhand Andhra Pradesh Jammu and Kashmir Haryana Punjab West Bengal Chhattisgarh Arunachal Pradesh Kerala Uttarakhand Himachal Pradesh Nagaland Delhi 9 9 Manipur 9 9 Mizoram 8 8 Meghalaya Puducherry Sikkim Tripura Andaman and Nicobar Daman and Diu 2 2 Goa 2 2 Dadra and Nagar Haveli State with number of districts in each of the category as on March 2015 quarter 1 1 Lakshadweep 1 1 Total
26 India Microfinance Geographical Index 25 Sl. no State/UT Name # of Branches Indicators Loan Disbursed for the quarter (INR Crore) # of Loan Outstanding Indicators and Metric scores by state for March 2015 quarter Gross Loan Portfolio (INR Crore) Loan coverage (Total Poor Population) Metric Score Branch coverage (Total Poor Population) Loans per Branch Average Loan Balance Credit term Final Percentile Score Index Category 1 Karnataka 1,221 2, ,912,034 7, % 85% 100% 10% 93% 78% Highly served 2 West Bengal 1,517 3, ,763,430 6, % 82% 57% 58% 27% 61% Served 3 Tamil Nadu 1,368 2, ,615,457 6, % 91% 77% 65% 73% 79% Highly served 4 Uttar Pradesh 1,036 1, ,085,214 4, % 35% 43% 61% 37% 42% Low Served 5 Maharashtra 909 1, ,048,779 3, % 68% 70% 39% 57% 61% Served 6 Bihar 820 1, ,591,249 3, % 44% 60% 35% 7% 38% Low Served 7 Madhya Pradesh 797 1, ,952,549 2, % 50% 37% 42% 23% 39% Low Served 8 Assam 471 1, ,425,206 62% 71% 47% 74% 60% 63% Served 9 Odisha ,883,916 1, % 53% 87% 23% 40% 52% Served 10 Kerala ,397,907 1, % 88% 97% 55% 77% 82% Highly served 11 Gujarat ,519 1, % 59% 30% 71% 50% 52% Served 12 Andhra Pradesh ,520,136 1, % 77% 73% 3% 100% 66% Served 13 Rajasthan , % 47% 40% 77% 83% 57% Served 14 Jharkhand , % 32% 50% 16% 13% 29% Low Served 15 Haryana , % 65% 83% 45% 43% 60% Served 16 Tripura , % 94% 53% 94% 30% 72% Served 17 Delhi , % 56% 90% 87% 97% 79% Highly served 18 Uttarakhand , % 80% 63% 68% 53% 69% Served 19 Chhattisgarh , % 38% 23% 26% 17% 27% Low Served 20 Punjab , % 41% 93% 81% 10% 56% Served 21 Puducherry , % 97% 80% 100% 67% 88% Highly served 22 Meghalaya , % 62% 27% 90% 80% 61% Served 23 Sikkim , % 100% 7% 84% 47% 65% Served 24 Himachal Pradesh , % 30% 33% 13% 33% 27% Low Served 25 Goa , % 74% 20% 52% 87% 58% Served 26 Chandigarh , % 24% 67% 48% 90% 50% Served 27 Jammu and Kashmir , % 15% 13% 97% 0% 27% Low Served 28 Arunachal Pradesh , % 21% 0% 29% 63% 26% Low Served 29 Mizoram , % 27% 3% 19% 20% 18% Unserved 30 Manipur , % 12% 17% 32% 3% 15% Unserved 31 Nagaland , % 18% 10% 0% 70% 23% Unserved 32 Andaman and Nicobar % 9% 6% Unclassified 33 Dadra and Nagar Haveli % 9% No Operations 34 Daman and Diu % 9% No Operations 35 Lakshadweep % 9% No Operations
27 26 India Microfinance Geographical Index S.no. District Name State/UT Name # of Branches Indicators Loan Disbursed for the quarter (INR Crore) Indicators and Metric scores of Top 50 district by GLP for March 2015 quarter # of Loan Outstanding Gross Loan Portfolio (INR Crore) Loan coverage (Illterate Population) Branch coverage (Illterate Population) Metric Score Loans per Branch Average Loan Balance Credit term Final Percentile Score 1 Dakshina Kannada Karnataka , % 80% 100% 49% 95% 85% Highly served 2 Shimoga Karnataka , % 96% 99% 8% 92% 79% Highly served 3 Mysore Karnataka , % 94% 85% 84% 92% 90% Highly served 4 Belgaum Karnataka , % 92% 95% 17% 91% 78% Highly served 5 Tumkur Karnataka , % 95% 98% 3% 71% 73% Served 6 Bangalore Urban Karnataka , % 78% 95% 68% 76% 81% Highly served 7 Udupi Karnataka , % 84% 100% 1% 94% 76% Highly served 8 Davanagere Karnataka , % 98% 63% 94% 52% 81% Highly served 9 Coimbatore Tamil Nadu , % 99% 63% 70% 63% 78% Highly served 10 Thanjavur Tamil Nadu , % 98% 78% 79% 82% 87% Highly served 11 Chikkamagaluru Karnataka , % 93% 99% 7% 95% 79% Highly served 12 Cuddalore Tamil Nadu , % 94% 76% 91% 77% 86% Highly served 13 Nagpur Maharashtra , % 96% 67% 65% 55% 75% Highly served 14 Palakkad Kerala , % 97% 79% 83% 82% 87% Highly served 15 Thrissur Kerala , % 98% 93% 71% 81% 88% Highly served 16 Pune Maharashtra , % 81% 57% 82% 63% 73% Served 17 Tiruchirappalli Tamil Nadu , % 96% 60% 89% 58% 79% Highly served 18 Uttara Kannada Karnataka , % 49% 100% 9% 88% 69% Served 19 Madurai Tamil Nadu , % 98% 62% 58% 85% 80% Highly served 20 Chamarajnagar Karnataka , % 96% 81% 86% 93% 90% Highly served 21 Alappuzha Kerala , % 99% 84% 89% 73% 89% Highly served 22 Chennai Tamil Nadu , % 91% 41% 96% 85% 80% Highly served 23 Kolkata West Bengal , % 92% 87% 34% 59% 73% Served 24 Mandya Karnataka , % 90% 79% 85% 92% 88% Highly served 25 Hassan Karnataka , % 94% 87% 64% 87% 86% Highly served 26 Chitradurga Karnataka , % 95% 59% 86% 25% 72% Served 27 Saran Bihar , % 79% 76% 57% 62% 72% Served 28 Tirunelveli Tamil Nadu , % 95% 77% 25% 10% 61% Served 29 Allahabad Uttar Pradesh , % 77% 58% 68% 38% 64% Served 30 Patna Bihar , % 71% 75% 60% 44% 66% Served 31 Kanchipuram Tamil Nadu , % 91% 30% 93% 80% 76% Highly served 32 Chikkaballapur Karnataka , % 87% 81% 97% 92% 90% Highly served 33 Vellore Tamil Nadu , % 85% 65% 82% 71% 78% Highly served 34 Tiruvarur Tamil Nadu , % 100% 63% 83% 71% 83% Highly served 35 Tiruvallur Tamil Nadu , % 89% 47% 85% 80% 78% Highly served 36 Bulandshahr Uttar Pradesh , % 62% 89% 93% 54% 75% Highly served 37 Erode Tamil Nadu , % 93% 45% 82% 82% 78% Highly served 38 Kolhapur Maharashtra , % 96% 36% 37% 72% 66% Served 39 Thiruvananthapuram Kerala , % 89% 40% 98% 63% 75% Highly served 40 North 24 Parganas West Bengal , % 86% 31% 31% 39% 54% Served 41 Haveri Karnataka , % 100% 98% 1% 89% 77% Highly served 42 Muzaffarpur Bihar , % 80% 47% 48% 22% 55% Served 43 Tiruvannamalai Tamil Nadu , % 89% 21% 98% 51% 68% Served 44 Kollam Kerala , % 94% 77% 87% 34% 77% Highly served 45 Salem Tamil Nadu , % 85% 54% 80% 83% 77% Highly served 46 Virudhunagar Tamil Nadu , % 97% 56% 62% 12% 64% Served 47 Indore Madhya Pradesh , % 88% 62% 63% 23% 65% Served 48 Ahmedabad Gujarat , % 72% 28% 97% 84% 69% Served 49 Bellary Karnataka , % 88% 73% 39% 74% 73% Served 50 Nagapattinam Tamil Nadu , % 96% 69% 79% 79% 84% Highly served Index Category
28 ASIA REGIONAL OFFICE 801-A, 8th Floor, The Platina, BIT II, APHB Gachibowli, RR District Telangana India Tel: MICROFINANCE INFORMATION EXCHANGE, INC Pennsylvania Avenue, NW, #353 Washington, DC 20006, U.S.A. Tel: Fax: Web: I
According to the Census of India, rural
 AAJEEVIKA-A FRESH LEASE OF LIFE FOR THE RURAL PEOPLE Dr. Mukesh Kumar Shrivastava According to the Census of India, rural population constitutes 68.84 percent of the total population of the country. Though,
[For Admission Test to VI Class] Based on N.C.E.R.T. Pattern. By J. N. Sharma & T. S. Jain UPKAR PRAKASHAN, AGRA 2
![[For Admission Test to VI Class] Based on N.C.E.R.T. Pattern. By J. N. Sharma & T. S. Jain UPKAR PRAKASHAN, AGRA 2](/thumbs/71/65941921.jpg "[For Admission Test to VI Class] Based on N.C.E.R.T. Pattern. By J. N. Sharma & T. S. Jain UPKAR PRAKASHAN, AGRA 2") [For Admission Test to VI Class] Based on N.C.E.R.T. Pattern By J. N. Sharma & T. S. Jain 2015 UPKAR PRAKASHAN, AGRA 2 Publishers Dedicated to His Holiness Shri Nantin Maharaj Shyam Khet Nainital Hindi
[For Admission Test to VI Class] Based on N.C.E.R.T. Pattern By J. N. Sharma & T. S. Jain 2015 UPKAR PRAKASHAN, AGRA 2 Publishers Dedicated to His Holiness Shri Nantin Maharaj Shyam Khet Nainital Hindi
JOIN INDIAN COAST GUARD
 1 JOIN INDIAN COAST GUARD (MINISTRY OF DEFENCE) AS NAVIK (DOMESTIC BRANCH) 10 th ENTRY - 01/2018 BATCH APPLICATION WILL BE ACCEPTED ONLINE FROM 16 TO 23 OCT 2017 1. Applications are invited from Indian
National rural Health mission Ministry of Health and Family Welfare government of India, new delhi
 National rural Health mission Ministry of Health and Family Welfare government of India, new delhi Update on the ASHA Programme July 2011 C ontents Introduction... 1 1. Findings of the Recent Evaluations...
NAVODAYA VIDYALAYA SAMITI PROSPECTUS FOR JAWAHAR NAVODAYA VIDYALAYA SELECTION TEST- 2014
 NAVODAYA VIDYALAYA SAMITI PROSPECTUS FOR JAWAHAR NAVODAYA VIDYALAYA SELECTION TEST- 2014 1. NAVODAYA VIDYALAYA SCHEME 1.1 Introduction In accordance with the National Policy of Education (1986) Government
NAVODAYA VIDYALAYA SAMITI PROSPECTUS FOR JAWAHAR NAVODAYA VIDYALAYA SELECTION TEST- 2016
 NAVODAYA VIDYALAYA SAMITI PROSPECTUS FOR JAWAHAR NAVODAYA VIDYALAYA SELECTION TEST- 2016 1. NAVODAYA VIDYALAYA SCHEME 1.1 Introduction In accordance with the National Policy of Education (1986) Government
NAVODAYA VIDYALAYA SAMITI PROSPECTUS FOR JAWAHAR NAVODAYA VIDYALAYA SELECTION TEST- 2018
 NAVODAYA VIDYALAYA SAMITI PROSPECTUS FOR JAWAHAR NAVODAYA VIDYALAYA SELECTION TEST- 2018 1. NAVODAYA VIDYALAYA SCHEME 1.1 Introduction In accordance with the National Policy of Education (1986) Government
व रण क ए आ दन-पत र. Prospectus Cum Application Form. न दय व kऱय सम त. Navodaya Vidyalaya Samiti ਨਵ ਦ ਆ ਦਵਦ ਆਦ ਆ ਸਦ ਤ. Navodaya Vidyalaya Samiti
 व रण क ए आ दन-पत र ENGLISH / ह द / ਪ ਜ ਬ Prospectus Cum Application Form PROSPECTUS IS FREE OF COST न दय व kऱय सम त Navodaya Vidyalaya Samiti ਨਵ ਦ ਆ ਦਵਦ ਆਦ ਆ ਸਦ ਤ व रण क तन:श ल क Navodaya Vidyalaya Samiti
NAVODAYA VIDYALAYA SAMITI PROSPECTUS FOR JAWAHAR NAVODAYA VIDYALAYA SELECTION TEST- 2015
 NAVODAYA VIDYALAYA SAMITI PROSPECTUS FOR JAWAHAR NAVODAYA VIDYALAYA SELECTION TEST- 2015 1. NAVODAYA VIDYALAYA SCHEME 1.1 Introduction In accordance with the National Policy of Education (1986) Government
NAVODAYA VIDYALAYA SAMITI PROSPECTUS FOR JAWAHAR NAVODAYA VIDYALAYA SELECTION TEST- 2015
 NAVODAYA VIDYALAYA SAMITI PROSPECTUS FOR JAWAHAR NAVODAYA VIDYALAYA SELECTION TEST- 2015 1. NAVODAYA VIDYALAYA SCHEME 1.1 Introduction In accordance with the National Policy of Education (1986) Government
Ref. No.YFI/ Dated:
 YOGA FEDERATION OF INDIA (REGD. UNDER THE SOCIETIES REGISTRATION ACT. XXI OF 1860 REGD. NO.1195 DATED 14.02.90) RECOGNIZED BY INDIAN OLYMPIC ASSOCIATION - OCTOBER, 1998 TO FEBRUARY, 2011 Affiliated to
JAWAHAR NAVODAYA VIDYALAYA, RAKH JAGANOO DISTT:UDHAMPUR (J&K)
") JAWAHAR NAVODAYA VIDYALAYA, RAKH JAGANOO DISTT:UDHAMPUR (J&K) ADMISSION NOTICE It is notified for all the concerned Students, Parents, ZEO s and CEO of District Udhampur that JNVST-2018 entrance Exam which
JAWAHAR NAVODAYA VIDYALAYA, RAKH JAGANOO DISTT:UDHAMPUR (J&K) ADMISSION NOTICE It is notified for all the concerned Students, Parents, ZEO s and CEO of District Udhampur that JNVST-2018 entrance Exam which
Creating Teachers Communities of Learning. Report on the Subject Teacher Forum Program IT for Change
 Creating Teachers Communities of Learning Report on the Subject Teacher Forum Program IT for Change Table of Contents 1 Background...3 2 Goals of the programme...3 2.1 Subject Matter Expertise...3 2.2
STATUS OF OPAC AND WEB OPAC IN LAW UNIVERSITY LIBRARIES IN SOUTH INDIA
 CHAPTER - 5 STATUS OF OPAC AND WEB OPAC IN LAW UNIVERSITY LIBRARIES IN SOUTH INDIA 5.0. Introduction Library automation implies the application of computers and utilization of computer based products and
Literacy Level in Andhra Pradesh and Telangana States A Statistical Study
 The International Journal of Engineering and Science (IJES) Volume 6 Issue 6 Pages PP 70-77 2017 ISSN (e): 2319 1813 ISSN (p): 2319 1805 Literacy Level in Andhra Pradesh and Telangana States A Statistical
The Comparative Study of Information & Communications Technology Strategies in education of India, Iran & Malaysia countries
 Australian Journal of Basic and Applied Sciences, 6(9): 310-317, 2012 ISSN 1991-8178 The Comparative Study of Information & Communications Technology Strategies in education of India, Iran & Malaysia countries
NATIONAL INSTITUTE OF HOMOEOPATHY
 (i) (ii) (iii) No.8-012/NIH/DAVP/2012 NATIONAL INSTITUTE OF HOMOEOPATHY (An Autonomous Organisation) Govt. of India Ministry of AYUSH GE Block, Sector-III, Salt Lake, Kolkata-700106 Website: www.nih.nic.in
University Faculty Details Page on DU Web-site
 University Faculty Details Page on DU Web-site Title Dr. First Name Poonam Last Name Dass Photograph Designation Assistant Professor - Law Department Law Centre I, Faculty of Law Address (Campus) Law Centre
User education in libraries
 International Journal of Library and Information Science Vol. 1(1) pp. 001-005 June, 2009 Available online http://www.academicjournals.org/ijlis 2009 Academic Journals Review User education in libraries
Sl. No. Name of the Post Pay Band & Grade Pay No. of Post(s) Category
 Category") National Institute of Open Schooling (An autonomous organization under the Deptt. of School Education & Literacy, MHRD Govt. of India) A-24-25, Institutional Area, Sector 62, NOIDA- 201309, Uttar Pradesh
National Institute of Open Schooling (An autonomous organization under the Deptt. of School Education & Literacy, MHRD Govt. of India) A-24-25, Institutional Area, Sector 62, NOIDA- 201309, Uttar Pradesh
Pragmatic Constraints affecting the Teacher Efficacy in Ethiopia - An Analytical Comparison with India
 Pragmatic Constraints, Affecting the Teacher Surapaneni B. & Sisay S. 81 REVIEW ARTICLE Pragmatic Constraints affecting the Teacher Efficacy in Ethiopia - An Analytical Comparison with India Surapaneni
Bangalore Mysore Pondicherry Tirupati
 The Royal Cottage, Bangalore Palace, Vasanthanagar, Bangalore- 560 052. Tel: 080 23560387 / 23560389. scalinggreaterheights@gemsbschool.comw ww.gemsbschool.com Bangalore Mysore Pondicherry Tirupati About
TABLE OF CONTENTS SR.NO. TOPIC PAGE NUMBER. Institutes Thiruvananthapuram. Domain wise coaching. Institutes in Ernakulam/Cochin
 TABLE OF CONTENTS SR.NO. TOPIC PAGE NUMBER 1 Information About Kerala 2 2 Map of Kerala 3 3 Domain wise coaching Institutes Thiruvananthapuram 4 4 5 6 Domain wise coaching Institutes in Ernakulam/Cochin
EUROPEAN UNIVERSITIES LOOKING FORWARD WITH CONFIDENCE PRAGUE DECLARATION 2009
 EUROPEAN UNIVERSITIES LOOKING FORWARD WITH CONFIDENCE PRAGUE DECLARATION 2009 Copyright 2009 by the European University Association All rights reserved. This information may be freely used and copied for
Impact of Digital India program on Public Library professionals. Manendra Kumar Singh
 Manendra Kumar Singh Research Scholar, Department of Library & Information Science, Banaras Hindu University, Varanasi, Uttar Pradesh 221005 Email: manebhu007@gmail.com Abstract Digital India program is
GLOBAL MEET FOR A RESURGENT BIHAR
 GLOBAL MEET FOR A RESURGENT BIHAR 19-21 January, 2007, Patna Venue: Hotel Maurya, Patna Organised by Institute for Human Development and The Bihar Times In collaboration with Government of Bihar Organising
OPEN AND DISTANCE LEARNING (ODL) EDUCATION SYSTEM: PAST, PRESENT AND FUTURE A SYSTEMATIC STUDY OF AN ALTERNATIVE EDUCATION SYSTEM
 EDUCATION SYSTEM: PAST, PRESENT AND FUTURE A SYSTEMATIC STUDY OF AN ALTERNATIVE EDUCATION SYSTEM") Volume 3, No. 4, April 2012 Journal of Global Research in Computer Science REVIEW ARTICLE Available Online at www.jgrcs.info OPEN AND DISTANCE LEARNING (ODL) EDUCATION SYSTEM: PAST, PRESENT AND FUTURE
Volume 3, No. 4, April 2012 Journal of Global Research in Computer Science REVIEW ARTICLE Available Online at www.jgrcs.info OPEN AND DISTANCE LEARNING (ODL) EDUCATION SYSTEM: PAST, PRESENT AND FUTURE
HCFC Phase-Out Management Plan Servicing Sector
 Implemented by HCFC Phase-Out Management Plan Servicing Sector Roundtable Meeting 5 th March 2014 Seite 1 Implemented by HCFC Phase-Out Management Plan Servicing Sector Roundtable Meeting 5 th March 2014
Information Communication Technology (ICT) Infrastructure Facilities in Self-Financing Engineering College Libraries in Tamil Nadu
 Infrastructure Facilities in Self-Financing Engineering College Libraries in Tamil Nadu") University of Nebraska - Lincoln DigitalCommons@University of Nebraska - Lincoln Library Philosophy and Practice (e-journal) Libraries at University of Nebraska-Lincoln 3-2011 Information Communication
University of Nebraska - Lincoln DigitalCommons@University of Nebraska - Lincoln Library Philosophy and Practice (e-journal) Libraries at University of Nebraska-Lincoln 3-2011 Information Communication
International Branches
 Indian Branches Chandigarh Punjab Haryana Odisha Kolkata Bihar International Branches Bhutan Nepal Philippines Russia South Korea Australia Kyrgyzstan Singapore US Ireland Kazakastan Georgia Czech Republic
An Evaluation of E-Resources in Academic Libraries in Tamil Nadu
 An Evaluation of E-Resources in Academic Libraries in Tamil Nadu 1 S. Dhanavandan, 2 M. Tamizhchelvan 1 Assistant Librarian, 2 Deputy Librarian Gandhigram Rural Institute - Deemed University, Gandhigram-624
(Effective from )
") PADHO PARDESH - SCHEME OF INTEREST SUBSIDY ON EDUCATIONAL LOANS FOR OVERSEAS STUDIES FOR THE STUDENTS BELONGING TO THE MINORITY COMMUNITIES (Effective from 2013-14) GOVERNMENT OF INDIA MINISTRY OF MINORITY
PADHO PARDESH - SCHEME OF INTEREST SUBSIDY ON EDUCATIONAL LOANS FOR OVERSEAS STUDIES FOR THE STUDENTS BELONGING TO THE MINORITY COMMUNITIES (Effective from 2013-14) GOVERNMENT OF INDIA MINISTRY OF MINORITY
Dakar Framework for Action. Education for All: Meeting our Collective Commitments. World Education Forum Dakar, Senegal, April 2000
 Dakar Framework for Action Education for All: Meeting our Collective Commitments Text adopted by the World Education Forum Dakar, Senegal, 26-28 April 2000 Dakar Framework for Action Education for All:
A Pipelined Approach for Iterative Software Process Model
 A Pipelined Approach for Iterative Software Process Model Ms.Prasanthi E R, Ms.Aparna Rathi, Ms.Vardhani J P, Mr.Vivek Krishna Electronics and Radar Development Establishment C V Raman Nagar, Bangalore-560093,
The University of North Carolina Strategic Plan Online Survey and Public Forums Executive Summary
 The University of North Carolina Strategic Plan Online Survey and Public Forums Executive Summary The University of North Carolina General Administration January 5, 2017 Introduction The University of
Sl. No. Degree University % of Marks/Grade. 1 Ph.D. Commerce University of Kerala - 2 M.Phil.,, Grade A
 Curriculum Vitae Dr. Santhosh Kumar S. Professor (Finance) Year of Birth: 1969; Age 48 School of Management Studies Cochin University of Science and Technology Cochin, Kerala. India. PIN 682311 Mob. +91
A comparative study on cost-sharing in higher education Using the case study approach to contribute to evidence-based policy
 A comparative study on cost-sharing in higher education Using the case study approach to contribute to evidence-based policy Tuition fees between sacred cow and cash cow Conference of Vlaams Verbond van
Systematic Assessment and Monitoring leading to Improving Quality of Education
 Systematic Assessment and Monitoring leading to Improving Quality of Education Abstract This study was aimed at assessment of quality of teaching-learning process and impact of interventions on actual
Innovating Toward a Vibrant Learning Ecosystem:
 KnowledgeWorks Forecast 3.0 Innovating Toward a Vibrant Learning Ecosystem: Ten Pathways for Transforming Learning Katherine Prince Senior Director, Strategic Foresight, KnowledgeWorks KnowledgeWorks Forecast
Improving the impact of development projects in Sub-Saharan Africa through increased UK/Brazil cooperation and partnerships Held in Brasilia
 Image: Brett Jordan Report Improving the impact of development projects in Sub-Saharan Africa through increased UK/Brazil cooperation and partnerships Thursday 17 Friday 18 November 2016 WP1492 Held in
School Inspection in Hesse/Germany
 Hessisches Kultusministerium School Inspection in Hesse/Germany Contents 1. Introduction...2 2. School inspection as a Procedure for Quality Assurance and Quality Enhancement...2 3. The Hessian framework
The Rise of Results-Based Financing in Education 2015
 World Bank Group Education Global Practice Smarter Education Systems for Brighter Futures SNAPSHOT The Rise of Results-Based Financing in Education 2015 Education is one of the surest means we have to
1GOOD LEADERSHIP IS IMPORTANT. Principal Effectiveness and Leadership in an Era of Accountability: What Research Says
 B R I E F 8 APRIL 2010 Principal Effectiveness and Leadership in an Era of Accountability: What Research Says J e n n i f e r K i n g R i c e For decades, principals have been recognized as important contributors
A STUDY ON AWARENESS ABOUT BUSINESS SCHOOLS AMONG RURAL GRADUATE STUDENTS WITH REFERENCE TO COIMBATORE REGION
 A STUDY ON AWARENESS ABOUT BUSINESS SCHOOLS AMONG RURAL GRADUATE STUDENTS WITH REFERENCE TO COIMBATORE REGION S.Karthick Research Scholar, Periyar University & Faculty Department of Management studies,
STEPS TO EFFECTIVE ADVOCACY
 Poverty, Conservation and Biodiversity Godber Tumushabe Executive Director/Policy Analyst Advocates Coalition for Development and Environment STEPS TO EFFECTIVE ADVOCACY UPCLG Advocacy Capacity Building
Saiyad Nazia Fatima Rizvi* Department of Agri-Business Management, Lovely Professional University, Jalandhar, Punjab. Abstract
 Available online at http://www.nrjp.co.in Journal of Management Science, Operations & Strategies Vol. 1, Issue, 02. 18-28p, August, 2017 National Research & Journal Publication Research Article MBA Education
Early Warning System Implementation Guide
 Linking Research and Resources for Better High Schools betterhighschools.org September 2010 Early Warning System Implementation Guide For use with the National High School Center s Early Warning System
Assumption University Five-Year Strategic Plan ( )
") Assumption University Five-Year Strategic Plan (2014 2018) AU Strategies for Development AU Five-Year Strategic Plan (2014 2018) Vision, Mission, Uniqueness, Identity and Goals Au Vision Assumption University
Assumption University Five-Year Strategic Plan (2014 2018) AU Strategies for Development AU Five-Year Strategic Plan (2014 2018) Vision, Mission, Uniqueness, Identity and Goals Au Vision Assumption University
FY16 UW-Parkside Institutional IT Plan Report
 FY16 UW-Parkside Institutional IT Plan Report A. Information Technology & University Strategic Objectives [1-2 pages] 1. How was the plan developed? The plan is a compilation of input received from a wide
BUSINESS FINANCE 4265 Financial Institutions
 BUSINESS FINANCE 4265 Financial Institutions Professor: Prof. Bernadette A. Minton Office: 700E Fisher Hall Email: minton.15@fisher.osu.edu Phone: (614) 688 3125 Office Hours: Wednesdays, 1:00 pm 2:00
Management and monitoring of SSHE in Tamil Nadu, India P. Amudha, UNICEF-India
 Management and monitoring of SSHE in Tamil Nadu, India P. Amudha, UNICEF-India Photo: UNICEF India UNICEF and the Government of Tamil Nadu collaborated on scaling up the SSHE program in Tamil Nadu, a state
Understanding Co operatives Through Research
 Understanding Co operatives Through Research Dr. Lou Hammond Ketilson Chair, Committee on Co operative Research International Co operative Alliance Presented to the United Nations Expert Group Meeting
Davidson College Library Strategic Plan
 Davidson College Library Strategic Plan 2016-2020 1 Introduction The Davidson College Library s Statement of Purpose (Appendix A) identifies three broad categories by which the library - the staff, the
National and Regional performance and accountability: State of the Nation/Region Program Costa Rica.
 National and Regional performance and accountability: State of the Nation/Region Program Costa Rica. Miguel Gutierrez Saxe. 1 The State of the Nation Report: a method to learn and think about a country.
Wright State University
 CORE Scholar Brochures University Archives January 1973 Follow this and additional works at: http://corescholar.libraries.wright.edu/ archives_wsu_brochures Repository Citation (1973)... This Brochure
B.A.B.Ed (Integrated) Course
 Course") 1 University of Pune B.A.B.Ed (Integrated) Course Objectives of the B.A.B.Ed (Integrated) Course :- To enable the student teacher 1. to promote capabilities for inculcating national values and goals as
1 University of Pune B.A.B.Ed (Integrated) Course Objectives of the B.A.B.Ed (Integrated) Course :- To enable the student teacher 1. to promote capabilities for inculcating national values and goals as
Implementation Status & Results Honduras Honduras Education Quality, Governance, & Institutional Strengthening (P101218)
") Public Disclosure Authorized Public Disclosure Authorized The World Bank Implementation Status & Results Honduras Honduras Education Quality, Governance, & Institutional Strengthening (P101218) Operation
Public Disclosure Authorized Public Disclosure Authorized The World Bank Implementation Status & Results Honduras Honduras Education Quality, Governance, & Institutional Strengthening (P101218) Operation
The Gandhigram Rural Institute Deemed University Gandhigram
 The Gandhigram Rural Institute Deemed University Gandhigram 624 302 1. Dean Dayal Upadhyay KAUSHAL Kendra (DDU - KK) The University Grants Commission (UGC) has launched a scheme based on skills development
CURRICULUM VITAE. To develop expertise in Graph Theory and expand my knowledge by doing Research in the same.
 Mrs. JESSICA PEREIRA. BITS Pilani KK Birla Goa Campus. Qtr No. D - 122, Mathematics Department. NH 17B Zuarinagar Goa 403726 India. Office: +91-832-2580445 Mobile: +919921004218 Email: jessica@goa.bits-pilani.ac.in
About the College Board. College Board Advocacy & Policy Center
 15% 10 +5 0 5 Tuition and Fees 10 Appropriations per FTE ( Excluding Federal Stimulus Funds) 15% 1980-81 1981-82 1982-83 1983-84 1984-85 1985-86 1986-87 1987-88 1988-89 1989-90 1990-91 1991-92 1992-93
BASIC EDUCATION IN GHANA IN THE POST-REFORM PERIOD
 BASIC EDUCATION IN GHANA IN THE POST-REFORM PERIOD By Abena D. Oduro Centre for Policy Analysis Accra November, 2000 Please do not Quote, Comments Welcome. ABSTRACT This paper reviews the first stage of
GOING GLOBAL 2018 SUBMITTING A PROPOSAL
 GOING GLOBAL 2018 SUBMITTING A PROPOSAL Going Global provides an open forum for world education leaders those in the noncompulsory education sector with decision making responsibilities to debate issues
International Journal of Library and Information Studies
 CONTINUING PROFESSIONAL DEVELOPMENT FOR LIBRARY SEMI-PROFESSIONALS IN CENTRAL UNIVERSITY LIBRARIES OF INDIA AJEEMSHA S Research Scholar Department of Library & Information Science, University of Delhi,Delhi-110007
Educational system gaps in Romania. Roberta Mihaela Stanef *, Alina Magdalena Manole
 Available online at www.sciencedirect.com ScienceDirect Procedia - Social and Behavioral Scien ce s 93 ( 2013 ) 794 798 3rd World Conference on Learning, Teaching and Educational Leadership (WCLTA-2012)
i didnt do my homework poem
 I didnt do my homework poem. Whichever kind of home loan you select, make sure to do your homework just before making a final decision. But the fact that not everyone likes the same thing is actually a
PROJECT PERIODIC REPORT
 D1.3: 2 nd Annual Report Project Number: 212879 Reporting period: 1/11/2008-31/10/2009 PROJECT PERIODIC REPORT Grant Agreement number: 212879 Project acronym: EURORIS-NET Project title: European Research
Interview on Quality Education
 Interview on Quality Education President European University Association (EUA) Ultimately, education is what should allow students to grow, learn, further develop, and fully play their role as active citizens
Stakeholder Debate: Wind Energy
 Activity ENGAGE For Educator Stakeholder Debate: Wind Energy How do stakeholder interests determine which specific resources a community will use? For the complete activity with media resources, visit:
Integration of ICT in Teaching and Learning
 Integration of ICT in Teaching and Learning Dr. Pooja Malhotra Assistant Professor, Dept of Commerce, Dyal Singh College, Karnal, India Email: pkwatra@gmail.com. INTRODUCTION 2 st century is an era of
Software Maintenance
 1 What is Software Maintenance? Software Maintenance is a very broad activity that includes error corrections, enhancements of capabilities, deletion of obsolete capabilities, and optimization. 2 Categories
MEASURING GENDER EQUALITY IN EDUCATION: LESSONS FROM 43 COUNTRIES
 GIRL Center Research Brief No. 2 October 2017 MEASURING GENDER EQUALITY IN EDUCATION: LESSONS FROM 43 COUNTRIES STEPHANIE PSAKI, KATHARINE MCCARTHY, AND BARBARA S. MENSCH The Girl Innovation, Research,
EDUCATION. Graduate studies include Ph.D. in from University of Newcastle upon Tyne, UK & Master courses from the same university in 1987.
 Dr. Khaled A. Abbas: SYNOPSIS Director (Dean) Egypt National Institute of Transport Ministry of Transport - Professor of Transportation Policy, Planning & Modeling, Traffic Eng. & Logistics Management
EUA Quality Culture: Implementing Bologna Reforms
 UNIVERSITY OF TAMPERE FINLAND EUA Quality Culture: Implementing Bologna Reforms 1. What is my university s concept of a quality reform with respect to the Bologna process? Note: as for detailed specification
Post-intervention multi-informant survey on knowledge, attitudes and practices (KAP) on disability and inclusive education
 on disability and inclusive education") Leonard Cheshire Disability and Inclusive Development Centre University College London Promoting the provision of inclusive primary education for children with disabilities in Mashonaland, West Province,
Leonard Cheshire Disability and Inclusive Development Centre University College London Promoting the provision of inclusive primary education for children with disabilities in Mashonaland, West Province,
Kenya: Age distribution and school attendance of girls aged 9-13 years. UNESCO Institute for Statistics. 20 December 2012
 1. Introduction Kenya: Age distribution and school attendance of girls aged 9-13 years UNESCO Institute for Statistics 2 December 212 This document provides an overview of the pattern of school attendance
Mehul Raithatha. Education Qualifications
 Mehul Raithatha Associate Professor, Finance and Accounting Area Indian Institute of Management Indore Mobile: +91-9677089379/9867851295 Email: mehulr@iimidr.ac.in/mehular83@gmail.com Education Qualifications
VOL VISION 2020 STRATEGIC PLAN IMPLEMENTATION
 VOL VISION 2020 STRATEGIC PLAN IMPLEMENTATION CONTENTS Vol Vision 2020 Summary Overview Approach Plan Phase 1 Key Initiatives, Timelines, Accountability Strategy Dashboard Phase 1 Metrics and Indicators
INSTRUCTION MANUAL. Survey of Formal Education
 INSTRUCTION MANUAL Survey of Formal Education Montreal, January 2016 1 CONTENT Page Introduction... 4 Section 1. Coverage of the survey... 5 A. Formal initial education... 6 B. Formal adult education...
BENCHMARK TREND COMPARISON REPORT:
 National Survey of Student Engagement (NSSE) BENCHMARK TREND COMPARISON REPORT: CARNEGIE PEER INSTITUTIONS, 2003-2011 PREPARED BY: ANGEL A. SANCHEZ, DIRECTOR KELLI PAYNE, ADMINISTRATIVE ANALYST/ SPECIALIST
Governors and State Legislatures Plan to Reauthorize the Elementary and Secondary Education Act
 Governors and State Legislatures Plan to Reauthorize the Elementary and Secondary Education Act Summary In today s competitive global economy, our education system must prepare every student to be successful
Examinee Information. Assessment Information
 A WPS TEST REPORT by Patti L. Harrison, Ph.D., and Thomas Oakland, Ph.D. Copyright 2010 by Western Psychological Services www.wpspublish.com Version 1.210 Examinee Information ID Number: Sample-02 Name:
Abstract. Janaka Jayalath Director / Information Systems, Tertiary and Vocational Education Commission, Sri Lanka.
 FEASIBILITY OF USING ELEARNING IN CAPACITY BUILDING OF ICT TRAINERS AND DELIVERY OF TECHNICAL, VOCATIONAL EDUCATION AND TRAINING (TVET) COURSES IN SRI LANKA Janaka Jayalath Director / Information Systems,
COMMISSIONER AND DIRECTOR OF SCHOOL EDUCATION ANDHRA PRADESH :: HYDERABAD NOTIFICATION FOR RECRUITMENT OF TEACHERS 2012
 COMMISSIONER AND DIRECTOR OF SCHOOL EDUCATION ANDHRA PRADESH :: HYDERABAD NOTIFICATION FOR RECRUITMENT OF TEACHERS 2012 INFORMATION BULLETIN 1. In pursuance of the orders of the Government in G.O.Ms.No.159,
National Institute of Technology, Tiruchirappalli: Performa for CV of Faculty/ Staff Members
 Curriculum Vitae Brief Profile: (not exceeding 500 words) Dr. S. Mekala is an Assistant Professor of English in the Department of Humanities at National Institute of Technology, Tiruchirapalli. She earned
https://secure.aacte.org/apps/peds/print_all_forms.php?view=report&prin...
 1 of 35 4/25/2012 9:56 AM A» 2011 PEDS» Institutional Data inst id: 3510 Institutional Data A_1 Institutional Information This information will be used in all official references to your institution. Institution
June 15, 1962 in Shillong, Meghalaya, India. Address: Civil Dept, Assam Engineering College, Guwahati
 Curriculum vitae BINU SHARMA Personal data Name: Binu Sharma Born: June 15, 1962 in Shillong, Meghalaya, India Nationality: Indian Address: Civil Dept, Assam Engineering College, Guwahati 781013 Professional
BREAST FEEDING: ADVOCACY & PRACTICE COURSE. November 21 December 4, 2010 A REPORT
 BREAST FEEDING: ADVOCACY & PRACTICE COURSE November 21 December 4, 2010 A REPORT Background A workshop on Breastfeeding Advocacy and Practice Course was organized by BRD Medical College, Gorakhpur in collaboration
Nearing Completion of Prototype 1: Discovery
 The Fit-Gap Report The Fit-Gap Report documents how where the PeopleSoft software fits our needs and where LACCD needs to change functionality or business processes to reach the desired outcome. The report
Current Issues in Comparative Education
 Current Issues in Comparative Education Volume 12(2) / Spring 2010 ISSN 1523-1615 http://www.tc.edu/cice EDITORIAL INTRODUCTION 3 Education and Economic Crises Andrew K. Shiotani ARTICLES Education and
Global Institute of Public Health
 Global Institute of Public Health Public health institute under Ananthapuri Educational Trust NH Bypass, Trivandrum, Kerala 695024 Affiliated to the Kerala University for Health Sciences (KUHS) Master
Central Institute of Educational Technology (CIET)
") Central Institute of Educational Technology (CIET) 13.01 Pilot Study of using Mobile Devices for Delivery of Educational Content and Interaction with the Students : To explore the possibilities of delivering
Central Institute of Educational Technology (CIET) 13.01 Pilot Study of using Mobile Devices for Delivery of Educational Content and Interaction with the Students : To explore the possibilities of delivering
STRATEGIC GROWTH FROM THE BASE OF THE PYRAMID
 Executive Education STRATEGIC GROWTH FROM THE BASE OF THE PYRAMID This innovative, new five-day program shares key strategies, frameworks and processes that helps companies build sustainable, scalable businesses
Navitas UK Holdings Ltd Embedded College Review for Educational Oversight by the Quality Assurance Agency for Higher Education
 Navitas UK Holdings Ltd Embedded College Review for Educational Oversight by the Quality Assurance Agency for Higher Education February 2014 Annex: Birmingham City University International College Introduction
How Living Costs Undermine Net Price As An Affordability Metric
 How Living Costs Undermine Net Price As An Affordability Metric Braden J. Hosch, Ph.D. Asst. Vice President for Institutional Research, Planning & Effectiveness Association for Institutional Research Annual
Team Dispersal. Some shaping ideas
 Team Dispersal Some shaping ideas The storyline is how distributed teams can be a liability or an asset or anything in between. It isn t simply a case of neutralizing the down side Nick Clare, January
WORKSHOP. technologies
 RISE Research Industrial Systems Engineering presents WORKSHOP on mobile Android Development technologies An RISE event hosted by sanskrithi group of institutions 04 th I 02 I 2017 01 Abstract 660 million
MSW POLICY, PLANNING & ADMINISTRATION (PP&A) CONCENTRATION
 CONCENTRATION") MSW POLICY, PLANNING & ADMINISTRATION (PP&A) CONCENTRATION Overview of the Policy, Planning, and Administration Concentration Policy, Planning, and Administration Concentration Goals and Objectives Policy,
MSW POLICY, PLANNING & ADMINISTRATION (PP&A) CONCENTRATION Overview of the Policy, Planning, and Administration Concentration Policy, Planning, and Administration Concentration Goals and Objectives Policy,
Scoring Guide for Candidates For retake candidates who began the Certification process in and earlier.
 Adolescence and Young Adulthood SOCIAL STUDIES HISTORY For retake candidates who began the Certification process in 2013-14 and earlier. Part 1 provides you with the tools to understand and interpret your
e-prospectus for Short-term Training Programme
 NETAJI SUBHAS OPEN UNIVERSITY School of Professional Studies e-prospectus for Short-term Training Programme Headquarters Academic Campus DD-26, Sector-I, Salt Lake, Ghosh Para Station Road Kolkata-700064
Best Practices in Internet Ministry Released November 7, 2008
 Best Practices in Internet Ministry Released November 7, 2008 David T. Bourgeois, Ph.D. Associate Professor of Information Systems Crowell School of Business Biola University Best Practices in Internet