Georgia s 2015 College and Career Ready Performance Index (CCRPI) Data Calculation Guide For Principals and District Users
|
|
|
- Gyles Wheeler
- 6 years ago
- Views:
Transcription

1 Georgia s 2015 College and Career Ready Performance Index (CCRPI) Data Calculation Guide For Principals and District Users June 2, 2015 Page 1 of 61
2 Table of Contents Overview 3 Overall Score 3 Achievement Indicators 4 Assessment Data 8 Course Numbering System Legend 8 Data Source for Calculations CCRPI Quick Reference Guide 10 High Schools 10 Content Mastery Indicators 10 Participation Rate 10 Meets & Exceeds Rate 11 Post high School Readiness Indicators 12 Graduation Rate Indicators 15 Middle Schools 16 Content Mastery Indicators 16 Participation Rate 16 Meets & Exceeds Rate 17 Post Middle School Readiness Indicators 18 Predictor for High School Graduation Indicators 20 Elementary Schools 21 Content Mastery Indicators 21 Participation Rate 21 Meets & Exceeds Rate 21 PK-1 and PK-2 Schools 22 K-Only Schools 23 Post Elementary School Readiness Indicators 23 Predictor for High School Graduation Indicators 25 Exceeding the Bar (ETB) Indicators 27 High School ETBs 27 Middle School ETBs 31 Elementary School ETBs 34 Scoring 37 Indicator Calculations 37 Achievement Points 38 Progress Points 40 Achievement Gap Points 41 Performance Flags 42 Challenge Points 43 ED/EL/SWD Performance Points 43 Exceeding the Bar Points 44 CCRPI Score 45 District and State CCRPI Scores 46 Star Ratings for School Climate 48 June 2, 2015 Page 2 of 61
3 Overview The College and Career Ready Performance Index (CCRPI) is Georgia s statewide accountability system, implemented in 2012 to replace the No Child Left Behind (NCLB) Adequate Yearly Progress (AYP) measurement, after the U.S. Department of Education granted Georgia s waiver from NCLB on Feb. 9, The CCRPI measures schools and school districts on an easy-to-understand 100-point scale, helping parents and the public better understand how schools are performing in a more comprehensive manner than the pass/fail system previously in place under AYP. The purpose of this guide is to provide detailed information on the calculations and data sources utilized to populate the CCRPI reports to school and district leaders. The CCRPI calculations rely heavily on data submitted annually in Student Record (SR). Many of the calculations utilize the current year s SR data as well as SR data submitted in previous years. It is important to note that accuracy of data submitted in SR is critical as it relates to the accuracy of the CCRPI reports. Initially, not all of the data needed to populate the reports were submitted via SR. Therefore, an additional data collection occurred to obtain the needed data. For the 2012, 2013, and 2014 school years, additional data were collected via the CCRPI Data Collections application. Over time, data collected in the CCRPI Data Collections application have been migrated to SR. Other applications utilized to collect/prepare data for the reports include the following: Assessment Matching, Summer Graduate Collection, Cohort Withdrawal Update, and Non-Participation Collection. Overall Score The overall CCRPI score is based on a 100-point scale. This is intentional as the public, generally speaking, understands a 100-point scale. There are three main features that comprise the CCRPI score: 1. Achievement = 60 points a. Content Mastery = 40% b. Post Elementary/Middle/High School Readiness = 30% c. Graduation Rate/Predictor for High School Graduation = 30% 2. Progress = 25 points 3. Achievement Gap = 15 points Every school has the opportunity to earn up to 10 additional points towards the overall score. These points are called Challenge Points. There are two ways in which schools may earn Challenge Points: 1. ED/EL/SWD Performance Points 2. Exceeding the Bar (ETB) Points The final score for a school is derived by adding the points earned for Achievement, Progress, Achievement Gap, and Challenge Points. Below is a screen shot for the 2013 state level CCRPI report for High Schools. Details for scoring each component as well as the overall score are provided later in this document. June 2, 2015 Page 3 of 61
, and high (9-12)) and have been approved by the State Board of Education.")
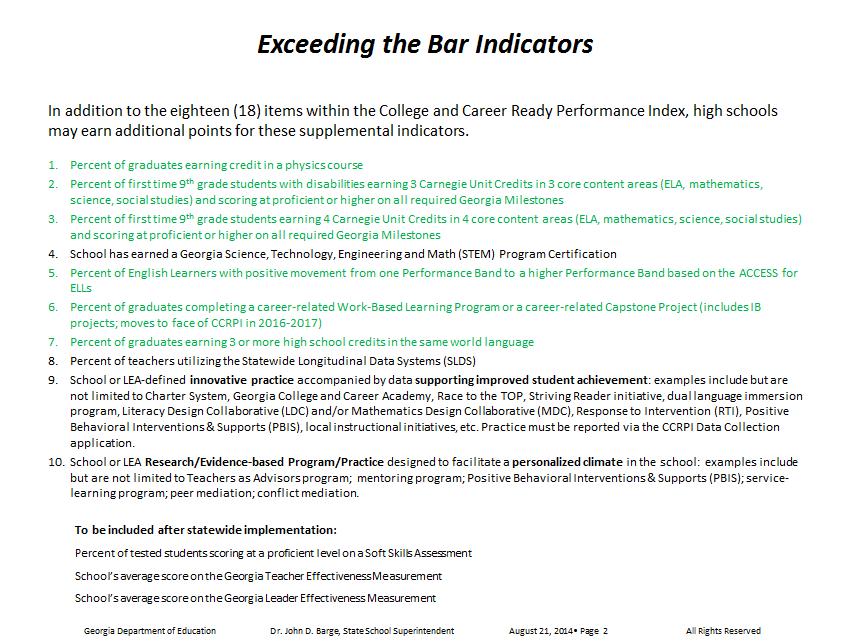
4 Achievement Achievement indicators, as well as Exceeding the Bar (ETB) indicators, were developed for each grade band (elementary (K-5), middle (6-8), and high (9-12)) and have been approved by the State Board of Education. Below is a listing of all approved indicators: June 2, 2015 Page 4 of 61

5 June 2, 2015 Page 5 of 61

6 June 2, 2015 Page 6 of 61

7 June 2, 2015 Page 7 of 61
8 Assessment Data Assessment data are prominently utilized in the CCRPI. They are utilized in the Achievement, Progress, Achievement Gap, ED/EL/SWD Performance, and Exceeding the Bar indicator calculations. The assessments utilized in CCRPI calculations are as follows: Georgia Milestones End of Grade (EOG) Georgia Milestones End of Course (EOC) o 9 th Grade Literature and Composition o American Literature and Composition o Coordinate Algebra o Analytic Geometry o Biology o Physical Science o United States History o Economics/Business/Free Enterprise Georgia High School Writing Test (GHSWT) Georgia Alternate Assessment (GAA) Assessing Comprehension and Communication in English State to State for English Language Learners (ACCESS for ELLs) Alternate Assessing Comprehension and Communication in English State to State for English Language Learners (Alternate ACCESS for ELLs) Once the state level assessment files are received from the vendor, the assessment data are matched to SR. In other words, the assessment belonging to Johnny Smith is matched to Johnny Smith s student record. That way, all of Johnny s demographic information that is found within SR, is tagged to his assessment. This allows the GaDOE to calculate subgroup data using all state assessments. Assessments taken any time during the school year as well as during the June/July summer administration are utilized for CCRPI calculations. This includes the use of retests. Course Numbering System Legend Many of the CCRPI indicators rely on students passing courses or earning credit in courses. Therefore, course numbers as submitted in SR are crucial. The Data Collections division has developed a standard course numbering system for all State Board approved courses. The numbering system consists of 9 numerical digits plus a decimal. The decimal is located after the first 2 numerical digits, with 7 numerical digits to the right of the decimal X X. X X X X X X X The 2 numerical digits to the LEFT of the decimal designate the main subject area field. EXAMPLES: 23.XXXXXXX = ENGLISH LANGUAGE ARTS 27.XXXXXXX = MATHEMATICS The first numerical digit to the RIGHT of the decimal identifies the type of instruction. June 2, 2015 Page 8 of 61
9 The following is a list of the codes for the first numerical digit to the right of the decimal. XX.0 0 = REGULAR XX.1 1 = REMEDIAL XX.2 2 = GIFTED XX.3 3 = DISTANCE LEARNING XX.4 4 = ONE HOUR LAB XX.5 5 = TWO HOUR LAB XX.6 6 = THREE HOUR LAB XX.7 7 = WORK BASED LEARNING XX.8 8 = SPECIAL EDUCATION (students whose IEP has placed them in a general education course but in a special education setting and are being taught by a certified special education teacher. Students in these classes are earning Carnegie unit credit). XX.9 9 = SPECIAL EDUCATION with support (Students whose IEP has placed them in a general education course in a general education setting but with a specified amount and model of special education support listed on the IEP. Students are taught by a certified general education teacher but receive the identified IEP support by the appropriately certified special education personnel. Students in these classes are earning Carnegie unit credit). The second numerical digit to the RIGHT of the decimal identifies the minor subject area. EXAMPLE: 60.07XXXXX = ROMANCE LANGUAGES, HIGH SCHOOL SPANISH The third and fourth numerical digits to the RIGHT of the decimal identify the specific course or subject. EXAMPLE: XXX = ROMANCE LANGUAGES, HIGH SCHOOL SPANISH, SPANISH I EXAMPLE: XXX = ROMANCE LANGUAGES, HIGH SCHOOL SPANISH, SPANISH VII The fifth numerical digit to the RIGHT of the decimal is reserved for State use and to identify transferred course credit. When used to identify transferred credit, use the legend below XX = RESERVED FOR STATE USE XX = RESERVED FOR STATE USE XX = DESIGNATES A LOCALLY FUNDED COURSE XX = CREDIT IN LIEU OF ENROLLMENT XX = JOINT ENROLLMENT POSTSECONDARY OPTION CREDIT XX = JOINT ENROLLMENT PRIVATE INSTITUTION CREDIT XX = OUT OF STATE PUBLIC SCHOOLS CREDIT (ACCREDITED AND NONACCREDITED) XX = PRIVATE (IN STATE AND OUT OF STATE) SCHOOL CREDIT (ACCREDITED AND NONACCREDITED) XX = OUT OF U.S.A. CREDIT EXAMPLE: XX = LIFE SCIENCES, BIOLOGY, HUMAN ANATOMY/PHYSIOLOGY, POST SECONDARY OPTION (PSO) COURSE The sixth and seventh numerical digits to the RIGHT of the decimal are reserved for local system use. June 2, 2015 Page 9 of 61
10 Course numbers which do not match this numbering convention or align with courses contained in State Board Rule are not utilized in CCRPI calculations. Data Source for Calculations CCRPI Date Element Quick Reference Guide The data elements which are used for CCRPI calculations and their corresponding data source may be found on Accountability s web page under Accountability Resources in the document titled 2015 CCRPI Data Element Quick Reference Guide. High Schools Content Mastery Indicators The calculations for the Content Mastery indicators use assessment and course data for high schools. Principals, district users, and superintendents have access to their CCRPI reports within the secure MyGaDOE portal. Once the portal report has been accessed, the user can click on the Data Details tab of the CCRPI report to access all of the content area data files. These data files contain the names and demographic information for each student enrolled in the school for that school year. The assessment scale score earned is also found in the file along with multiple other data elements. Course numbers, as submitted in SR, are reviewed to identify the students who are enrolled in EOC courses in grades Participation Rate Using the content area Data Detail file (located within the school s CCRPI report in the GaDOE portal) and filtering on the Test Enrollment and Test Participant the user can obtain the values used for the participation rate calculations. High school students who are course enrolled and have a final grade in the course are expected to test and are flagged as Test Enrollment = Yes. Students who participate in the assessment are flagged as Test Participant = Yes. Participation Rate = Test Participant/Test Enrollment Students who are expected to test and miss the main administration of the assessment but sit for the retest administration are included in the participation rate calculation. A middle school student s EOC score is utilized for the high school s participation rate (the following year) provided the student was enrolled in the same district for middle and high school. In this event, the count of assessments taken at the middle school is added to both the numerator and denominator of the high school s participation rate. June 2, 2015 Page 10 of 61
11 The count of grade 11 students flagged in SR as Students with Disabilities (SWD) and flagged as taking a GAA is also added to both the numerator and denominator of the high school s participation rate. Students coded with the following non-participation reasons are not included in the denominator of the participation rate calculation: Medical Emergency EOC Course Not Completed EOC Course Not Taken for Core Credit EOC Administered Previously Students who are transferring credit as identified by the Teacher ID numbers of and are not included in the participation rate calculation. Meets & Exceeds Rate The Meets & Exceeds rate for each content area is based on students who are considered Full Academic Year (FAY). For high school students, FAY is calculated by determining if a student was enrolled in a course 65% of the number of days from the start date of the course to the end date of the course. Students taking a GAA are considered FAY if they are enrolled 65% of the number of days from the first day of school to the close of the GAA window. Because districts across the state do not have a common start date, common end date, or common holidays, a Julian calendar is used to calculate the number of days from the start of the course to the end of the course. The start and end dates used are provided by districts in the FTE Survey. Below are the steps and a link to a web-based Julian calendar which can be used to calculate the number of days required for a student to be enrolled to be considered FAY: 1. For high schools, key the start date and end date of the course, as reported in the FTE Survey, into a Julian calendar calculator. 2. Subtract the Julian Day number for the start date from the end date. 3. Multiply the difference by 0.65 (65%). 4. Round the product up to the nearest whole number. a rounds to 189 b rounds to This value represents the number of days a student needs to be enrolled in the school to be considered FAY. For students taking a GAA, the counts for each subject assessment are mapped to EOC subject assessments: GAA ELA is mapped to American Literature EOC GAA math is mapped to Geometry EOC GAA science is mapped to Biology EOC GAA social studies is mapped to US History EOC FAY students with a test score are utilized for the Meets & Exceeds rate calculation. If a FAY student has a retest score, then the highest score is pulled for this calculation. June 2, 2015 Page 11 of 61
12 If a 9 th grade student has an EOC score from the previous 8 th grade year, then that score is included in the calculation provided the student remains in the same school district for both the 8 th and 9 th grade years. The count of students who meet the criteria for Credit in Lieu of Course, State Board Rule , is added to both the numerator and denominator count for this calculation. English Learners (EL) are removed from the Meets & Exceeds rate calculations if the following criteria are met: Student is coded as EL in SR and Student is coded as First Year in US and Student is coded as having a primary language other than English and Student has an ACCESS composite score Using the content area Data Detail file and filtering on the FAY Participant = Yes and Performance Code = ADV and PRO as described in the Content Mastery table above, the user can obtain the values used for the performance calculations. Meets & Exceeds Rate = Performance Code (ADV & PRO)/FAY Participant Post High School Readiness Indicators Indicator 9: Percent of graduates completing a CTAE pathway, or an advanced academic pathway, or a fine arts pathway, or a world language pathway within their program of study Guidance documents for the described pathways are posted on Accountability s web page. These documents list the specific courses and associated course numbers required for each pathway. The graduates used for this calculation are not restricted to a cohort. They may have graduated early or they may have graduated in four years or more years. However, all graduates considered for this calculation must have graduated with a regular diploma (diploma type = G). Diploma Type is an element collected via SR. The denominator for this rate is the count of graduates for the academic year. The numerator value is the count of graduates completing one of the pathways described in the indicator. Graduates may meet the criteria for one or more pathways; however, they will only count in the numerator once as a pathway completer. SR is an annual collection of data that is not intended to capture historical data. Therefore, a student who enrolls in a Georgia school from out-of-state will not have any prior years of course history submitted in SR. In an effort to not penalize schools, the calculation for this indicator takes a two-pass approach. 1 st pass For each graduate, flag the student as a pathway completer if the graduate meets the criteria for one of the pathways described in the indicator. 2 nd pass June 2, 2015 Page 12 of 61
13 For those students not flagged as a pathway completer, look across the three most recent years of course level data. If the student does not have three years of course history (current year and prior two years), then remove that student from the denominator. For all other students, seven years of SR course history data (current year and six prior years) will be utilized for this calculation. Rate = Graduates Meeting the Indicator Criteria / Graduates Indicator 10: Percent of CTAE Pathway Completers earning a national industry recognized credential, or an IB Career-Related Certificate, or a passing score on a GaDOE recognized end of pathway assessment (operational in ) Students earning a national industry recognized credential are collected through the End of Pathway Assessment (EOPA) collection. GaDOE will also collect from high schools the students who have earned and IB Career-Related Certificate. The denominator value is the count of graduates who are CTAE pathway completers and who earned an IB Career-Related Certificate. The numerator value is the count of graduates who earned a national industry recognized credential and who earned an IB Career-Related Certificate. Rate = Graduates Who Earn a National Industry Recognized Credential and Earned an IB Career=Related Certificate / Graduates Who are CTAE Pathway Completers and Who Earned an IB Career-Related Certificate This indicator is benchmarked at the 95 th percentile based on data. Indicator 11: Percent of graduates entering TCSG/USG not requiring remediation or learning support courses; or scoring program ready on the Compass; or scoring at least 22 out of 36 on the composite ACT; or scoring at least 1550 out of 2400 on the combined SAT; or scoring 3 or higher on two or more AP exams; or scoring 4 or higher on two or more IB exams Lagged data are used as TCSG and USG do not run the data for the graduates entering their institutions not needing remediation until a school year and a summer have passed since the time of graduation. The denominator value is the count of graduates with a regular diploma. The numerator value is the count of graduates who meet the criteria described in the indicator. Rate = Graduates Meeting the Indicator Criteria / Graduates This indicator is benchmarked at the 95 th percentile based on data. Indicator 12: Percent of graduates earning high school credit(s) for accelerated enrollment via ACCEL, Dual HOPE Grant, Move On When Ready (MOWR), Early College, Gateway to College, Advanced Placement courses, or International Baccalaureate courses Dual enrollment courses are denoted by placing a 4 in the 5 th digit position to the right of the decimal (XX.XXXX4XXX). Advanced Placement and International Baccalaureate courses have specified course numbers that follow the convention described earlier in this document. Seven years of SR course history data (current year and six prior years) are utilized for this calculation. The denominator value is the June 2, 2015 Page 13 of 61
14 count of graduates with a regular diploma. The numerator value is the count of graduates who meet the criteria described in the indicator. Rate = Graduates Meeting the Indicator Criteria / Graduates This indicator is benchmarked at the 95 th percentile based on data. Indicator 13: Percent of students scoring at Meets or Exceeds on the Georgia High School Writing Test For this calculation, FAY status and grade level are not a consideration. If a student has more than one GHSWT score in a school year plus a summer, the higher score will be utilized. Students with a GAA who are coded in SR as grade 11 are pulled into this calculation. The denominator value is the count of students with a GHSWT score and GAA score. The numerator value is the count of students with a passing GHSWT score or a passing GAA ELA score. Using the Writing data file found on the portal CCRPI report, set the following filters: 1. Performance Code = deselect NTS No Test Score (if available) a. This count is the denominator 2. Performance Code = ADV and PRO a. This count is the numerator For students taking a GAA, the counts for each subject assessment are mapped to EOG subject assessments: GAA ELA is mapped to GHSWT Meets & Exceeds Rate = Performance Code (ADV & PRO) / Students with a GHSWT and GAA score Indicator 14: Percent of students achieving a Lexile measure 1275 on the Georgia Milestones American Literature The Lexile score is found within the American Literature EOC data file. The denominator is the count of FAY students with an American Literature Lexile score. The numerator is the count of FAY students with an American Literature Lexile score that is Using the American Literature data file found on the portal CCRPI report, set the following filters: 1. FAY Participant = Yes 2. Lexile Scale Score: deselect blanks a. This count is the denominator 3. Lexile Scale Score: select Number Filters, then select Greater Than Or Equal To, then key 1275 a. This count is the numerator Rate = Lexile Count 1275 / FAY Participant Count Indicator 15: Percent of students scoring at the highest performance level on all Georgia Milestones The calculation for this indicator allows for duplication of students in the denominator as well as the numerator. The denominator value is the aggregate count of FAY students with an EOC score. The June 2, 2015 Page 14 of 61
15 numerator value is the count of FAY students with an EOC score at the highest performance level. Using the data file for each content area assessment found on the portal CCRPI report, set the following filters: 1. FAY Participant = Yes a. This count is one of the values for the denominator 2. Performance Code = ADV a. This count is one of the values for the numerator 3. Denominator = sum all denominator values for each content area 4. Numerator = sum all numerator values for each content area For students taking a GAA, the counts for each subject assessment are mapped to EOC subject assessments: GAA ELA is mapped to American Literature EOC GAA math is mapped to Geometry EOC GAA science is mapped to Biology EOC GAA social studies is mapped to US History EOC Rate = Count of Performance Code (ADV) for Each Subject / Count of FAY Participant for Each Subject This indicator is benchmarked at the 95 th percentile based on data. Indicator 16: Percent of students missing fewer than 6 days of school The denominator value is the count of non-duplicated student enrollment records for the school. The numerator value is the count of students who are absent fewer than 6 days of school. The type of absence (excused or unexcused) is not considered. Rate = Students Absent Fewer Than 6 Days of School / Count of Enrollment Records This indicator is benchmarked at the 95 th percentile based on data. Graduation Rate Indicators Indicator 17: 4-Year Cohort Graduation Rate (%) (United States Department of Education definition for cohort grad rate) This rate relies on the count of students in the cohort as well as the diploma type for the students in the cohort. Data from the Summer Graduate application as well as the Cohort Withdrawal Update application are utilized to discern the most recent withdrawal information for students in the cohort. A Graduation Rate data file is available on the Data Details tab of the portal CCRPI report. To derive the 4- year cohort rate, set the following filters: 1. Cohort (column A) = 4 2. Updated Withdrawal Code (column AK) = deselect codes 1, 2, 3, 4, D, H, J, K, N,T, V, W, X, Y, Z a. The resulting count is the denominator 3. Updated Diploma Type (column AN) = G a. The resulting count is the numerator June 2, 2015 Page 15 of 61
16 4-Year Cohort Graduation Rate = # of 2015 Cohort Members Who Graduated with a Regular Education Diploma in 2015 (diploma type = General) # of First Time 9th Graders in Transfers In - Transfers Out, Emigrate or Die in 2012, 2013, 2014, and 2015 Indicator 18: 5-Year Extended Cohort Graduation Rate (%) (US ED definition for cohort grad rate) This rate relies on the count of students in the cohort as well as the diploma type for the students in the cohort. Data from the Summer Graduate application as well as the Cohort Withdrawal Update application are utilized to discern the most recent withdrawal information for students in the cohort. A Graduation Rate data file is available on the Data Details tab of the portal CCRPI report. To derive the 5- year cohort rate, set the following filters: 1. Cohort (column A) = 5 2. Updated Withdrawal Code (column AK) = deselect codes 1, 2, 3, 4, D, H, J, K, N, T, V, W, X, Y, Z a. The resulting count is the denominator 3. Updated Diploma Type (column AN) = G a. The resulting count is the numerator 5-Year Cohort Graduation Rate = # of 2014 Cohort Members Who Graduated with a Regular Education Diploma in 2014 and 2015 (diploma type = General) # of First Time 9th Graders in Transfers In - Transfers Out, Emigrate or Die in 2011, 2012, 2013, 2014, and 2015 Middle Schools Content Mastery Indicators The calculations for the Content Mastery indicators use assessment data for middle schools. Principals, district users, and superintendents have access to their CCRPI reports within the secure MyGaDOE portal. Once the portal report has been accessed, the user can click on the Data Details tab to access all of the content area data files. These data files contain the names and demographic information for each student enrolled in the school for that school year. The assessment scale score earned is also found in the file along with multiple other data elements. Participation Rate Using the content area Data Detail file (located within the school s CCRPI report in the GaDOE portal) and filtering on the Test Enrollment and Test Participant as described in the table above, the user can obtain the values used for the participation rate calculations. Middle school students who are continuously enrolled during the EOG state testing window are expected to test and are flagged as Test Enrollment = Yes. Students who participate in the assessment are flagged as Test Participant = Yes. June 2, 2015 Page 16 of 61
17 Participation Rate = Test Participant/Test Enrollment Students who are expected to test and miss the main administration of the assessment but sit for the retest administration are included in the participation rate calculation. Students coded with a Medical Emergency are not included in the denominator of the participation rate calculation. Meets & Exceeds Rate The Meets & Exceeds rate for each content area is based on students who are considered Full Academic Year (FAY). For middle schools, FAY is calculated by determining if the student was enrolled 65% of the number of days from the start date of the year to the close of the state testing window. Because districts across the state do not have a common start date, common end date, or common holidays, a Julian calendar is used to calculate the number of days from the first day of school to the close of the state testing window. The start and end dates used are provided by districts in the FTE Survey. Below are the steps and a link to a web-based Julian calendar which can be used to calculate the number of days required for a student to be enrolled to be considered FAY: 1. For middle schools, key the date for the first day of school and the end date for the close of the state testing window into a Julian calendar calculator. 2. Subtract the Julian Day number for the start date from the end date. 3. Multiply the difference by 0.65 (65%). 4. Round the product up to the nearest whole number. a rounds to 189 b rounds to This value represents the number of days a student needs to be enrolled in the school to be considered FAY. GAA scores are used to calculate the Meets & Exceeds rate for each subject assessment. For students taking a GAA, the counts for each subject assessment are mapped to EOG subject assessments: GAA ELA is mapped to EOG ELA GAA math is mapped to EOG math GAA science is mapped to EOG science GAA social studies is mapped to EOG social studies English Learners are removed from the Meets & Exceeds rate calculations if the following criteria are met: Student is coded as EL in SR and Student is coded as First Year in US and Student is coded as having a primary language other than English and Student has an ACCESS composite score June 2, 2015 Page 17 of 61
18 Using the content area Data Detail file and filtering on the FAY Participant = Yes and Performance Code = ADV and PRO as described in the table above, the user can obtain the values used for the performance calculations. Meets & Exceeds Rate = Performance Code (ADV & PRO)/FAY Participant Post Middle School Readiness Indicators Indicator 5: Percent of English Learners with positive movement from one Performance Band to a higher Performance Band as measured by the ACCESS for ELLs This calculation relies on SR data, particularly students who are coded as EL (includes EL monitored year 1 and 2) and ACCESS assessment data. The denominator value is the count of EL students with a current year and a prior year ACCESS score. The numerator value is the count of EL students with a current year and a prior year ACCESS score showing positive movement from one performance band to a higher performance band. Below is a table for performance bands and the associated ACCESS Composite Score: Performance Band ACCESS-Composite Score I II III IV V VI VII VIII IX Rate = EL Students Moving From One Performance Band to a Higher Performance Band EL Students with a Current Year and Prior Year ACCESS Composite Score This indicator is benchmarked at the 95 th percentile based on data. Indicator 6: Percent of Students With Disabilities served in general education environments greater than 80% of the school day FTE044 FTE102 Data Element Element Definition REPORT TYPE =S (Special Education Student) SPECIAL ED ENVIRONMENT = 1 (Regular Class - inside regular class at least 80% of the day) if DATE OF BIRTH is such that AGE is greater than 5 as of September 1. SPECIAL ED ENVIRONMENT = 0 (Parentally Placed in Private School - special education and related services in private schools where student was enrolled by the parent June 2, 2015 Page 18 of 61
19 Numerator Total number of students with Report Type = S and AGE is greater than 5 as of September 1 and Special Education Environment = 1 or guardian) if DATE OF BIRTH is such that AGE is greater than 5 as of September 1. Denominator Total number of students with Report Type = S and AGE is greater than 5 as of September 1 and Special Education Environment 0 Rate = # of children with IEPs served inside the regular class 80% or more of the day This indicator is benchmarked at 65%. Total # of students aged 6 through 21 with IEPs Indicator 7: Percent of students in grade 8 achieving a Lexile measure equal to or greater than 1050 The Lexile score is found within the ELA EOG data file. The denominator is the count of FAY students with a reading Lexile score. The numerator is the count of FAY students with a reading Lexile score that is Using the ELA EOG data file found on the portal CCRPI report, set the following filters: 1. Grade Level = 8 2. FAY Participant = Yes 3. Lexile Scale Score: deselect blanks a. This count is the denominator 4. Lexile Scale Score: select Number Filters, then select Greater Than Or Equal To, then key 1050 a. This count is the numerator Rate = Lexile Count 1050 / FAY Participant Count Indicator 8: Percent of students completing 2 or more state defined career related assessments/inventories and a state defined IGP by the end of grade 8 The denominator value is the count of grade 8 students who are Active Year End (students with no reported withdrawal code after the date of enrollment for that academic year). The numerator value is the count of grade 8 students who are Active Year End and have completed 2 or more state defined career related assessments/inventories and a state defined IGP. Rate = Grade 8 Students Coded Active Year End with A Career Related Assessment/Inventory and an IGP Grade 8 Students Coded Active Year End Indicator 9: Percent of students missing fewer than 6 days of school The denominator value is the count of non-duplicated student enrollment records for the school. The numerator value is the count of students who are absent fewer than 6 days of school. The type of absence (excused or unexcused) is not considered. Rate = Students Absent Fewer Than 6 Days of School / Count of Enrollment Records This indicator is benchmarked at the 95 th percentile based on data. June 2, 2015 Page 19 of 61
20 Predictor for High School Graduation Indicators Indicator 10: Percent of students in grade 8 passing at least 4 courses in core content areas (ELA, mathematics, science, and social studies) and scoring at proficient or higher on all required Georgia Milestones For students taking a GAA, the counts for each subject assessment are mapped to EOG subject assessments: GAA ELA is mapped to EOG ELA GAA math is mapped to EOG math GAA science is mapped to EOG science GAA social studies is mapped to EOG social studies The denominator value is the count of grade 8 students who are Active Year End. The numerator value is the count of grade 8 students who are Active Year End and have met all of the following criteria: 1. Passed 4 courses in the core content areas of ELA, reading, mathematics, science, social studies a. Passing courses is determined by Course Number and Content Completer 2. Passed all 4 EOG subject assessments a. ELA b. Mathematics c. Science d. Social Studies 3. Passed all required EOC Rate = Grade 8 Students Coded Active Year End Meeting Indicator Criteria / Grade 8 Students Coded Active Year End This indicator is benchmarked at the 95 th percentile based on data. Indicator 11: Percent of students scoring at the highest performance level on all Georgia Milestones For students taking a GAA, the counts for each subject assessment are mapped to EOG subject assessments: GAA ELA is mapped to EOG ELA GAA math is mapped to EOG math GAA science is mapped to EOG science GAA social studies is mapped to EOG social studies The calculation for this indicator allows for duplication of students in the denominator as well as the numerator because students take EOG assessments in each subject area. The denominator value is the aggregate count of FAY students with an EOG score. The numerator value is the count of FAY students with an EOG score at the Exceeds level. Using the data file for each content area assessment found on the portal CCRPI report, set the following filters: 1. FAY Participant = Yes a. This count is one of the values for the denominator June 2, 2015 Page 20 of 61
21 2. Performance Code = ADV a. This count is one of the values for the numerator 3. Denominator = sum all denominator values for all content areas 4. Numerator = sum all numerator values for all content areas Rate = Count of Performance Code (ADV) for Each Subject / Count of FAY Participants for Each Subject This indicator is benchmarked at the 95 th percentile based on data. Elementary Schools Content Mastery Indicators The calculations for the Content Mastery indicators use assessment data for elementary schools. Principals, district users, and superintendents have access to their CCRPI reports within the secure MyGaDOE portal. Once the portal report has been accessed, the user can click on the Data Details tab to access all of the content area data files. These data files contain the names and demographic information for each student enrolled in the school for that school year. The assessment scale score earned is also found in the file along with multiple other data elements. Participation Rate Using the content area Data Detail file (located within the school s CCRPI report in the GaDOE portal) and filtering on Test Enrollment and Test Participant as described in the table above, the user can obtain the values used for the participation rate calculations. Elementary school students who are continuously enrolled during the EOG state testing window are expected to test and flagged as Test Enrollment = Yes. Students who participate in the assessment are flagged as Test Participant = Yes. Participation Rate = Test Participant/Test Enrollment Students who are expected to test and miss the main administration of the assessment but sit for the retest administration are included in the participation rate calculation. Students coded with a Medical Emergency are not included in the denominator of the participation rate calculation. Meets & Exceeds Rate The Meets & Exceeds rate for each content area is based on students who are considered Full Academic Year (FAY). For elementary schools, FAY is calculated by determining if the student was enrolled 65% of the number of days from the start date of the year to the close of the state testing window. Because districts across the state do not have a common start date, common end date, or common holidays, a Julian calendar is used to calculate the number of days from the first day of school to the close of the state testing window. The start and end dates used are provided by districts in the annual June 2, 2015 Page 21 of 61
22 FTE Survey. Below are the steps and a link to a web-based Julian calendar which can be used to calculate the number of days required for a student to be enrolled to be considered FAY: 1. For elementary schools, key the date for the first day of school and the end date for the close of the state testing window into a Julian calendar calculator. 2. Subtract the Julian Day number for the start date from the end date. 3. Multiply the difference by 0.65 (65%). 4. Round the product up to the nearest whole number. a rounds to 189 b rounds to This value represents the number of days a student needs to be enrolled in the school to be considered FAY. GAA scores are used to calculate the Meets & Exceeds rate for each subject assessment. For students taking a GAA, the counts for each subject assessment are mapped to EOG subject assessments: GAA ELA is mapped to EOG ELA GAA math is mapped to EOG math GAA science is mapped to EOG science GAA social studies is mapped to EOG social studies English Learners are removed from the Meets & Exceeds rate calculations if the following criteria are met: Student is coded as EL in SR and Student is coded as First Year in US and Student is coded as having a primary language other than English and Student has an ACCESS composite score Using the content area Data Detail file and filtering on the FAY Participant = Yes and Performance Code = ADV and PRO as described in the table above, the user can obtain the values used for the performance calculations. Meets & Exceeds Rate = Performance Code (ADV & PRO)/FAY Participant PK-1 and PK-2 Schools Assessment scores for grade 3 students are utilized to calculate a Participation Rate and a Meets & Exceeds Rate for English/Language Arts and mathematics. Participation Rate The denominator value is the count of 3 rd grade students who are Test Enrolled in the current year and in prior school year. The numerator value is the count of 3 rd grade students who are Test Enrolled in the current year and in prior school year and who participated in the assessment during the current year. June 2, 2015 Page 22 of 61
23 Participation Rate = Count of 3 rd Grade Students Who are Test Enrolled in the Current Year and in the Prior School Year and Who Participated in the Assessment During the Current Year / Count of 3 rd Grade Students Who are Test Enrolled in the Current Year and in the Prior School Year Meets & Exceeds Rate The denominator value is the count of 3 rd grade students who are FAY Participants in the current year and in the prior school year. The numerator value is the count of 3 rd grade students who are FAY Participants in the current year and in the prior school year and whose Performance Code = ADV or PRO. Meets & Exceeds Rate = FAY Participant in Current Year and in the Prior School Year and Performance Code (ADV & PRO) / FAY Participant in Current Year and in the Prior School Year K-Only Schools Content Mastery for English language arts and mathematics is determined for K-only schools based on the percent of students meeting readiness expectations for first grade. Schools may use the GKIDS School Summary Report along with other evidence to determine this percentage. Post Elementary School Readiness Indicators Indicator 5: Percent of English Learners with positive movement from one Performance Band to a higher Performance Band as measured by the ACCESS for ELLs This calculation relies on SR data, particularly students who are coded as EL (includes EL monitored year 1 and 2) and ACCESS assessment data. The denominator value is the count of EL students with a current year and a prior year ACCESS score. The numerator value is the count of EL students with a current year and a prior year ACCESS score showing positive movement from one performance band to a higher performance band. Below is a table for performance bands and the associated ACCESS Composite Score: Performance Band ACCESS-Composite Score I II III IV V VI VII VIII IX Rate = EL Students Moving From One Performance Band to a Higher Performance Band EL Students with a Current Year and Prior Year ACCESS Composite Score This indicator is benchmarked at the 95 th percentile based on data. June 2, 2015 Page 23 of 61
24 Indicator 6: Percent of Students With Disabilities served in general education environments greater than 80% of the school day FTE044 Data Element Element Definition REPORT TYPE =S (Special Education Student) SPECIAL ED ENVIRONMENT = 1 (Regular Class - inside regular class at least 80% of the day) if DATE OF BIRTH is such that AGE is greater than 5 as of September 1. FTE102 Numerator Total number of students with Report Type = S and AGE is greater than 5 as of September 1 and Special Education Environment = 1 SPECIAL ED ENVIRONMENT = 0 (Parentally Placed in Private School - special education and related services in private schools where student was enrolled by the parent or guardian) if DATE OF BIRTH is such that AGE is greater than 5 as of September 1. Denominator Total number of students with Report Type = S and AGE is greater than 5 as of September 1 and Special Education Environment 0 Rate = # of children with IEPs served inside the regular class 80% or more of the day This indicator is benchmarked at 65%. Total # of students aged 6 through 21 with IEPs Indicator 7: Percent of students in grade 3 achieving a Lexile measure equal to or greater than 650 The Lexile score is found within the ELA EOG data file. The denominator is the count of FAY students with a reading Lexile score. The numerator is the count of FAY students with a reading Lexile score that is 650. To determine FAY status, follow the steps outlined earlier in this guide. Using the ELA EOG data file found on the portal CCRPI report, set the following filters: 1. Grade Level = 3 2. FAY Participant = Yes 3. Lexile Scale Score: deselect blanks a. This count is the denominator 4. Lexile Scale Score: select Number Filters, then select Greater Than Or Equal To, then key 650 a. This count is the numerator Rate = Lexile Count 650 / FAY Participant Count Indicator 8: Percent of students in grade 5 achieving a Lexile measure equal to or greater than 850 The Lexile score is found within the ELA EOG data file. The denominator is the count of FAY students with a reading Lexile score. The numerator is the count of FAY students with a reading Lexile score that June 2, 2015 Page 24 of 61
25 is 850. To determine FAY status, follow the steps outlined earlier in this guide. Using the ELA EOG data file found on the portal CCRPI report, set the following filters: 1. Grade Level = 5 2. FAY Participant = Yes 3. Lexile Scale Score: deselect blanks a. This count is the denominator 4. Lexile Scale Score: select Number Filters, then select Greater Than Or Equal To, then key 850 a. This count is the numerator Rate = Lexile Count 850 / FAY Participant Count Indicator 9: Percent of students in grades 1-5 completing the identified number of grade specific career awareness lessons aligned to Georgia s 17 Career Clusters Career awareness lessons for certain Career Clusters are taught at particular grade levels. The following lists the number of career awareness lessons which are required for each grade: 1. Grade 1: 3 lessons 2. Grade 2: 3 lessons 3. Grade 3: 3 lessons 4. Grade 4: 4 lessons 5. Grade 5: 4 lessons The number of career awareness lessons a student receives in a school year is coded in SR. The denominator value is the sum of the count of students who are Active Year End for each grade level. The numerator value is the sum of the count of students who are Active Year End for each grade level who have the required number of career awareness lessons appropriate for the student s grade level. Rate = Count of Students in Grades 1-5 Coded Active Year End Meeting the Indicator Criteria / Count of Students in Grades 1-5 Coded Active Year End Indicator 10: Percent of students missing fewer than 6 days of school The denominator value is the count of non-duplicated student enrollment records for the school. The numerator value is the count of students who are absent fewer than 6 days of school. The type of absence (excused or unexcused) is not considered. Rate = Students Absent Fewer Than 6 Days of School / Count of Enrollment Records This indicator is benchmarked at the 95 th percentile based on data. Predictor for High School Graduation Indicators Indicator 11: Percent of students in Grade 5 passing at least 5 courses in core content areas (ELA, reading, mathematics, science, and social studies) and scoring at proficient or higher on all Georgia Milestones June 2, 2015 Page 25 of 61
26 For students taking a GAA, the counts for each subject assessment are mapped to EOG subject assessments: GAA ELA is mapped to EOG ELA GAA math is mapped to EOG math GAA science is mapped to EOG science GAA social studies is mapped to EOG social studies The denominator value is the count of grade 5 students who are Active Year End. The numerator value is the count of grade 5 students who are Active Year End and have met all of the following criteria: 1. Passed 5 courses in the core content areas of ELA, reading, mathematics, science, social studies a. Passing courses is determined by Content Completer 2. Passed all 4 EOG subject assessments* a. ELA b. Mathematics c. Science d. Social Studies *For schools which offer only 4 core courses to grade 5 students (reading and ELA are combined into one course and named as either reading or language arts), then the course submitted in SR (reading or language arts) is used for both the ELA and reading courses. Rate = Grade 5 Students Coded Active Year End Meeting Indicator Criteria / Grade 5 Students Coded Active Year End This indicator is benchmarked at the 95 th percentile based on data. Indicator 12: Percent of students scoring at the highest performance level on all Georgia Milestones For students taking a GAA, the counts for each subject assessment are mapped to EOG subject assessments: GAA ELA is mapped to EOG ELA GAA math is mapped to EOG math GAA science is mapped to EOG science GAA social studies is mapped to EOG social studies The calculation for this indicator allows for duplication of students in the denominator as well as the numerator because students take EOG assessments in each subject area. The denominator value is the aggregate count of FAY students with an EOG score. The numerator value is the count of FAY students with an EOG score at the Exceeds level. Using the data file for each content area assessment found on the portal CCRPI report, set the following filters: 1. FAY Participant = Yes a. This count is one of the values for the denominator 2. Performance Code = ADV a. This count is one of the values for the numerator 3. Denominator = sum all denominator values for all content areas June 2, 2015 Page 26 of 61
27 4. Numerator = sum all numerator values for all content areas Rate = Count of Performance Code (ADV) for Each Subject / Count of FAY Participant for Each Subject This indicator is benchmarked at the 95 th percentile based on data. Exceeding the Bar (ETB) Indicators High School ETBs High School ETB 1: Percent of graduates earning credit in a physics course This calculation relies on SR data, particularly course numbers for physics and students coded as graduates. Seven years of SR course history data (current year and 6 prior years) will be utilized for this calculation. The denominator value is the count of graduates (early, on-time, 5-year +) earning a regular high school diploma (G). The numerator value is the count of graduates (early, on-time, 5-year +) earning a regular high school diploma (G) who also earn credit in a physics course. Rate = Graduates Meeting Indicator Criteria / Graduates This indicator is benchmarked at the 95 th percentile based on data. High School ETB 2: Percent of first time 9 th grade students with disabilities earning 3 Carnegie Unit Credits in 3 core content areas (ELA, mathematics, science, social studies) and scoring at proficient or higher on all required Georgia Milestones For students taking a GAA, the counts for each subject assessment are mapped to EOC subject assessments: GAA ELA is mapped to American Literature EOC GAA math is mapped to Geometry EOC GAA science is mapped to Biology EOC GAA social studies is mapped to US History EOC SR and assessment data are used for this calculation. The denominator value is the count of first time 9 th grade students with disabilities who are Active Year End. The numerator value is the count of first time 9 th grade students with disabilities who are Active Year End earning 3 or more credits in distinct core content courses (ELA, math, science, social studies) and who pass all required EOC. Rate = Count of First Time 9 th Grade Students With Disabilities Coded Active Year End Meeting Indicator Criteria / Count of First Time 9 th Grade Students With Disabilities Coded Active Year End This indicator is benchmarked at the 95 th percentile based on data. High School ETB 3: Percent of first time 9 th grade students earning 4 Carnegie Unit Credits in 4 core content areas (ELA, mathematics, science, social studies) and scoring at proficient or higher on all required Georgia Milestones June 2, 2015 Page 27 of 61
28 For students taking a GAA, the counts for each subject assessment are mapped to EOC subject assessments: GAA ELA is mapped to American Literature EOC GAA math is mapped to Geometry EOC GAA science is mapped to Biology EOC GAA social studies is mapped to US History EOC SR and assessment data are also used for this calculation. The denominator value is the count of first time 9 th grade students who are Active Year End. The numerator value is the count of first time 9 th grade students who are Active Year End earning 4 or more credits in distinct core content courses (ELA, math, science, social studies) and passing all required EOC. Rate = Count of First Time 9 th Grade Students Coded Active Year End Meeting Indicator Criteria / Count of First Time 9 th Grade Students Coded Active Year End This indicator is benchmarked at the 95 th percentile based on data. High School ETB 4: School has earned a Georgia Science, Technology, Engineering and Math (STEM) Program Certification Schools which are approved by GaDOE as STEM schools or that contain an approved STEM program receive 0.5 points for this ETB. High School ETB 5: Percent of English Learners with positive movement from one Performance Band to a higher Performance Band based on the ACCESS for ELLs This calculation relies on SR data, particularly students who are coded as EL (includes EL monitored year 1 and 2). ACCESS assessment data are also utilized. The denominator value is the count of EL students with a current year and a prior year ACCESS score. The numerator value is the count of EL students with a current year and a prior year ACCESS score showing positive movement from one performance band to a higher performance band. Below is a table for performance bands and the associated ACCESS Composite Score: Performance Band ACCESS-Composite Score I II III IV V VI VII VIII IX Rate = EL Students Moving From One Performance Band to a Higher Performance Band EL Students with a Current Year and Prior Year ACCESS Composite Score June 2, 2015 Page 28 of 61
29 This indicator is benchmarked at the 95 th percentile based on data. High School ETB 6: Percent of graduates completing a career-related Work-Based Learning Program or a career-related Capstone Project (includes IB projects; moves to face of CCRPI in ) Work-Based Learning courses are denoted by the following: XX.7XXXXXXX The denominator value is the count of graduates (early, on-time, 5-year +) earning a regular high school diploma (G). The numerator value is the count of graduates (early, on-time, 5-year +) earning a regular high school diploma (G) who also earn credit in a work-based learning course or who complete a careerrelated Capstone Project. Rate = Graduates Meeting Indicator Criteria / Graduates This indicator is benchmarked at the 95 th percentile based on data. High School ETB 7: Percent of graduates earning 3 or more high school credits in the same world language Seven years of SR course history data (current year and 6 prior years) will be utilized for this calculation. The denominator value is the count of graduates (early, on-time, 5-year +) earning a regular high school diploma (G). The numerator value is the count of graduates (early, on-time, 5-year +) earning a regular high school diploma (G) and 3 or more credits in the same world language. Rate = Graduates Meeting Indicator Criteria / Graduates This indicator is benchmarked at the 95 th percentile based on data. High School ETB 8: Percent of teachers utilizing the Statewide Longitudinal Data Systems (SLDS) To earn the 0.5 point credit for this indicator, the following is considered: 1. 50% of the school s teachers (as reported in CPI for your school) accumulate an average of 50 or more page views per month during the period of June 1, 2014 through May 31, Teacher views include any of the teacher SLDS applications: a. SLDS teacher level dashboards b. Teacher Resource Link (TRL) c. Growth Model d. GOFAR system The Usage Report is currently reporting page view counts for the SLDS, TRL, IIS, and Growth Model applications. Although teachers page views in the GOFAR and GOIEP applications are not being displayed on the Usage Report yet, page views within these applications are also being counted and will be displayed on the report soon. June 2, 2015 Page 29 of 61
30 The average 50 page views or more per month is an average throughout the collection window (June 1, May 31, 2015). Teachers obtaining 500 page hits by the end of the collection window will count towards meeting the criteria. The Usage Reports application within SLDS allows those with school or district level access in SLDS to monitor teachers page view counts. Here is a link to the Usage Reports User Guide. High School ETB 9: School or LEA-defined innovative practice accompanied by data supporting improved student achievement: examples include but are not limited to Charter System, Georgia College and Career Academy, Race to the TOP, Striving Reader initiative, dual language immersion program, Literacy Design Collaborative (LDC) and/or Mathematics Design Collaborative (MDC), Response to Intervention (RTI), Positive Behavioral Interventions & Supports (PBIS), local instructional initiatives, etc. Practice must be reported via the CCRPI Data Collection application. These data are collected annually via the CCRPI Data Collections application. Below are the criteria for submission: School or LEA-defined innovative practice accompanied by documented data supporting improved student achievement: examples include but are not limited to-charter System, Georgia College and Career Academy, Race to the TOP, Striving Reader initiative, dual language immersion program, Literacy Design Collaborative (LDC) and/or Mathematics Design Collaborative (MDC), Response to Intervention (RTI), Positive Behavioral Interventions & Supports (PBIS), local instructional initiatives, etc. Practice must be reported via the CCRPI Data Collection application. Must upload two files: Attached data must meet the following requirements: 1. Comparative data (pre and post) must demonstrate growth (must be generated from a norm referenced or criterion reference measurement). 2. If using charts and tables, include the following information: year, grade level, subject, other relevant information necessary to interpret the chart and/or table. 3. Data submitted must be prior year and current year data. 4. Do not include student names or other student identifiers. 5. Do not submit district level data reports. 6. Submit school level reports relevant to the instructional practice and target population. 7. Data file mega bite limit = 2MB file limit on data submitted (pre and post). High School ETB 10: School or LEA Research/Evidence-based Program/Practice designed to facilitate a personalized climate in the school: examples include but are not limited to Teachers as Advisors program; mentoring program; Positive Behavioral Interventions & Supports (PBIS); service-learning program; peer mediation; conflict mediation. School or LEA Personalized Climate Research/Evidence-based Programs/Practices accompanied by documented data supporting the improvement of school climate in any one or more of the four components of the School Climate Star Rating: 1. Student Discipline 2. Safe and Substance-Free Learning Environment June 2, 2015 Page 30 of 61
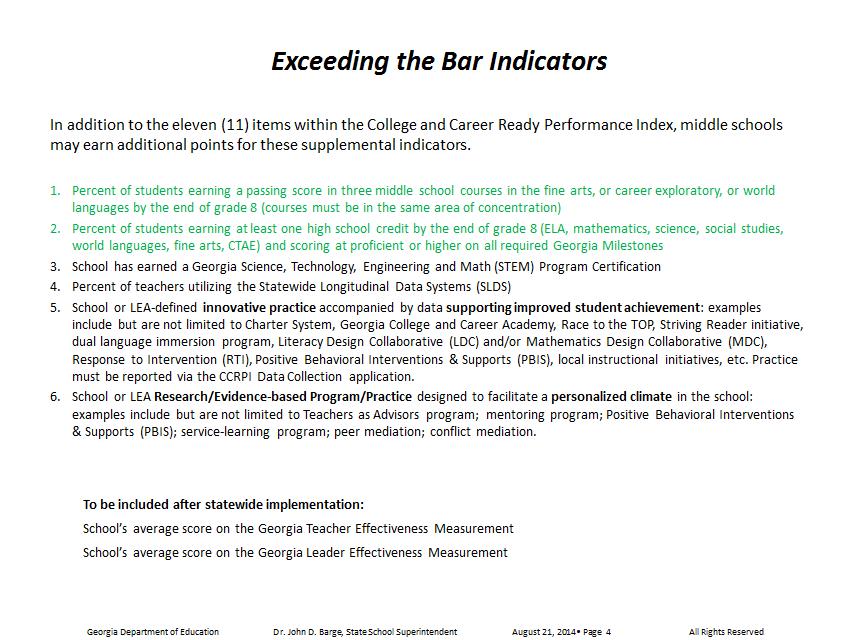
31 3. Increase Student and Staff Attendance 4. Categorical Improvement on the Georgia Student Health Survey II (GSHSII) Examples of the above include, but are not limited to, school-wide implementation of research/evidence-based programs such as Teachers as Advisors program; mentoring program; Positive Behavioral Interventions and Supports (PBIS); service learning program; conflict mediation; peer mediation; drug or violence prevention programs. Must upload two files: Attached data must meet the following requirements: 1. Include comparative data (pre and post) that demonstrate growth to meet stated goal (post data must be current year available). 2. If using charts and tables, include the following information: year, grade level, subject, other relevant information necessary to interpret the chart and/or table. 3. Submit school level reports relevant to the personalized climate and the school population, not district level reports. 4. There is a two file limit on data submitted (pre and post). Post data must be current year available. 5. Do not include student names or other student identifiers. Middle School ETBs Middle School ETB 1: Percent of students earning a passing score in three middle school courses in the fine arts, or career exploratory, or world languages by the end of grade 8 (courses must be in the same area of concentration) The denominator value is the count of grade 8 students who are Active Year End. The numerator value is the count of grade 8 students who are Active Year End who have also passed three courses in fine arts, or career exploratory, or world language courses. Passing courses is determined by Course Grade (2012 and 2013) and Content Completer (2014). SR is an annual collection of data. It is not intended to capture historical data. Therefore, a student who enrolls in a Georgia school from out-of-state will not have any prior years of course history submitted in SR. In an effort to not penalize schools, the calculation for this indicator takes a 2-pass approach. 1 st pass For each grade 8 student, flag the student as a middle school pathway completer if the student meets the criteria for one of the pathways described in the indicator. 2 nd pass For those students not flagged as a pathway completer, look across three years of course level data. If the student does not have three years of course history (current year and prior two years), then remove that student from the denominator. Rate = Count of Students in Grade 8 Coded Active Year End Meeting Indicator Criteria / Count of Students in Grade 8 Coded Active Year End June 2, 2015 Page 31 of 61
32 This indicator is benchmarked at the 95 th percentile based on data. Middle School ETB 2: Percent of students earning at least one high school credit by the end of grade 8 (ELA, mathematics, science, social studies, world languages, fine arts, CTAE) and scoring at proficient or higher on all required Georgia Milestones For students taking a GAA, the counts for each subject assessment are mapped to EOG subject assessments: GAA ELA is mapped to EOG ELA GAA math is mapped to EOG math GAA science is mapped to EOG science GAA social studies is mapped to EOG social studies The denominator value is the count of grade 8 students who are Active Year End. The numerator value is the count of grade 8 students who are Active Year End and have met all of the following criteria: 1. Earned credit in a high school credit bearing course 2. Passed all 4 EOG subject assessments a) ELA b) Mathematics c) Science d) Social Studies 3. Passed all required EOC Rate = Count of Students in Grade 8 Coded Active Year End Meeting Indicator Criteria / Count of Students in Grade 8 Coded Active Year End This indicator is benchmarked at the 95 th percentile based on data. Middle School ETB 3: School has earned a Georgia Science, Technology, Engineering and Math (STEM) Program Certification Schools approved by GaDOE as STEM schools or that contain an approved STEM program receive 0.5 points for this ETB. Middle School ETB 4: Percent of teachers utilizing the Statewide Longitudinal Data Systems (SLDS) To earn the 0.5 point credit for this indicator, the following is considered: 1. 50% of the school s teachers (as reported in CPI for your school) accumulate an average of 50 or more page views per month during the period of June 1, 2014 through May 31, Teacher views include any of the teacher SLDS applications: a. SLDS teacher level dashboards b. Teacher Resource Link (TRL) c. Growth Model d. GOFAR system The Usage Report is currently reporting page view counts for the SLDS, TRL, IIS, and Growth Model applications. Although teachers page views in the GOFAR and GOIEP applications are not being June 2, 2015 Page 32 of 61
33 displayed on the Usage Report yet, page views within these applications are also being counted and will be displayed on the report soon. The average 50 page views or more per month is an average throughout the collection window (June 1, May 31, 2015). Teachers obtaining 500 page hits by the end of the collection window will count towards meeting the criteria. The Usage Reports application within SLDS allows those with school or district level access in SLDS to monitor teachers page view counts. Here is a link to the Usage Reports User Guide. Middle School ETB 5: School or LEA-defined innovative practice accompanied by data supporting improved student achievement: examples include but are not limited to Charter System, Georgia College and Career Academy, Race to the TOP, Striving Reader initiative, dual language immersion program, Literacy Design Collaborative (LDC) and/or Mathematics Design Collaborative (MDC), Response to Intervention (RTI), Positive Behavioral Interventions & Supports (PBIS), local instructional initiatives, etc. Practice must be reported via the CCRPI Data Collection application. These data are collected annually via the CCRPI Data Collections application. Below are the criteria for submission: School or LEA-defined innovative practice accompanied by documented data supporting improved student achievement: examples include but are not limited to-charter System, Georgia College and Career Academy, Race to the TOP, Striving Reader initiative, dual language immersion program, Literacy Design Collaborative (LDC) and/or Mathematics Design Collaborative (MDC), Response to Intervention (RTI), Positive Behavioral Interventions & Supports (PBIS), local instructional initiatives, etc. Practice must be reported via the CCRPI Data Collection application. Must upload two files: Attached data must meet the following requirements: 1. Comparative data (pre and post) must demonstrate growth (must be generated from a norm referenced or criterion reference measurement). 2. If using charts and tables, include the following information: year, grade level, subject, other relevant information necessary to interpret the chart and/or table. 3. Data submitted must be prior year and current year data. 4. Do not include student names or other student identifiers. 5. Do not submit district level data reports. 6. Submit school level reports relevant to the instructional practice and target population. 7. Data file mega bite limit = 2MB file limit on data submitted (pre and post). Middle School ETB 6: School or LEA Research/Evidence-based Program/Practice designed to facilitate a personalized climate in the school: examples include but are not limited to Teachers as Advisors program; mentoring program; Positive Behavioral Interventions & Supports (PBIS); service-learning program; peer mediation; conflict mediation. School or LEA Personalized Climate Research/Evidence-based Programs/Practices accompanied by documented data supporting the improvement of school climate in any one or more of the four components of the School Climate Star Rating: June 2, 2015 Page 33 of 61
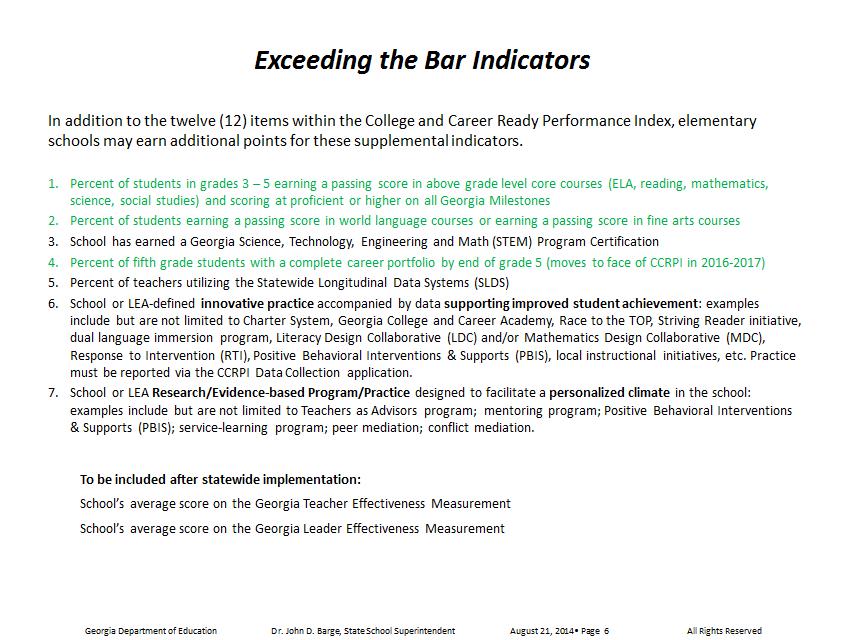
34 1. Student Discipline 2. Safe and Substance-Free Learning Environment 3. Increase Student and Staff Attendance 4. Categorical Improvement on the Georgia Student Health Survey II (GSHSII) Examples of the above include, but are not limited to, school-wide implementation of research/evidence-based programs such as Teachers as Advisors program; mentoring program; Positive Behavioral Interventions and Supports (PBIS); service learning program; conflict mediation; peer mediation; drug or violence prevention programs. Must upload two files: Attached data must meet the following requirements: 1. Include comparative data (pre and post) that demonstrate growth to meet stated goal (post data must be current year available). 2. If using charts and tables, include the following information: year, grade level, subject, other relevant information necessary to interpret the chart and/or table. 3. Submit school level reports relevant to the personalized climate and the school population, not district level reports. 4. There is a two file limit on data submitted (pre and post). Post data must be current year available. 5. Do not include student names or other student identifiers. Elementary School ETBs Elementary School ETB 1: Percent of students in grades 3 5 earning a passing score in above grade level core courses (ELA, reading, mathematics, science, social studies) and scoring at proficient or higher on all required Georgia Milestones For students taking a GAA, the counts for each subject assessment are mapped to EOG subject assessments: GAA ELA is mapped to EOG ELA GAA math is mapped to EOG math GAA science is mapped to EOG science GAA social studies is mapped to EOG social studies Course numbers for grades 1-8 are grade specific. For example, English Language Arts has a specific course number for each grade in grades 1-8. The grade level submitted for the student is compared to the grade level associated with the course. If a student in grade 3 is Active Year End and passed a grade 4 English Language Arts course, then this student is eligible to count in the numerator of this rate. The denominator value is the count of students in grades 3-5 who are Active Year End. The numerator value is the count of students in grades 3-5 who are Active Year End and have met the following criteria: 1. Passed an above grade level course a. Passing courses is determined by Content Completer 3. Passed all 4 EOG subject assessments a) ELA June 2, 2015 Page 34 of 61
35 b) Mathematics c) Science d) Social Studies Rate = Count of Students in Grades 3-5 Coded Active Year End Meeting Indicator Criteria / Count of Students in Grades 3-5 Coded Active Year End This indicator is benchmarked at the 95 th percentile based on data. Elementary School ETB 2: Percent of students earning a passing score in world language courses or earning a passing score in fine arts courses The denominator value is the count of all students in grades 1-5 who are Active Year End. The numerator value is the count of all students in grades 1-5 who are Active Year End and have earned a passing score in a world language or fine arts course. Passing courses is determined by Content Completer. Rate = Count of Students in Grades 1-5 Coded Active Year End Meeting Indicator Criteria / Count of Students in Grades 3-5 Coded Active Year End This indicator is benchmarked at the 95 th percentile based on data. Elementary School ETB 3: School has earned a Georgia Science, Technology, Engineering and Math (STEM) Program Certification Schools approved by GaDOE as STEM schools or that contain an approved STEM program receive 0.5 points for this ETB. Elementary School ETB 4: Percent of fifth grade students with a complete career portfolio by end of grade 5 (moves to face of CCRPI in ) The denominator value is the count of students in grade 5 who are Active Year End. The numerator value is the count of students in grade 5 who are Active Year End and who have a complete career portfolio. Rate = Count of Students in Grade 5 Coded Active Year End Meeting Indicator Criteria / Count of Students in Grade 5 Coded Active Year End This indicator is benchmarked at the 95 th percentile based on data. Elementary School ETB 5: Percent of teachers utilizing the Statewide Longitudinal Data Systems (SLDS) To earn the 0.5 point credit for this indicator, the following is considered: 1. 50% of the school s teachers (as reported in CPI for your school) accumulate an average of 50 or more page views per month during the period of June 1, 2014 through May 31, Teacher views include any of the teacher SLDS applications: a. SLDS teacher level dashboards June 2, 2015 Page 35 of 61
36 b. Teacher Resource Link (TRL) c. Growth Model d. GOFAR system The Usage Report is currently reporting page view counts for the SLDS, TRL, IIS, and Growth Model applications. Although teachers page views in the GOFAR and GOIEP applications are not being displayed on the Usage Report yet, page views within these applications are also being counted and will be displayed on the report soon. The average 50 page views or more per month is an average throughout the collection window (June 1, May 31, 2015). Teachers obtaining 500 page hits by the end of the collection window will count towards meeting the criteria. The Usage Reports application within SLDS allows those with school or district level access in SLDS to monitor teachers page view counts. Here is a link to the Usage Reports User Guide. Elementary School ETB 6: School or LEA-defined innovative practice accompanied by data supporting improved student achievement: examples include but are not limited to Charter System, Georgia College and Career Academy, Race to the TOP, Striving Reader initiative, dual language immersion program, Literacy Design Collaborative (LDC) and/or Mathematics Design Collaborative (MDC), Response to Intervention (RTI), Positive Behavioral Interventions & Supports (PBIS), local instructional initiatives, etc. Practice must be reported via the CCRPI Data Collection application. These data are collected annually via the CCRPI Data Collections application. Below are the criteria for submission: School or LEA-defined innovative practice accompanied by documented data supporting improved student achievement: examples include but are not limited to-charter System, Georgia College and Career Academy, Race to the TOP, Striving Reader initiative, dual language immersion program, Literacy Design Collaborative (LDC) and/or Mathematics Design Collaborative (MDC), Response to Intervention (RTI), Positive Behavioral Interventions & Supports (PBIS), local instructional initiatives, etc. Practice must be reported via the CCRPI Data Collection application. Must upload two files: Attached data must meet the following requirements: 1. Comparative data (pre and post) must demonstrate growth (must be generated from a norm referenced or criterion reference measurement). 2. If using charts and tables, include the following information: year, grade level, subject, other relevant information necessary to interpret the chart and/or table. 3. Data submitted must be prior year and current year data. 4. Do not include student names or other student identifiers. 5. Do not submit district level data reports. 6. Submit school level reports relevant to the instructional practice and target population. 7. Data file mega bite limit = 2MB file limit on data submitted (pre and post). June 2, 2015 Page 36 of 61
37 Elementary School ETB 7: School or LEA Research/Evidence-based Program/Practice designed to facilitate a personalized climate in the school: examples include but are not limited to Teachers as Advisors program; mentoring program; Positive Behavioral Interventions & Supports (PBIS); servicelearning program; peer mediation; conflict mediation. School or LEA Personalized Climate Research/Evidence-based Programs/Practices accompanied by documented data supporting the improvement of school climate in any one or more of the four components of the School Climate Star Rating: 1. Student Discipline 2. Safe and Substance-Free Learning Environment 3. Increase Student and Staff Attendance 4. Categorical Improvement on the Georgia Student Health Survey II (GSHSII) Examples of the above include, but are not limited to, school-wide implementation of research/evidence-based programs such as Teachers as Advisors program; mentoring program; Positive Behavioral Interventions and Supports (PBIS); service learning program; conflict mediation; peer mediation; drug or violence prevention programs. Must have two files uploaded. Attached data must meet the following requirements: 1. Include comparative data (pre and post) that demonstrate growth to meet stated goal (post data must be current year available). 2. If using charts and tables, include the following information: year, grade level, subject, other relevant information necessary to interpret the chart and/or table. 3. Submit school level reports relevant to the personalized climate and the school population, not district level reports. 4. There is a two file limit on data submitted (pre and post). Post data must be current year available. 5. Do not include student names or other student identifiers. Scoring Indicator Calculations For all indicators where course level data are referenced, it may be necessary to look back over a number of years of SR data. For middle school ETB 1 and 2, three years of SR data will be reviewed. For high school indicators relying on course credit, seven years of SR data will be reviewed. Otherwise, current year data are utilized for indicator calculations. The n size for all CCRPI calculations and reporting is 15. If the denominator = 0, then NA will be displayed on the report. If 0 < denominator < 15, then TFS (Too Few Students) will be displayed on the report. If the denominator 15, then the actual performance will be displayed. For Content Mastery, Performance Flags, and Graduation Rate calculations: SWD subgroup = SWD, SWD-M1, SWD-M2 EL subgroup = EL, EL-M1, EL-M2 June 2, 2015 Page 37 of 61
 will be included on the RTF s CCRPI report. However, these data will not roll to the district report for the district in which they reside.")
38 ED subgroup = students coded in SR as Free or Reduced Price Meal Eligibility = Yes or school is coded as CEP in school level layout file. Data for Residential Treatment Facilities (RTF) will be included on the RTF s CCRPI report. However, these data will not roll to the district report for the district in which they reside. These data will be included in the state level CCRPI report. For the CCRPI reports, all calculations are rounded to 3 decimal places. Screen shots displayed below are from the CCRPI reports. Achievement Points Each indicator (18 for high schools, 11 for middle schools, and 12 for elementary schools) is assigned a value of 10 points. A 10-point value was assigned because 10 points are easy to understand and work with mathematically. Points are awarded by multiplying the decimal value of the Performance on Indicator by 10. Example: Performance on Indicator = 90.5% 90.5% = x 10 = 9.05 Points Earned on Indicator are For two of the categories, (Post High/Middle/Elementary School Readiness, Graduation Rate/Predictor for High School Graduation), some of the indicators are benchmarked at a value which is less than 100%. For the indicators which are benchmarked, divide the Performance on Indicator by the Benchmark, then multiply the decimal value of the result by 10. This product represents the points earned on the indicator. The screen shot below is a visual representation of this calculation: Example: Benchmark for Indicator = 91.6%, Performance on Indicator = 67.5% 67.5 / 91.6 = x 10 = June 2, 2015 Page 38 of 61
39 rounds to For each category (Content Mastery, Post High/Middle/Elementary School Readiness, Graduation Rate/Predictor for High School Graduation), sum the Points Possible on Indicator as well as the Points Earned on Indicator. The Category Performance is derived by dividing the Points Earned by the Points Possible. This decimal value is then multiplied by the decimal value of the Category Weight (40% = 0.40 or 30% = 0.30). This product is the Weighted Performance. The screen shots below are a visual representation of this calculation: The total points earned for Achievement are calculated by adding the Weighted Performance for each category, then multiplying this sum by 60. The screen shot below is a visual representation of this calculation: Achievement Points Earned are June 2, 2015 Page 39 of 61

 is FAY")
40 Progress Points The Progress calculation is based upon the Student Growth Percentiles (SGPs) for FAY students for each content area. To determine FAY status, follow the steps outlined earlier in this guide. The content areas are described below. GAA assessment scores are not utilized for this calculation. For High Schools: ELA EOC: 9 th Grade Literature and Composition and American Literature and Composition Math EOC: Coordinate Algebra, Analytic Geometry, GPS Geometry, and Mathematics II Science EOC: Biology and Physical Science Social Studies EOC: US History and Economics For Elementary and Middle Schools: ELA EOG Math EOG Science EOG Social Studies EOG The denominator value (by subject) is FAY Participants with an SGP. The numerator value is FAY Participants with an SGP meeting Typical or High Growth. Using the Progress Student Growth Percentiles data file, filter on FAY Participant = Yes and SGP Growth = Typical Growth and High Growth. For more information related to SGPs, click here. To calculate the Progress score, sum the counts of FAY Students with an SGP meeting Typical/High Growth. Also, sum the counts of FAY Students with an SGP. Divide the former by the latter to obtain the weighted performance. In 2015, the Progress score will be benchmarked at the 95 th percentile based on state level data for each grade band. The school s weighted performance will be divided by the decimal June 2, 2015 Page 40 of 61


41 value of the benchmark to obtain the adjusted performance. The adjusted performance is then multiplied by 25. The result is the Progress Points Earned. Achievement Gap Points Achievement Gap considers Gap Size and Gap Change. For these calculations, the scale scores for FAY students are standardized and converted to z scores. This conversion requires the use of the state mean and state standard deviation. Gap Size: This calculation finds the difference between the state mean of zero (0) and the mean z score of the lowest quartile by subject. This difference is compared to the following rubric and points are assigned. June 2, 2015 Page 41 of 61


42 Gap Change: This calculation finds the difference between the current year s gap size and the prior year s gap size. This difference is compared to the following rubric and points are assigned. Generally speaking, high performing schools may earn more points on gap size than they do on gap change. Low performing schools may earn more points on gap change than they do on gap size. In an effort to not advantage one type of school over another, the higher of the two scores by subject is awarded. The sum of the points earned is divided by the sum of the points possible. This quotient is multiplied by 15. The result is the Achievement Gap Points Earned. Performance Flags June 2, 2015 Page 42 of 61

43 Performance Flags are the means by which subgroup performance is reported. Performance Flags are triggered by Performance Targets. Performance Targets will be re-established for EOG assessments, EOC assessments, and graduation rates. Performance Targets will be established for the All Students group (State Target) as well as for each subgroup. The color of the flag describes the relationship between the performance of the subgroup as compared to the State Target and the Subgroup Target. Participation rates are a critical component of the Performance Flags as well. Schools are expected to assess 100% of their students. However, the requirement is 95%. The color and alpha coding of the Performance Flags is provided in the legend displayed above the flags. Challenge Points Challenge Points provide an opportunity for a school to earn up to 10 additional points which will be added to the overall CCRPI score. A school may earn more than 10 points but will only be awarded 10. There are two ways in which a school may earn Challenge Points: 1. ED/EL/SWD Performance 2. Exceeding the Bar Indicators ED/EL/SWD Performance Points This opportunity to earn additional points through ED/EL/SWD student performance acknowledges the school s academic performance challenge of having a significant number of ED/EL/SWD students. This calculation derives the school s percent of this population of students as well as utilizes the performance, via Performance Flags, of this population of students. 1. Calculate the percent of ED/EL/SWD students for each school. a. Denominator = the number of test scores for FAY Students b. Numerator = the number of test scores for FAY Students who are coded as ED/EL/SWD (non-duplicated count) June 2, 2015 Page 43 of 61
44 Example: i. A school has 1000 test scores for FAY Students, 600 are coded as ED/EL/SWD ii. The percent of test scores for ED/EL/SWD students in the school is 600/1000 = 60% 2. Calculate the maximum number of points, out of 10, that a school can earn based on the performance targets for ED/EL/SWD students a. Multiply the percent of ED/EL/SWD test scores for FAY Students by 10 i. 60% x 10 =.60 X 10 = is the maximum number of points the example school can earn based on the performance targets for ED/EL/SWD students 3. Calculate the percent of ED/EL/SWD subgroups meeting the subgroup level performance target for each subject assessment and graduation rate (for high schools only). a. # ED/EL/SWD subgroups meeting the subgroup performance target # ED/EL/SWD subgroups X 100 = % meeting i. High Schools have 27 possibilities for the subgroup to meet the performance target subgroups out of 27 meet the subgroup performance target 2. (20/27) X 100 = 74% ii. Elementary and Middle Schools have 15 possibilities for the subgroup to meet the performance target 4. Calculate the points earned a. Percent meeting subgroup performance target X maximum points = points earned toward overall score i % X 6 =.741 X 6 = 4.5 The values provided in the steps above are for demonstration purposes only. For each school, the values may differ. Exceeding the Bar Points Schools may earn 0.5 points for Exceeding the Bar indicators. Points are awarded on an all or nothing basis. For example, if the school has a STEM program or is a STEM school, then the school will be awarded 0.5 points. If the indicator requires a performance rate to be calculated, that performance is compared to the benchmark. If the performance meets the benchmark or is higher than the benchmark, then 0.5 point is awarded. The benchmarks are calculated based on state level data and are set at the 95 th percentile. June 2, 2015 Page 44 of 61

45 CCRPI Score The overall CCRPI score is the sum of the following components: Achievement Points Progress Points Achievement Gap Points Challenge Points If a school does not have enough FAY students with test scores to receive Progress Points or Achievement Gap Points and an NA is displayed for Progress Points or Achievement Gap Points, then remove the point value from 100. Examples: Achievement Gap: 15 out of 100 points = = / 85 = x 100 = rounds to 93.2 Progress: 25 out of 100 points Achievement Gap is allotted 15 points = = / 60 = x 100 = = June 2, 2015 Page 45 of 61

46 rounds to 85.8 A similar methodology will be used for a school s single score calculation. Since the elementary and high school portions of this K-12 school do not have a CCRPI score, the percent of Enrollment by Band for these schools will not be included when calculating the School Score. Based on the example above, 100% of the score is derived from the middle school s score. District and State CCRPI Scores All aspects of the calculations performed at the school level apply at the district and state level. Therefore, there is continuity from a school s report, to a district report, to the state report. The only exceptions are the use of the Exceeding the Bar indicators. ETBs were designed as school-based indicators. They were not intended to be used for the district and state CCRPI reports. However, to provide consistency across the three levels of reports, ETBs are used when calculating a single score at the district and state level. On the district s system report, all schools are listed with the total points awarded for ETBs. These points are averaged and added to the grade band score to obtain an Updated Score. This Updated Score is then weighted by enrollment for that grade band to obtain the Proportional Points. The Proportional Points are added to obtain the District Score. The same methodology is utilized to obtain a State Score. The screen shot below displays the use of the ETB points earned by each school and how they are used in the single score calculation. Below is a screen shot of the state s single score report. June 2, 2015 Page 46 of 61
College and Career Ready Performance Index, High School, Grades 9-12
 Dr. John D. Barge, State School Superintendent Making Education Work for All of Georgia s Students College and Career Ready Performance Index, High School, Grades 9-12 CONTENT MASTERY (END of COURSE TESTS
African American Male Achievement Update
 Report from the Department of Research, Evaluation, and Assessment Number 8 January 16, 2009 African American Male Achievement Update AUTHOR: Hope E. White, Ph.D., Program Evaluation Specialist Department
DAS-REMI District Accountability System Reporting, Evaluating, and Monitoring Instrument for the P2E2020SBP
 DAS-REMI District Accountability System Reporting, Evaluating, and Monitoring Instrument for the P2E2020SBP Prepared by the Board Accountability Committee DAS REMI 2015-16 1 Board Approved: September 2,
FTE General Instructions
 Florida Department of Education Bureau of PK-20 Education Data Warehouse and Office of Funding and Financial Reporting FTE General Instructions 2017-18 Questions and comments regarding this publication
Jefferson County School District Testing Plan
 Jefferson County School District Testing Plan All roles and responsibilities outlined in the Student Assessment Handbook (SAH) provided by the Georgia Department of Education are incorporated into the
School Improvement Fieldbook A Guide to Support College and Career Ready Graduates School Improvement Plan
 School Improvement Plan July 2012 Page 1 of 16 SCHOOL IMPROVEMENT PLAN School Name: Pickens High School District Name: Pickens County Principal Name: Chris LeMieux School Year: 2015-16 Title I Schoolwide
Kansas Adequate Yearly Progress (AYP) Revised Guidance
 Revised Guidance") Kansas State Department of Education Kansas Adequate Yearly Progress (AYP) Revised Guidance Based on Elementary & Secondary Education Act, No Child Left Behind (P.L. 107-110) Revised May 2010 Revised May
Kansas State Department of Education Kansas Adequate Yearly Progress (AYP) Revised Guidance Based on Elementary & Secondary Education Act, No Child Left Behind (P.L. 107-110) Revised May 2010 Revised May
Miami-Dade County Public Schools
 ENGLISH LANGUAGE LEARNERS AND THEIR ACADEMIC PROGRESS: 2010-2011 Author: Aleksandr Shneyderman, Ed.D. January 2012 Research Services Office of Assessment, Research, and Data Analysis 1450 NE Second Avenue,
Historical Overview of Georgia s Standards. Dr. John Barge, State School Superintendent
 Historical Overview of Georgia s Standards Dr. John Barge, State School Superintendent Georgia s Comprehensive Plan for Education Improvement College and Career Georgia Performance Standards (CCGPS) ELA
NORTH CAROLINA VIRTUAL PUBLIC SCHOOL IN WCPSS UPDATE FOR FALL 2007, SPRING 2008, AND SUMMER 2008
 E&R Report No. 08.29 February 2009 NORTH CAROLINA VIRTUAL PUBLIC SCHOOL IN WCPSS UPDATE FOR FALL 2007, SPRING 2008, AND SUMMER 2008 Authors: Dina Bulgakov-Cooke, Ph.D., and Nancy Baenen ABSTRACT North
School Year 2017/18. DDS MySped Application SPECIAL EDUCATION. Training Guide
 SPECIAL EDUCATION School Year 2017/18 DDS MySped Application SPECIAL EDUCATION Training Guide Revision: July, 2017 Table of Contents DDS Student Application Key Concepts and Understanding... 3 Access to
Parent s Guide to the Student/Parent Portal
 Nova Scotia Public Education System Parent s Guide to the Student/Parent Portal Revision Date: The Student/Parent Portal is your gateway into the classroom of the children associated to your account. The
FLORIDA. -Mindingall. Portilla Dr. Wilbert. endent of School. Superinte. Associate Curriculum. Assistant
 Miami-Dade County Public Schools Curriculum Bulletin 2012-2013 THE SCHOOL BOARD OF MIAMI-D DADE COUNTY, FLORIDA Ms. Perla Tabares Hantman, Chair Dr. Lawrence S. Feldman, Vice Chair Dr. Dorothy Bendross-
Getting Results Continuous Improvement Plan
 Page of 9 9/9/0 Department of Education Market Street Harrisburg, PA 76-0 Getting Results Continuous Improvement Plan 0-0 Principal Name: Ms. Sharon Williams School Name: AGORA CYBER CS District Name:
Undergraduate Admissions Standards for the Massachusetts State University System and the University of Massachusetts. Reference Guide April 2016
 Undergraduate Admissions Standards for the Massachusetts State University System and the University of Massachusetts Reference Guide April 2016 Massachusetts Department of Higher Education One Ashburton
NDPC-SD Data Probes Worksheet
 NDPC-SD Data Probes Worksheet This worksheet from the National Dropout Prevention Center for Students with Disabilities (NDPC- SD) is an optional tool to help schools organize multiple years of student
Welcome Parents! Class of 2021
 Welcome Parents! Class of 2021 How to prepare for CHS! Finish strong!! 4 th quarter determines fall eligibility. Good habits now mean a successful start next year. Tour of CHS Volunteers from the class
ILLINOIS DISTRICT REPORT CARD
 -6-525-2- HAZEL CREST SD 52-5 HAZEL CREST SD 52-5 HAZEL CREST, ILLINOIS and federal laws require public school districts to release report cards to the public each year. 2 7 ILLINOIS DISTRICT REPORT CARD
ILLINOIS DISTRICT REPORT CARD
 -6-525-2- Hazel Crest SD 52-5 Hazel Crest SD 52-5 Hazel Crest, ILLINOIS 2 8 ILLINOIS DISTRICT REPORT CARD and federal laws require public school districts to release report cards to the public each year.
SER CHANGES~ACCOMMODATIONS PAGES
 EAST PARISH SCHOOL BOARD EXCEPTIONAL STUDENT SERVICES DEPARTMENT Excellence in Education! 12732 SILLIMAN STREET. P.O. BOX 397 CLINTON, LOUISIANA 70722 PHONE: (225) 683-8582 FAX: (225) 683-8525 www.efpsb.k12.la.us
Cooper Upper Elementary School
 LIVONIA PUBLIC SCHOOLS www.livoniapublicschools.org/cooper 213-214 BOARD OF EDUCATION 213-14 Mark Johnson, President Colleen Burton, Vice President Dianne Laura, Secretary Tammy Bonifield, Trustee Dan
ENGLISH LANGUAGE LEARNERS (ELL) UPDATE FOR SUNSHINE STATE TESOL 2013
 UPDATE FOR SUNSHINE STATE TESOL 2013") ENGLISH LANGUAGE LEARNERS (ELL) UPDATE FOR SUNSHINE STATE TESOL 2013 Presented by: Chane Eplin, Bureau Chief Student Achievement through Language Acquisition Florida Department of Education May 16, 2013
ENGLISH LANGUAGE LEARNERS (ELL) UPDATE FOR SUNSHINE STATE TESOL 2013 Presented by: Chane Eplin, Bureau Chief Student Achievement through Language Acquisition Florida Department of Education May 16, 2013
Exams: Accommodations Guidelines. English Language Learners
 PSSA Accommodations Guidelines for English Language Learners (ELLs) [Arlen: Please format this page like the cover page for the PSSA Accommodations Guidelines for Students PSSA with IEPs and Students with
National Longitudinal Study of Adolescent Health. Wave III Education Data
 National Longitudinal Study of Adolescent Health Wave III Education Data Primary Codebook Chandra Muller, Jennifer Pearson, Catherine Riegle-Crumb, Jennifer Harris Requejo, Kenneth A. Frank, Kathryn S.
A Guide to Adequate Yearly Progress Analyses in Nevada 2007 Nevada Department of Education
 A Guide to Adequate Yearly Progress Analyses in Nevada 2007 Nevada Department of Education Note: Additional information regarding AYP Results from 2003 through 2007 including a listing of each individual
Overview Transmission Dates What s New Contracts and Salaries CPI and PSC Codes Items to Remember Reports
 Overview Transmission Dates What s New Contracts and Salaries CPI and PSC Codes Items to Remember Reports Certified and Classified Personnel Information (Board Rule 160-5-2-.50) Reporting of certified
Georgia Department of Education
 Georgia Department of Education Early Intervention Program (EIP) Guidance 2014-2015 School Year The Rubrics are required for school districts to use along with other supporting documents in making placement
Colorado s Unified Improvement Plan for Schools for Online UIP Report
 Colorado s Unified Improvement Plan for Schools for 2015-16 Online UIP Report Organization Code: 2690 District Name: PUEBLO CITY 60 Official 2014 SPF: 1-Year Executive Summary How are students performing?
QUESTIONS and Answers from Chad Rice?
 QUESTIONS and Answers from Chad Rice? If a teacher, who teaches in a self contained ED class, only has 3 students, must she do SLOs? For these teachers that do not have enough students to capture The 6
Shelters Elementary School
 Shelters Elementary School August 2, 24 Dear Parents and Community Members: We are pleased to present you with the (AER) which provides key information on the 23-24 educational progress for the Shelters
Using SAM Central With iread
 Using SAM Central With iread January 1, 2016 For use with iread version 1.2 or later, SAM Central, and Student Achievement Manager version 2.4 or later PDF0868 (PDF) Houghton Mifflin Harcourt Publishing
Illinois State Board of Education Student Information System. Annual Fall State Bilingual Program Directors Meeting
 Illinois State Board of Education Student Information System Annual Fall State Bilingual Program Directors Meeting 1 September 2013 Agenda ISBE SIS Project Team Capture of Culturally and Linguistically
Data Diskette & CD ROM
 Data File Format Data Diskette & CD ROM Texas Assessment of Academic Skills Fall 2002 through Summer 2003 Exit Level Test Administrations Attention Macintosh Users To accommodate Macintosh systems a delimiter
Extending Place Value with Whole Numbers to 1,000,000
 Grade 4 Mathematics, Quarter 1, Unit 1.1 Extending Place Value with Whole Numbers to 1,000,000 Overview Number of Instructional Days: 10 (1 day = 45 minutes) Content to Be Learned Recognize that a digit
EFFECTS OF MATHEMATICS ACCELERATION ON ACHIEVEMENT, PERCEPTION, AND BEHAVIOR IN LOW- PERFORMING SECONDARY STUDENTS
 EFFECTS OF MATHEMATICS ACCELERATION ON ACHIEVEMENT, PERCEPTION, AND BEHAVIOR IN LOW- PERFORMING SECONDARY STUDENTS Jennifer Head, Ed.S Math and Least Restrictive Environment Instructional Coach Department
State of New Jersey
 OVERVIEW 1213 GRADE SPAN KG6 116946 GALLOWAY, NEW JERSEY 85 This school's academic performance is about average when compared to schools across the state. Additionally, its academic performance is very
The Condition of College & Career Readiness 2016
 The Condition of College and Career Readiness This report looks at the progress of the 16 ACT -tested graduating class relative to college and career readiness. This year s report shows that 64% of students
Pathways to College Preparatory Advanced Academic Offerings in the Anchorage School District
 Pathways to College Preparatory Advanced Academic Offerings in the Anchorage School District Prepared by: Rosyland Frazier Diane Hirshberg Prepared for: CITC s Anchorage Realizing Indigenous Student Excellence
64% :Trenton High School. School Grade A; AYP-No. *FCAT Level 3 and Above: Reading-80%; Math-
 I. Current School Status: A. School Information: 1. School-Level Information: a. School: Trenton High School b. Principal's name: Cheri Langford c. School Advisory Council chair's name: Heather Rucker
Spring Valley Academy Credit Flexibility Plan (CFP) Overview
 Overview") Overview Ohio Senate Bill 311 allows alternate pathways for those students who are eligible to receive high school credit through the use of Credit Flexibility Plans (CFPs). Spring Valley Academy students
Overview Ohio Senate Bill 311 allows alternate pathways for those students who are eligible to receive high school credit through the use of Credit Flexibility Plans (CFPs). Spring Valley Academy students
Regions Of Georgia For 2nd Grade
 Regions Of Georgia For 2nd Grade Free PDF ebook Download: Regions Of Georgia For 2nd Grade Download or Read Online ebook regions of georgia for 2nd grade in PDF Format From The Best User Guide Database
Section V Reclassification of English Learners to Fluent English Proficient
 Section V Reclassification of English Learners to Fluent English Proficient Understanding Reclassification of English Learners to Fluent English Proficient Decision Guide: Reclassifying a Student from
2013 TRIAL URBAN DISTRICT ASSESSMENT (TUDA) RESULTS
 RESULTS") 3 TRIAL URBAN DISTRICT ASSESSMENT (TUDA) RESULTS Achievement and Accountability Office December 3 NAEP: The Gold Standard The National Assessment of Educational Progress (NAEP) is administered in reading
3 TRIAL URBAN DISTRICT ASSESSMENT (TUDA) RESULTS Achievement and Accountability Office December 3 NAEP: The Gold Standard The National Assessment of Educational Progress (NAEP) is administered in reading
PowerTeacher Gradebook User Guide PowerSchool Student Information System
 PowerSchool Student Information System Document Properties Copyright Owner Copyright 2007 Pearson Education, Inc. or its affiliates. All rights reserved. This document is the property of Pearson Education,
Academic Advising Manual
 Academic Advising Manual Revised 17 July 2013 1 Academic Advising Manual Table of Contents I. Academic Advising Mission Statement. 3 II. Goals and Responsibilities of Advisors and Students 3-5 III. Characteristics
Evaluation of Teach For America:
 EA15-536-2 Evaluation of Teach For America: 2014-2015 Department of Evaluation and Assessment Mike Miles Superintendent of Schools This page is intentionally left blank. ii Evaluation of Teach For America:
Moving the Needle: Creating Better Career Opportunities and Workforce Readiness. Austin ISD Progress Report
 Moving the Needle: Creating Better Career Opportunities and Workforce Readiness Austin ISD Progress Report 2013 A Letter to the Community Central Texas Job Openings More than 150 people move to the Austin
Two-thirds of APS Schools Increase on State CCRPI Scores
 Contact: Latisha Gray Office: 404-802-2816 Cell: 414-688-1478 Latisha.Gray@atlanta.k12.ga.us FOR IMMEDIATE RELEASE November 2, 2017 Two-thirds of APS s Increase on State CCRPI Scores 56 schools improve
John F. Kennedy Middle School
 John F. Kennedy Middle School CUPERTINO UNION SCHOOL DISTRICT Steven Hamm, Principal hamm_steven@cusdk8.org School Address: 821 Bubb Rd. Cupertino, CA 95014-4938 (408) 253-1525 CDS Code: 43-69419-6046890
Cooper Upper Elementary School
 LIVONIA PUBLIC SCHOOLS http://cooper.livoniapublicschools.org 215-216 Annual Education Report BOARD OF EDUCATION 215-16 Colleen Burton, President Dianne Laura, Vice President Tammy Bonifield, Secretary
2013 District STAR Coordinator Workshop
 2013 District STAR Coordinator Workshop Objectives District STAR coordinators will Follow current STAR procedures properly. Ensure all materials are handled securely and appropriately. Train site coordinators
Standardized Assessment & Data Overview December 21, 2015
 Standardized Assessment & Data Overview December 21, 2015 Peters Township School District, as a public school entity, will enable students to realize their potential to learn, live, lead and succeed. 2
CONNECTICUT GUIDELINES FOR EDUCATOR EVALUATION. Connecticut State Department of Education
 CONNECTICUT GUIDELINES FOR EDUCATOR EVALUATION Connecticut State Department of Education October 2017 Preface Connecticut s educators are committed to ensuring that students develop the skills and acquire
Iowa School District Profiles. Le Mars
 Iowa School District Profiles Overview This profile describes enrollment trends, student performance, income levels, population, and other characteristics of the public school district. The report utilizes
READY OR NOT? CALIFORNIA'S EARLY ASSESSMENT PROGRAM AND THE TRANSITION TO COLLEGE
 READY OR NOT? CALIFORNIA'S EARLY ASSESSMENT PROGRAM AND THE TRANSITION TO COLLEGE Michal Kurlaender University of California, Davis Policy Analysis for California Education March 16, 2012 This research
KDE Comprehensive School. Improvement Plan. Harlan High School
 KDE Comprehensive School Improvement Plan Harlan Independent Britt Lawson, Principal 420 E Central St Harlan, KY 40831 Document Generated On December 22, 2014 TABLE OF CONTENTS Introduction 1 Executive
CHANCERY SMS 5.0 STUDENT SCHEDULING
 CHANCERY SMS 5.0 STUDENT SCHEDULING PARTICIPANT WORKBOOK VERSION: 06/04 CSL - 12148 Student Scheduling Chancery SMS 5.0 : Student Scheduling... 1 Course Objectives... 1 Course Agenda... 1 Topic 1: Overview
Annual Report to the Public. Dr. Greg Murry, Superintendent
 Annual Report to the Public Dr. Greg Murry, Superintendent 1 Conway Board of Education Ms. Susan McNabb Mr. Bill Clements Mr. Chuck Shipp Mr. Carl Barger Dr. Adam Lamey Dr. Quentin Washispack Mr. Andre
Undergraduate Degree Requirements Regulations
 Undergraduate Degree Requirements Regulations LSU has the responsibility to protect its educational mission and the health and safety of its community and of the property therein, through regulating the
Manasquan Elementary School State Proficiency Assessments. Spring 2012 Results
 Manasquan Elementary School State Proficiency Assessments Spring 2012 Results Assessments Administered 2012 ACCESS for ELL S- State mandated for English Language Learners. NJPASS- for Grade 2 School Optional.
HIGHLAND HIGH SCHOOL CREDIT FLEXIBILITY PLAN
 HIGHLAND HIGH SCHOOL CREDIT FLEXIBILITY PLAN TABLE OF CONTENTS Overview 1 Eligible Credit Flexibility Plans 2 Earned Credit from Credit Flexibility Plans 2 Student Athletes 3 Application Process 3 Final
Grade 5 + DIGITAL. EL Strategies. DOK 1-4 RTI Tiers 1-3. Flexible Supplemental K-8 ELA & Math Online & Print
 Standards PLUS Flexible Supplemental K-8 ELA & Math Online & Print Grade 5 SAMPLER Mathematics EL Strategies DOK 1-4 RTI Tiers 1-3 15-20 Minute Lessons Assessments Consistent with CA Testing Technology
Testing Schedule. Explained
 2014 2015 Testing Schedule Explained Jennifer Dugan Leading for educational excellence and equity. Every day for every one. Agenda Requirements and implementation of legislation Testing schedule for 2014
Port Graham El/High. Report Card for
 School: District: Kenai Peninsula Grades: K - 12 School Enrollment: 20 Title I School? No Title 1 Program: Accreditation: Report Card for 2008-2009 A Title 1 school receives federal money in support low-achieving
Early Warning System Implementation Guide
 Linking Research and Resources for Better High Schools betterhighschools.org September 2010 Early Warning System Implementation Guide For use with the National High School Center s Early Warning System
Student Handbook. Supporting Today s Students with the Technology of Tomorrow
 Student Handbook Supporting Today s Students with the Technology of Tomorrow Page 2 Student Handbook LOGAN ACADEMY OF VIRTUAL ACADEMICS Page 3 Table of Contents About LAVA 4 Enrollment 5 Graduation Requirements
EDUCATIONAL ATTAINMENT
 EDUCATIONAL ATTAINMENT By 2030, at least 60 percent of Texans ages 25 to 34 will have a postsecondary credential or degree. Target: Increase the percent of Texans ages 25 to 34 with a postsecondary credential.
Illinois Assessment Update. Illinois State Board of Education July 07, 2017
 Illinois Assessment Update Illinois State Board of Education July 07, 2017 PARCC 2018 Test Administration Window March 5, 2018 to April 20, 2018 2 2016-17 PARCC (Partnership for Assessment of Readiness
Montana's Distance Learning Policy for Adult Basic and Literacy Education
 Montana's Distance Learning Policy for Adult Basic and Literacy Education 2013-2014 1 Table of Contents I. Introduction Page 3 A. The Need B. Going to Scale II. Definitions and Requirements... Page 4-5
UPPER ARLINGTON SCHOOLS
 UPPER ARLINGTON SCHOOLS SERVE LEAD SUCCEED CHALLENGE AND SUPPORT EVERY STUDENT, EVERY STEP OF THE WAY. 2014-2015 www.uaschools.org 1950 North Mallway Drive Upper Arlington, Ohio 43221 (614) 487-5000 Introduction
Elementary and Secondary Education Act ADEQUATE YEARLY PROGRESS (AYP) 1O1
 1O1") Elementary and Secondary Education Act ADEQUATE YEARLY PROGRESS (AYP) 1O1 1 AYP Elements ALL students proficient by 2014 Separate annual proficiency goals in reading & math 1% can be proficient at district
Elementary and Secondary Education Act ADEQUATE YEARLY PROGRESS (AYP) 1O1 1 AYP Elements ALL students proficient by 2014 Separate annual proficiency goals in reading & math 1% can be proficient at district
Orleans Central Supervisory Union
 Orleans Central Supervisory Union Vermont Superintendent: Ron Paquette Primary contact: Ron Paquette* 1,142 students, prek-12, rural District Description Orleans Central Supervisory Union (OCSU) is the
Delaware Performance Appraisal System Building greater skills and knowledge for educators
 Delaware Performance Appraisal System Building greater skills and knowledge for educators DPAS-II Guide for Administrators (Assistant Principals) Guide for Evaluating Assistant Principals Revised August
Financing Education In Minnesota
 Financing Education In Minnesota 2016-2017 Created with Tagul.com A Publication of the Minnesota House of Representatives Fiscal Analysis Department August 2016 Financing Education in Minnesota 2016-17
Statistical Peers for Benchmarking 2010 Supplement Grade 11 Including Charter Schools NMSBA Performance 2010
 Statistical Peers for Benchmarking 2010 Supplement Grade 11 Including Charter Schools NMSBA Performance 2010 September 2010 River Dunavin 1 ALBUQUERQUE PUBLIC SCHOOLS BOARD OF EDUCATION PAULA MAES Vice
Table of Contents PROCEDURES
 1 Table of Contents PROCEDURES 3 INSTRUCTIONAL PRACTICE 3 INSTRUCTIONAL ACHIEVEMENT 3 HOMEWORK 4 LATE WORK 5 REASSESSMENT 5 PARTICIPATION GRADES 5 EXTRA CREDIT 6 ABSENTEEISM 6 A. Enrolled Students 6 B.
Procedures for Academic Program Review. Office of Institutional Effectiveness, Academic Planning and Review
 Procedures for Academic Program Review Office of Institutional Effectiveness, Academic Planning and Review Last Revision: August 2013 1 Table of Contents Background and BOG Requirements... 2 Rationale
PROGRESS MONITORING FOR STUDENTS WITH DISABILITIES Participant Materials
 Instructional Accommodations and Curricular Modifications Bringing Learning Within the Reach of Every Student PROGRESS MONITORING FOR STUDENTS WITH DISABILITIES Participant Materials 2007, Stetson Online
2015 High School Results: Summary Data (Part I)
") 1 2015 High School Results: Summary Data (Part I) October 27, 2015 Dr. Gregory E. Thornton CEO, Baltimore City Public Schools Theresa D. Jones Chief Achievement and Accountability Officer HS Data Summary
1 2015 High School Results: Summary Data (Part I) October 27, 2015 Dr. Gregory E. Thornton CEO, Baltimore City Public Schools Theresa D. Jones Chief Achievement and Accountability Officer HS Data Summary
COLLEGE ACCESS LESSON PLAN AND HANDOUTS
 NEW! Handouts for classroom visits are now inside of the Be What I Want To Be magazine! You are encouraged to keep at least one set (35 copies) of handouts on you at all times in the event that the magazines
EAP. updates KHENG WAICHE. early proficiency programs coordinator
 EAP updates 2016 KHENG WAICHE early proficiency programs coordinator 2015 CAASPP EAP Testing ü 3.2 million students tested in grades 3-11. ü California tested the largest number of students in the Smarter
Guidelines for the Iowa Tests
 Guidelines for the Iowa Tests Iowa Tests of Basic Skills (ITBS), Grades K-8 Iowa Test of Educational Development (ITED), Grades 9-12 PLAN B GIFTED PROGRAM ELIGIBILITY 2015-2016 MIAMI-DADE COUNTY PUBLIC
New Features & Functionality in Q Release Version 3.2 June 2016
 in Q Release Version 3.2 June 2016 Contents New Features & Functionality 3 Multiple Applications 3 Class, Student and Staff Banner Applications 3 Attendance 4 Class Attendance 4 Mass Attendance 4 Truancy
Frequently Asked Questions and Answers
 Definition and Responsibilities 1. What is home education? Frequently Asked Questions and Answers Section 1002.01, F.S., defines home education as the sequentially progressive instruction of a student
RECRUITMENT AND EXAMINATIONS
 CHAPTER V: RECRUITMENT AND EXAMINATIONS RULE 5.1 RECRUITMENT Section 5.1.1 Announcement of Examinations RULE 5.2 EXAMINATION Section 5.2.1 Determination of Examinations 5.2.2 Open Competitive Examinations
HIGH SCHOOL COURSE DESCRIPTION HANDBOOK
 HIGH SCHOOL COURSE DESCRIPTION HANDBOOK 2015-2016 The American International School Vienna HS Course Description Handbook 2015-2016 Page 1 TABLE OF CONTENTS Page High School Course Listings 2015/2016 3
Big Ideas Math Grade 6 Answer Key
 Big Ideas Math Grade 6 Answer Key Free PDF ebook Download: Big Ideas Math Grade 6 Answer Key Download or Read Online ebook big ideas math grade 6 answer key in PDF Format From The Best User Guide Database
FLOWERY BRANCH HIGH SCHOOL. A Global Studies & Leadership Academy
 FLOWERY BRANCH HIGH SCHOOL A Global Studies & Leadership Academy 6603 Spout Springs Road Flowery Branch, GA 30542 Phone: 770-967-8000 Fax: 770-967-1218 Website: www.hallco.org/fbhs STUDENT HANDBOOK 2015-2016
ACHE DATA ELEMENT DICTIONARY as of October 6, 1998
 ACHE DATA ELEMENT DICTIONARY as of October 6, 1998 Element Title: Reference Numbers: Institution FICE Code FICE ST010, GR010 The identification number for each reporting institution will be the institution's
Page 1 of 11. Curriculum Map: Grade 4 Math Course: Math 4 Sub-topic: General. Grade(s): None specified
: None specified") Curriculum Map: Grade 4 Math Course: Math 4 Sub-topic: General Grade(s): None specified Unit: Creating a Community of Mathematical Thinkers Timeline: Week 1 The purpose of the Establishing a Community
Curriculum Map: Grade 4 Math Course: Math 4 Sub-topic: General Grade(s): None specified Unit: Creating a Community of Mathematical Thinkers Timeline: Week 1 The purpose of the Establishing a Community
Basic Skills Plus. Legislation and Guidelines. Hope Opportunity Jobs
 Basic Skills Plus Legislation and Guidelines Hope Opportunity Jobs Page 2 of 7 Basic Skills Plus Legislation When the North Carolina General Assembly passed the 2010 budget bill, one of their legislative
Testing for the Homeschooled High Schooler: SAT, ACT, AP, CLEP, PSAT, SAT II
 Testing for the Homeschooled High Schooler: SAT, ACT, AP, CLEP, PSAT, SAT II Does my student *have* to take tests? What exams do students need to take to prepare for college admissions? What are the differences
Illinois State Board of Education Student Information System. Annual Fall State Bilingual Program Directors Meeting
 Illinois State Board of Education Student Information System Annual Fall State Bilingual Program Directors Meeting 1 October 2010 Agenda ISBE SIS Project Team ELL Screener English Language Learners (ELL)
Institution-Set Standards: CTE Job Placement Resources. February 17, 2016 Danielle Pearson, Institutional Research
 Institution-Set Standards: CTE Job Placement Resources February 17, 2016 Danielle Pearson, Institutional Research Standard 1.B.3 states: The institution establishes institution-set standards for student
Bellehaven Elementary
 Overall istrict: Albuquerque Public Schools Grade Range: KN-05 Code: 1229 School Grade Report Card 2013 Current Standing How did students perform in the most recent school year? are tested on how well
Idaho Public Schools
 Advanced Placement: Student Participation 13.5% increase in the number of students participating between 25 and 26 In 26: 3,79 Idaho Public School Students took AP Exams In 25: 3,338 Idaho Public School
The Oregon Literacy Framework of September 2009 as it Applies to grades K-3
 The Oregon Literacy Framework of September 2009 as it Applies to grades K-3 The State Board adopted the Oregon K-12 Literacy Framework (December 2009) as guidance for the State, districts, and schools
Learn & Grow. Lead & Show
 Learn & Grow Lead & Show LAKE WINDWARD ELEMENTARY STRATEGIC PLAN SY 2015/16 SY 2017/18 APPROVED AUGUST 2015 SECTION I. Strategic Planning Background and Approach In May 2012, the Georgia Board of Education
Houghton Mifflin Online Assessment System Walkthrough Guide
 Houghton Mifflin Online Assessment System Walkthrough Guide Page 1 Copyright 2007 by Houghton Mifflin Company. All Rights Reserved. No part of this document may be reproduced or transmitted in any form
Using Proportions to Solve Percentage Problems I
 RP7-1 Using Proportions to Solve Percentage Problems I Pages 46 48 Standards: 7.RP.A. Goals: Students will write equivalent statements for proportions by keeping track of the part and the whole, and by