Texas Academic Performance Report (TAPR)
|
|
|
- Wilfrid Caldwell
- 6 years ago
- Views:
Transcription
1 Kerrville Independent School District Texas Academic Performance Report (TAPR) Presented to the Board of Trustees, January 25, 2016 Dan Troxell, Ph.D., Superintendent Jack M. Stevens, Jr., President Raymond Orr, Vice President Rolinda Schmidt, Secretary Andree Hayes, Trustee District 1 Vickie Isom, Trustee District 4 David Sprouse, M.D., Trustee District 6 Patrick Freedle, Trustee District 7 For more information on the TAPR, please contact Heather Engstrom, Assistant Superintendent heather.engstrom@kerrvilleisd.net x1020
2 ^ % H v^ ^ December 1,2015 Phone: (830) ext. 235 Fax:(830) Dan Troxell, Ph.D. Superintendent 1009 Bamett Street Kerrville, TX Dear Parents and Patrons of KISD: This comprehensive report contains the Texas Academic Performance Report (TAPR). The statistical information found in this document provides great insight into both individual campus and district performance during the school year. The data in the TAPR is relied on heavily in the development of district and campus goal setting and improvement planning. The Kerrville Independent School District shares this performance profile with our Board of Trustees, staff, parents, and community each year. The Board of Trustees schedules a public hearing for discussion of this annual report, during which executive summaries of the entire report are shared with the Board, media, and public in attendance. The entire report is published and distributed to district campuses and to several community organizations. The TAPR Report is available online at Kerrville Independent School District can look back on with a great deal of pride. Several of the district's accomplishments have been summarized below. Earned the highest possible state accountability rating of Met Standards at each campus and at the district level. Scored in the top quartile of comparable Texas school districts and earned the Postsecondary Readiness Distinction Designation. This distinction was granted to only 24 school and charter districts out of a total of 1,227 Texas districts. One of ten districts in Texas to receive Postsecondary Readiness Distinction Designation two consecutive years. Exceeded state averages on all 2015 State of Texas Assessments of Academic Readiness (STAAR) subjects tested at the performance levels of Satisfactory Level II and Advanced Level III. Earned all Distinction Designations possible on the 2015 STAAR state accountability rating as a district and at Tivy High School and Tom Daniels Elementary School. All other eligible campuses earned two or more Distinction Designations. Increased the number of students taking Advanced Placement (AP) courses from 215 to 287 over a five year period and increased the number of AP examinations taken from 339 to 618 during a five year period ( ). Exceeded the 2015 state passing percentage on 14 AP subject examinations. Exceeded the 2015 AP mean scores for Texas, the United States, and the world (global) in ten subject areas. Equal Opportunity Employer Page I of 2
3 Exceeded the 2015 state average scores on ACT examinations in all tested subjects. Exceeded the 2015 SAT average state scores in all subjects. Exceeded the 2015 College-Ready Graduates percentages for the state and Region 20 in all measured areas for two consecutive years. The district's 4-Year Longitudinal Rate and 5-Year Longitudinal Rate exceeds the Region 20 and state rates. Achieved a 100% graduation rate (no drop-outs) for the Class of 2013 as reported on the Texas Academic Performance Report (TAPR). In addition to students excelling, the fiscal management of the district remains sound. The Texas Education Agency designated the Kerrville Independent School District financial management program as "Superior Achievement" for the 13th consecutive year. This is the highest financial rating a district may earn. Please review this report and come visit us. We would like the opportunity to show you where and how your tax dollars are being spent. The Kerrville Independent School District is grateful to our Kerrville community, parents, and staff who make a quality education possible for all children. Sincerely, DanTroxellPh.D. Superintendent Equal Opportunity Employer fage
4 T A P R (Texas Academic Performance Report) Table of Contents Kerrville ISD Mission Statement & Goals Campus Goals and Objectives PEIMS Financial Standard Report TAPR Glossary State Performance Report District Performance Report Campus Comparison Reports Campus Reports Tivy High School Hill Country High School Hal Peterson Middle School B. T. Wilson Sixth Grade School Daniels Elementary Starkey Elementary Nimitz Elementary Tally Elementary Early Childhood KCJDC SAT/ACT Score Report Report of High School Graduates Enrollment & Academic Performance in Texas Public Higher Education in FY 2014 Title IV Safe & Drug Free Disciplinary Report and Resiliency Building Programs for Students iii


5 Kerrville Independent School District MISSION STATEMENT The Mission Statement of the Kerrville Independent School District is to educate all students to be successful and productive citizens in a way that meets parent and community expectations through continual improvement in curriculum and instruction, a safe and orderly learning environment, sound fiscal management, and leadership dedicated to excellence DISTRICT GOALS Goal #1: Continue to refine curriculum, instructional practices, professional development, special programs, and instructional leadership to maximize individual student achievement for college and career readiness. Goal #2: Goal #3: Goal #4: Recruit, develop, and retain high-quality employees. Implement a district-wide, values based, safe schools model that incorporates positive campus climates, student involvement, school safety, accountability, and consequences for behavior. Maintain sound fiscal management of the district funds by maximizing revenues and by focusing expenditures towards student achievement while advocating for an adequate and equitable Texas public school finance system. iv
6 TIVY HIGH SCHOOL Campus Goals Goal 1: Add value to each student and improve student performance while closing achievement gaps between subpops. The Tivy High School EOC performance goals for the school year are based on each of the following Department Goals: Level II is measured at Final Recommended score. PASSING PERCENTAGE/ LEVEL II ADVANCED LEVEL III ELA - English I 80% 15% English II 80% 15% Math - Algebra I 80% 15% Social Studies - US History 95% 20% Science - Biology 95% 20% Advanced Placement 95% of students enrolled in Advanced Placement courses will take the corresponding exam; 87% of the students who take AP exams will score a 3, 4, or 5. Goal 2: Goal 3: Goal 4: Goal 5: Improve student attendance to 96% or above attendance rate. Implement a district-wide, values based, safe schools model that incorporates positive campus climates, student involvement, school safety, accountability, and consequences for behavior. Encourage parental involvement and provide parents of all students the opportunity to participate in school activities which promote student success. Provide quality development opportunities that support campus goals, objective, and district initiatives. v
7 HILL COUNTRY HIGH SCHOOL Campus Goals Goal 1: Goal 2: Goal 3: Goal 4: Goal 5: Goal 6: Impact student graduation by increasing the attendance rates for all alternative education campuses to exceed expectations established by the Texas Education Agency. Impact student graduation by reducing drop-out rates for each alternative education campus to be within the guidelines established by the Texas Education Agency. Successfully prepare students to meet expectations on the state-mandated EOC tests as established by the Texas Education Agency. Continue the curriculum alignment/review process to ensure that all courses meet TEKS requirements, address EOC objectives and provide students with a quality learning opportunity. Promote a balanced educational program by continuing initiatives that emphasize academic progress, character development, community service, campus safety and violence prevention. Promote student self-confidence in academic potential so that the number of Hill Country High School students who seek additional educational/technical training after graduation is increased. vi
8 HAL PETERSON MIDDLE SCHOOL GRADES 7 & Campus Goals Goal 1: Goal 2: Goal 3: Goal 4: Through the refinement of curriculum, instruction, and special programs, all students will show academic growth by meeting or exceeding goals set for each student group. Hal Peterson Middle School will provide opportunities to involve all parents in at least one activity that promotes success for all students. Hal Peterson Middle School will implement a district-wide, values based, safe schools model that incorporates positive campus climates, student involvement, school safety, accountability, and consequences for behavior. Hal Peterson Middle School, through KISD, will provide staff development opportunities that support campus goals, objectives, and district initiatives. vii
9 B. T. WILSON SIXTH GRADE SCHOOL Campus Goals Goal 1: Focus instruction to improve student performance and close achievement gaps among students to ensure all student groups will meet or exceed the mastery level on the state mandated assessment (STAAR Test) by the conclusion of the school year. Goal 2: Improve student attendance rate to meet or exceed 97%. Goal 3: Goal 4: Goal 5: Implement a district-wide, values based, safe schools model that incorporates positive campus climates, student involvement, school safety, accountability, and consequences for behavior. Encourage and increase parental involvement by providing parents the opportunity to participate in school activities which promote success and build rapport. Provide staff development opportunities which support the campus and/or district initiatives, programs, and strategies. viii
10 TOM DANIELS ELEMENTARY SCHOOL Campus Goals Goal 1: Goal 2: Implement a district-wide, values based, safe schools model that incorporates positive campus climates, student involvement, school safety, accountability, and consequences for behavior. Improve student performance and close achievement gaps among students so that all student groups (White, Hispanic, African-American, Economically Disadvantaged, English-Language Learners, and Special Education) will meet or exceed at least 90% mastery level on STAAR. Goal 3: Achieve or exceed an Average Daily Attendance (ADA) rate of 98%. Goal 4: Goal 5: Goal 6: Provide parent education and promote parent and community involvement. Provide staff development opportunities that match campus goals and objectives and support district initiatives. All students will be taught by highly qualified teachers and paraprofessionals. ix
11 STARKEY ELEMENTARY SCHOOL Campus Goals Goal 1: Improve student performance and close achievement gaps among students so that at least 90% of students in each subgroup will meet or exceed the mastery level on STAAR and provide support for every student to grow academically. Goal 2: Achieve or exceed an Average Daily Attendance (ADA) of 98%. Goal 3: Goal 4: Goal 5: Goal 6: Implement a district-wide, values based, safe schools model that incorporates positive campus climates, student involvement, school safety, accountability, and consequences for behavior. Encourage parental involvement and provide parents of all students the opportunity to participate in school activities which promote student success. Provide staff development opportunities which support the campus goals and objectives and district initiatives. Ensure that all students are taught by highly qualified teachers and paraprofessionals. x
12 NIMITZ ELEMENTARY SCHOOL Campus Goals Goal 1: Goal #2: Goal #3: Goal #4: Goal #5: Goal #6: Implement a district-wide, values based, safe schools model that incorporates positive campus climates, student involvement, school safety, accountability, and consequences for behavior. By the end of the school year, improve student performance and close achievement gaps among all students groups (White, Hispanic, African American, Economically Disadvantaged, Limited English Proficient, At-Risk, and Special Education) so that at least 90% of students in each sub group and 100% of identified GT students meet minimum expectations on STAAR (State of Texas Assessments of Academic Readiness) Reading, Math, Writing and Science, and that 90% of special ed. students meet expectations on their selected state assessments. Improve student attendance so that an Average Daily Attendance rate of 97% or above is achieved. Encourage and increase parental involvement in all school activities and involve parents in activities that promote success for all students. Provide staff development opportunities which support campus and district initiatives, programs and strategies. All students will be taught by highly qualified teachers and paraprofessionals. xi
13 FRED H. TALLY ELEMENTARY SCHOOL Campus Goals Goal 1: Improve student performance and close achievement gaps among students in order that by the end of the 2015 school year, all student groups (White, Hispanic, African-American, Economically Disadvantaged, and Special Education) will meet or exceed the 90% mastery level on STAAR. Goal 2: Improve student attendance ensuring a 98% attendance rate is achieved by Goal 3: Goal 4: Goal 5: Goal 6: Implement a district-wide, values based, safe schools model that incorporates positive campus climates, student involvement, school safety, accountability, and consequences for behavior. Encourage parental involvement and provide parents of all students the opportunity to participate in school activities which promote student success. Provide staff development opportunities which support the campus goals and objectives and district initiatives. Ensure all students are taught by highly qualified teachers and paraprofessionals. xii
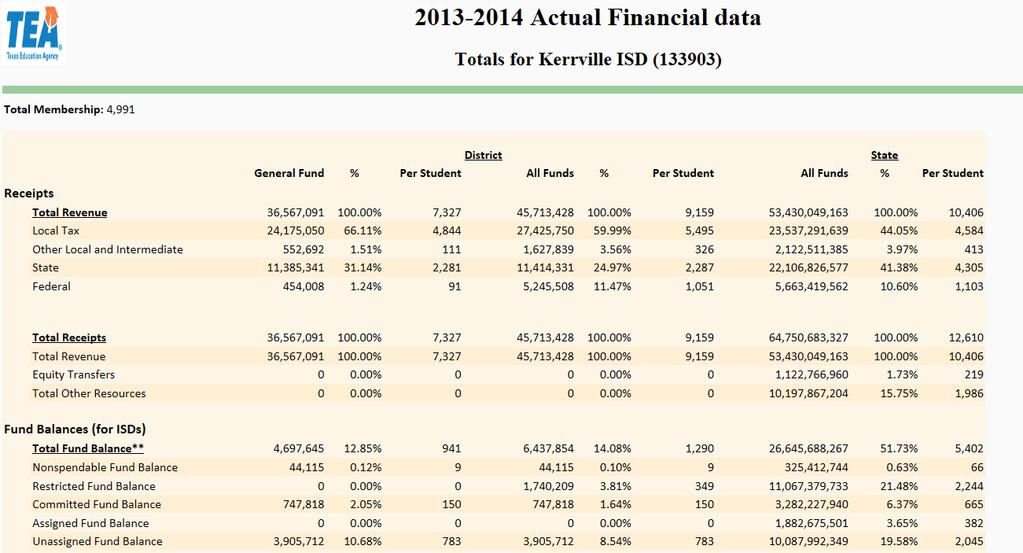
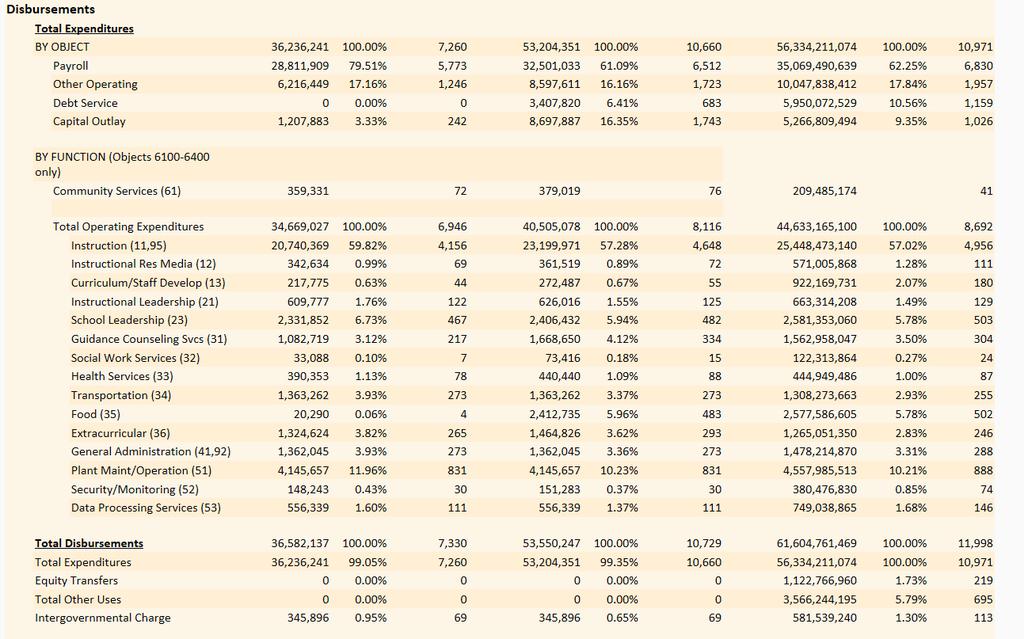
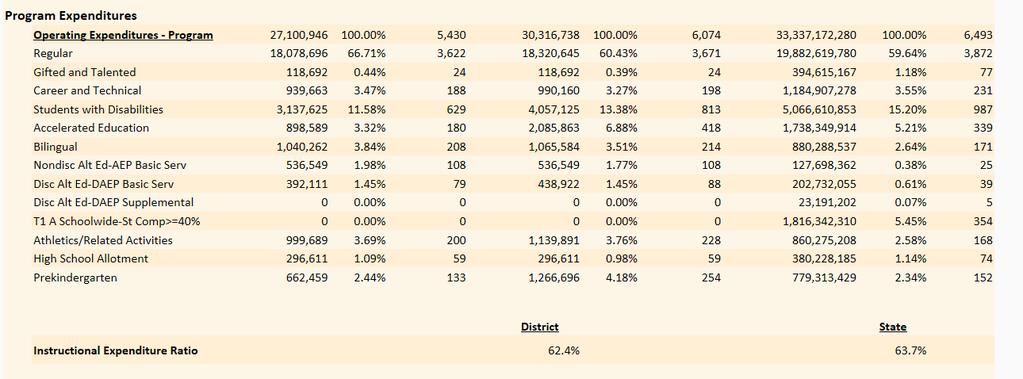
14 PEIMS Financial Standard Report of Financial Actual Information (The data for is not available until spring 2016, per TEA, data from is to be used)
15
16
17

18
19 Glossary November Texas Academic Performance Report Accountability Rating: The labels assigned to districts and campuses that designate acceptable and unacceptable performance in the state academic accountability system. Possible ratings are as follows: Met Standard Met Alternative Standard Improvement Required Not Rated Not Rated: Data Integrity Issues For a detailed explanation of this year s accountability system, see the 2015 Accountability Manual, available at Accountability Subset: The collection of STAAR assessment results that are used to determine district and campus accountability ratings. Campus-level accountability subset: Campuses are held accountable for only those students enrolled in the campus on both the snapshot date (the last Friday in October) and the testing date. For example, if a student was enrolled at one campus on October 31, 2014* but moved to another campus before the testing date, that student s performance is not included in the accountability results for either campus, whether or not the campuses are in the same district. District-level accountability subset: A district is held accountable for only those students enrolled in the district on both the snapshot date (the last Friday in October) and the testing date. For example, if a student was enrolled in one district on October 31, 2014* but moved to another district before the testing date, that student s performance is not included in the accountability results for either district. However, if that student had moved from one campus to another in the same district, his or her performance would have been included in that district s results, even though it was not included in the results for either campus. This means that district performance results may not match the sum of the campus performance results. *In the case of STAAR End-of-Course exams administered in July 2014, the accountability subset date is for the prior year, October 25, Advanced Course/Dual-Enrollment Completion: By subject area the percentage of students who complete and receive credit for at least one advanced course. TAPR includes completion percentages for grades 9-12 as well as grades Advanced courses include dual-enrollment courses. Dual-enrollment courses are those for which a student can earn both high school and college credit. Decisions about awarding high school credit for college courses is described in Texas Administrative Code 74.25, which states, in part the following: Texas Education Agency Assessment and Accountability Performance Reporting 1 of 28
20 TAPR Glossary November 2015 (b) To be eligible to enroll and be awarded credit toward state graduation requirements, a student must have the approval of the high school principal or other school official designated by the school district. The course for which credit is awarded must provide advanced academic instruction beyond, or in greater depth than, the essential knowledge and skills for the equivalent high school course. Appendix B lists all courses identified as advanced, with the exception of courses designated only as dual-enrollment. Dual-enrollment courses are not shown because they vary from campus to campus and could include a large proportion of all high school courses. Course completion information is reported by districts through the Public Education Information Management System (PEIMS) after the close of the school year. For example, the values, expressed as percentages for grades 11 12, are calculated as follows: number of students in grades who received credit for at least one advanced or dual enrollment course in number of students in grades who completed at least one course in This indicator was used in awarding distinction designations to high schools in For a detailed explanation of distinction designations, see Chapter 5 of the 2015 Accountability Manual. (Source of data: PEIMS, June 2014, June 2013) Advanced Placement Examinations: Please see AP/IB Results. Annual Dropout Rate: The percentage of students who drop out of school during one school year. Annual dropout rates are shown for districts and campuses that serve grades 7 8 and/or State law prohibits including a student who meets any of the following criteria from campus and district annual dropout rate calculations: Is ordered by a court to attend a high school equivalency certificate program but has not earned a high school equivalency certificate Was previously reported to the state as a dropout Was in attendance but who is not in membership for purposes of average daily attendance (i.e., students for whom school districts are not receiving state Foundation School Program [FSP] funds) Was initially enrolled in a school in the United States in any grade 7 through 12 as an unschooled refugee or asylee as defined by TEC (a-1) Is in the district exclusively as a function of having been detained at a county detention facility but is otherwise not a student of the district in which the facility is located Is incarcerated in a state jail or federal penitentiary as an adult or as a person certified to stand trial as an adult Texas Education Agency Assessment and Accountability Performance Reporting 2 of 28
21 TAPR Glossary November 2015 Two annual dropout rate indicators are shown: (1) Annual Dropout Rate (Gr 7 8). This includes only grades 7 and 8. It is calculated as follows: number of dropouts in grades 7 and 8 during the school year number of students in grades 7 and 8 who were in attendance at any time during the school year (2) Annual Dropout Rate (Gr 9 12). This includes grades 9 through 12. It is calculated as follows: number of dropouts in grades 9 through 12 during the school year number of students in grades 9 12 who were in attendance at any time during the school year Both annual rates appear on campus, district, region, and state TAPRs. However, the state and region annual dropout rates that are reported on district and campus TAPRs are calculated without the exclusions explained above. Note that with all annual dropout rate calculations, a cumulative count of students is used in the denominator. This method for calculating the dropout rate neutralizes the effect of mobility by including in the denominator every student ever reported in attendance at the district or campus throughout the school year, regardless of length of stay. For a more complete description of dropout rates and exclusions, see the Secondary School Completion and Dropouts in Texas Public Schools, reports, available on the TEA website at For detailed information on data sources, see Appendix K in the 2015 Accountability Manual. See also Dropout and Leaver Record. (Source of data: PEIMS, Aug and June 2015) Annual Graduates: The count of students who graduate from a district or campus in a school year regardless of cohort. This measure is separate from, and may include different students than, the longitudinal graduation rates. (Source of data: PEIMS, Aug and June 2015 AP/IB Results: The percentage of students who have taken the College Board s Advanced Placement (AP) examinations and/or the International Baccalaureate s (IB) Diploma Program examinations. High school students may take one or more of these examinations, ideally upon completion of AP or IB courses, and may receive advanced placement or credit, or both, upon entering college. Generally, colleges will award credit or advanced placement for scores of 3, 4, or 5 on AP examinations and scores of 4, 5, 6, or 7 on IB examinations. Requirements vary by college and by subject tested. The following two values are calculated for this indicator: (1) Tested. The percentage of students in grades 11 and 12 taking at least one AP or IB examination number of students in grade 11 and 12 who took at least one AP or IB examination number of grade 11 and 12 students Texas Education Agency Assessment and Accountability Performance Reporting 3 of 28
22 TAPR Glossary November 2015 (2) Examinees >= Criterion. The percentage of examinees with at least one AP or IB score at or above the criterion score (3 on AP or 4 on IB) number of examinees in grade 11 and 12 with at least one score at or above criterion number of examinees in grade 11 and 12 taking at least one AP or IB examination This indicator was used in determining the 2015 Postsecondary Readiness Distinction Designation for campuses and districts. For a detailed explanation of distinction designations, see Chapter 5 of the 2015 Accountability Manual. (Sources of data: The College Board, Aug. 2014, Jan. 2014; The International Baccalaureate Organization, Aug. 2014, Aug. 2013; and PEIMS, Oct. 2014, Oct. 2013) At-Risk: The count and percentage of students identified as being at risk of dropping out of school based on PEIMS 110 records. At-risk identification is based upon on state-defined criteria (TEC ). The percentage of at-risk students is calculated as the sum of the students coded as at risk of dropping out of school divided by the total number of students in membership: number of students coded as at risk total number of students Counts of at-risk students are shown in the Profile section of the campus, district, region, and state reports. State law defines a student as being at risk of dropping out of school if he or she is under 26 years of age and was not advanced from one grade level to the next for one or more school years; is in grades 7, 8, 9, 10, 11, or 12 and did not maintain an average equivalent to 70 on a scale of 100 in two or more subjects in the foundation curriculum during a semester in the preceding or current school year or is not maintaining such an average in two or more subjects in the foundation curriculum in the current semester; did not perform satisfactorily on an assessment instrument administered to the student under TEC Subchapter B, Chapter 39, and has not in the previous or current school year subsequently performed on that instrument or another appropriate instrument at a level equal to at least 110 percent of the level of satisfactory performance on that instrument; is in prekindergarten, kindergarten, or grades 1, 2, or 3 and did not perform satisfactorily on a readiness test or assessment instrument administered during the current school year; is pregnant or is a parent; has been placed in an alternative education program in accordance with TEC during the preceding or current school year; has been expelled in accordance with TEC during the preceding or current school year; Texas Education Agency Assessment and Accountability Performance Reporting 4 of 28
23 TAPR Glossary November 2015 is currently on parole, probation, deferred prosecution, or other conditional release; was previously reported through PEIMS to have dropped out of school; is a student of limited English proficiency, as defined by TEC ; is in the custody or care of the Department of Protective and Regulatory Services or has, during the current school year, been referred to the department by a school official, officer of the juvenile court, or law enforcement official; is homeless, as defined by 42 U.S.C., 11302, and its subsequent amendments; or resided in the preceding school year or resides in the current school year in a residential placement facility in the district, including a detention facility, substance abuse treatment facility, emergency shelter, psychiatric hospital, halfway house, or foster group home. (Source of data: PEIMS, Oct. 2014) Attendance Rate: The percentage of days students were present in Attendance rates reported in the TAPR are based on student attendance for the entire school year. Only students in grades 1 12 are included in the calculation. Attendance is calculated as follows: total number of days students were present in total number of days students were in membership in Attendance rates are shown for and This indicator was used in awarding distinction designations in For a detailed explanation of distinction designations, see Chapter 5 of the 2015 Accountability Manual. (Source of data: PEIMS, June 2014, June 2013) Auxiliary Staff (District Profile only): The count of full-time equivalent (FTE) staff reported in PEIMS employment and payroll records who are not reported in the PEIMS 090 Staff - Responsibilities record. The auxiliary staff are expressed as a percentage of total staff. For auxiliary staff, the FTE is the value of the percent of day worked. (Source of data: PEIMS, Oct. 2014) Average Actual Salaries (regular duties only): For each of the four categories, the total salary for that category divided by the total FTE count for that category. Only payment for regular duties is included in the total salary; supplemental payments for extra duties (e.g., coaching, band and orchestra assignments, club sponsorships) are not included. See Appendix A for lists of the PEIMS role IDs included in each category. Teachers. Teachers, special duty teachers, and substitute teachers. Substitute teachers are people who are either temporarily hired to replace a teacher who has quit, died, or been terminated or hired permanently on an as-needed basis. Campus Administration. Principals, assistant principals, and other administrators reported with a specific school ID. Texas Education Agency Assessment and Accountability Performance Reporting 5 of 28
24 TAPR Glossary November 2015 Central Administration. Superintendents, presidents, chief executive officers, chief administrative officers, business managers, athletic directors, and other administrators reported with a central office ID and not a specific school ID. Professional Support. Therapists, nurses, librarians, counselors, and other campus professional personnel. An employee who works half time and a reported actual salary of $30,000 has a full-time equivalent salary of $60,000. All average salaries are expressed in full-time equivalent form by dividing the sum of the actual salaries earned by the total FTE count. (Source of data: PEIMS, Oct. 2014) Average Teacher Salary by Years of Experience (regular duties only): Total pay for all teachers in each category divided by the total teacher FTE count for that category. The total actual salary amount is pay for regular duties only and does not include supplemental pay. For teachers who also have non-teaching roles, only the portion of time and pay dedicated to classroom responsibilities is factored into the average teacher salary calculation. (Source of data: PEIMS, Oct. 2014) Average Years Experience of Teachers: The average number of completed years of professional experience, regardless of district. Weighted (1 for a full-time teacher,.75 for a three-quarter-time teacher, and.5 for a half-time teacher) averages are calculated by multiplying each teacher s FTE coefficient by his or her years of experience. These amounts are summed for all teachers and divided by the sum of all teachers FTE coefficients. (Source of data: PEIMS, Oct. 2014) Average Years Experience of Teachers with District: The average number of years employed in the district whether or not there has been any interruption in service. Weighted averages are calculated by multiplying each teacher s FTE coefficient by his or her years of experience in the district. These amounts are summed for all teachers and divided by the sum of all teacher s coefficients. Bilingual Education/English as a Second Language Reports: The performance for selected indicators disaggregated by bilingual and English as a second language (ESL) instructional models. The TAPR shows the statutorily-required performance indicators disaggregated by eleven columns for students identified as limited English proficient (LEP) in the current school year. For definitions of the BE/ESL instructional programs, see the PEIMS Data Standards, available at Campus Number: A unique nine-digit number assigned to every Texas public school. It consists of the county number (assigned alphabetically from 001 to 254), followed by the district number (9 is used primarily for regular districts, 8 for charter operators), and ending with the campus number (generally 00_ for high schools, 04_ for middle schools, and 1 for elementary schools). Texas Education Agency Assessment and Accountability Performance Reporting 6 of 28
25 TAPR Glossary November 2015 Class Size Averages by Grade and Subject: The average class size for elementary classes (by grade) and for secondary classes (by subject) for selected subjects. Districts report class sizes through the PEIMS 090 (Staff Responsibility) record. Each 090 record is unique by campus ID, staff ID, service ID, and class ID number. The methodology for averaging class size differs depending on whether the class is elementary or secondary due to differences in reporting practices for these two types of teacher schedules. For secondary classes, each unique combination of teacher and class time is counted as a class. Averages are determined by summing the number of students served (in a given subject at the campus) and dividing by the calculated count of classes. For elementary classes, the number of records reported for each grade is considered. A teacher teaching all subjects to the same group of fourth graders all day will have only one record indicating the total number of fourth grade students served. However, an elementary teacher who teaches a single subject to five different sections of fourth graders each day will have five separate records reported, each with a unique count of students served. For example, one 4 th grade science teacher teaches five science classes each day with 18, 20, 19, 21, and 22 students in each class. The total of 100 students divided by the five classes produces an average class size of 20 students for that teacher. All of the following rules apply to the average class sizes: Classes identified as serving regular, compensatory/remedial, gifted and talented, career and technical, and honors students are included in the calculation. Subjects in the areas of English language arts (ELA), mathematics, science, social studies, languages other than English, computer science, and career and technical education are included in the calculation, as are self-contained classrooms. Classes where the number of students served is reported to be zero are not included. Service codes with the "SR" prefix are not included. Teacher roles coded as teacher and/or substitute teacher are included. Only class settings coded as "regular class" are included. Missing partial FTE counts are not included. Elementary classes in which the number of students exceeds 100 are not included. Mixed grade-level class averages are not included. (Source of data: PEIMS, Oct. 2014) College Admissions Tests: Please see SAT/ACT Results. College-Ready Graduates: The percentage of graduates that meet or exceed the collegeready criteria on the TAKS exit-level test, the SAT test, or the ACT test. The criteria for each are as follows: Texas Education Agency Assessment and Accountability Performance Reporting 7 of 28
26 TAPR Glossary November 2015 Subject Exit-level TAKS SAT ACT >= 2200 scale score on ELA test >=500 on Critical Reading ELA AND a 3 or higher on essay OR AND >=1070 Total OR Math >= 2200 scale score on mathematics test OR >=500 on Math AND >=1070 Total OR >= 19 on English AND >= 23 Composite >= 19 on Math AND >= 23 Composite This indicator calculates three values: (1) Eng Lang Arts. The percentage of graduates who scored at or above the criterion scores on the TAKS, SAT, or ACT English language arts tests. number of graduates who scored at or above the college-ready criterion for ELA number of graduates ( ) with ELA results to evaluate (2) Mathematics. The percentage of graduates who scored at or above the criterion score on the TAKS, SAT, or ACT mathematics tests. number of graduates who scored at or above the college-ready criterion for mathematics number of graduates ( ) with mathematics results to evaluate (3) Both Subjects. The percentage of graduates who scored at or above the criterion score on both the TAKS, SAT, or ACT ELA and mathematics tests. number of graduates who scored at or above the college-ready criteria on both ELA & mathematics number of graduates ( ) with results in both subjects to evaluate Performance is shown for the class of 2014 and Note that this indicator does not include performance on TAKS-Modified nor TAKS-Alternate. (Sources of data: TEA Student Assessment Division, The College Board, Aug. 2014, Aug. 2015, ACT, Inc. Oct. 2014, Oct. 2013; and PEIMS, Oct. 2014, Oct. 2013) College and Career Ready Graduates: The number of annual graduates demonstrate that they are prepared for postsecondary success in one of three ways: Meeting the TSI criteria in both ELA/reading and mathematics, as described above for College-Ready Graduates. Completing and earning credit for at least two advanced/dual-credit courses in the or school year Enrolling in a coherent sequence of CTE courses as part of a four-year plan of study to take two or more CTE courses for three or more credits (Sources of data: CAF, College Board, and ACT) Completion Rate: Please see Longitudinal Rates. Criterion Score: The scores on SAT and ACT college admissions tests, AP and IB tests, and College-Ready Graduates indicator. For the college admissions tests, the criterion scores are Texas Education Agency Assessment and Accountability Performance Reporting 8 of 28
27 TAPR Glossary November 2015 at least 24 on the ACT (composite) and at least 1110 on the SAT (critical reading and mathematics combined). For AP and IB tests, the criterion scores are at least 3 on AP tests, and at least 4 on IB tests. For College-Ready Graduates criterion scores, see College-Ready Graduates. Please note that each college and university establishes its own score criteria for admitting and granting advanced placement or credit to individual students. See also SAT/ACT Results and AP/IB Results. CTE Coherent Sequence Graduate: The percentage of graduates enrolled in a career and technical education (CTE) coherent sequence of courses as part of a four-year plan of study. Number of graduates who were enrolled in a CTE-coherent sequence of courses as part of a four-year plan of study to take two or more CTE courses for three or more credits (from PEIMS 400, 101 [summer]) Number of annual graduates (from PEIMS 203) Data Quality (District Profile only): The percentage of errors made by the district in two key data submissions: the PID Error rate in PEIMS Student Data and the percentage of Underreported Students in PEIMS Student Leaver Data. (1) PID Error Rate. The Person Identification Database (PID) system ensures that each time information is collected for a student, the identifying information matches other data collections for that student. This allows student data to be linked across time or data to be matched across years. For example, enrollment records, which are collected in October, can be linked to attendance records, which are collected in June. It also helps maintain student confidentiality by assigning an ID that protects the student s identifying information. When submitting data, each district has the ability to run PID Discrepancy Reports that show any PID errors and correct those errors before its submission is finalized. The PID error rate has declined significantly over the years, but any error has a detrimental effect on the calculation of longitudinal measures, such as the four-year dropout rate and the high school graduation rate. The TAPRs show the PID error rate in PEIMS Student Data collected in Submission 1 (October 2014). The rate is calculated as follows: number of student PID errors found in finalized PEIMS submission 1 (fall 2014) number of student records in finalized PEIMS submission 1 (fall 2014) (2) Percent of Underreported Students. Underreported students are 7 th 12 th graders who were enrolled at any time during the prior year, who are not accounted for through district records or TEA processing in the current year, and for whom the district did not submit a leaver record. A district is required to submit a leaver record for any student served in grades 7 12 the previous year unless the student received a GED certificate by August 31, is a previous Texas public school graduate, moved to and enrolled in another Texas public school district, or returned to the district by the end Texas Education Agency Assessment and Accountability Performance Reporting 9 of 28
28 TAPR Glossary November 2015 of the school start window. (For , the end of the school-start window was September 26, 2014.) (For a more complete definition of leavers, see Leaver Records.) The rate is calculated as follows: number of underreported students number of students in grades 7 12 who were served in the district in the school year Distinction Designations: Recognitions for districts and campuses for outstanding achievement in the following academic areas: Academic Achievement in English Language Arts/Reading (campus only) Academic Achievement in Mathematics (campus only) Academic Achievement in Science (campus only) Academic Achievement in Social Studies (campus only) Top 25 Percent: Student Progress (campus only) Top 25 Percent: Closing Performance Gaps (campus only) Postsecondary Readiness (district and campus) Only those districts and campuses that receive a Met Standard rating are eligible for distinction designations. Charter districts and alternative education campuses evaluated by alternative education accountability (AEA) provisions are not eligible for distinction designations. See Chapter 5 in the 2015 Accountability Manual for more information. Distinguished Achievement Program: Please see RHSP/DAP Graduates. Dropout: A student who was enrolled in public school in grade 7 12 during the previous year, did not return to public school in current year, was not expelled, and did not graduate, receive a high school equivalency certificate, continue school outside the public school system, begin college, or die. Dropout counts are obtained from PEIMS records. For more information, see Annual Dropout Rate. (Source of data: PEIMS, Oct. 2014) Dropout Rate: Please see Annual Dropout Rate. Economically Disadvantaged: The count and percentage of students eligible for free or reduced-price lunch or eligible for other public assistance. number of students eligible for free or reduced-price lunch or other public assistance total number of students See also Total Students. (Source of data: PEIMS, Oct. 2014, Oct. 2013; and TEA Student Assessment Division) Texas Education Agency Assessment and Accountability Performance Reporting 10 of 28
29 TAPR Glossary November 2015 Educational Aides: The count and percentage of paraprofessional staff who are reported with a role of 033 (Educational Aide) or 036 (Certified Interpreter). The FTE counts of educational aides are expressed as a percentage of the total staff FTEs. See Appendix A for all PEIMS Role IDs. (Source of data: PEIMS, Oct. 2014) English Language Learners (ELLs): The count and percentage of students whose primary language is other than English and who are in the process of acquiring English. Inclusion and exclusion of ELL performance varies by indicator: ELL performance of students who are in their first year in U.S. schools is excluded from all STAAR indicators. Exclusion of other ELL performance varies, depending on the indicator. For detailed information on the inclusion and exclusion of ELL performance, see Appendix I in the 2015 Accountability Manual. ELL performance is included in all other non-staar indicators, regardless of years in U.S. schools. Not all students identified as ELLs receive bilingual or English as a second language instruction. In the Profile section of the reports, the percentage of ELLs is calculated by dividing the number of ELLs by the total number of students in the district or campus. (Source of data: PEIMS, Oct. 2014) Enrollment: Please see Total Students. Ethnic Distribution: The number and percentage of students and staff who are identified as belonging to one of the following groups: African American, Hispanic, White, American Indian, Asian, Pacific Islander, and Two or More Races. (Source of data: PEIMS, Oct. 2014, Oct. 2013; The College Board; ACT Inc.; The International Baccalaureate Organization; and TEA Student Assessment Division) Expenditure Information: Information available on the PEIMS Financial Standard Reports at FTE: Full-Time Equivalent. Fund Balance Information: Information is available on the PEIMS Financial Standard Reports at Graduates: The count and percentage of students who graduate at some time during the school year. It includes summer graduates and is reported by districts in the fall of the following school year. It includes all students in grade 12 who graduated, as well as graduates from other grades. Students served by special education who graduate are included in the totals. Counts of students graduating under the following graduation types in are also shown: Minimum High School Program Recommended High School Program Texas Education Agency Assessment and Accountability Performance Reporting 11 of 28
30 TAPR Glossary November 2015 Distinguished Achievement Program Foundation High School Plan See also College-Ready Graduates, Longitudinal Rate, and RHSP/DAP Graduates. (Source of data: PEIMS, Oct. 2014) Graduates Enrolled in Texas Institution of Higher Education: The percentage of students who enroll and begin instruction at an institution of higher education in Texas for the school year following high school graduation. The rate is determined as follows: number of graduates during the school year who attended a public or independent college or university in Texas in the academic year number of graduates during the school year Students not Included: Students who enrolled in any non-public career schools or out-ofstate colleges or universities Students Included: Students who attend public community colleges in Texas (Source of data: Texas Higher Education Coordinating Board) Graduates in TX IHE Completing One Year Without Remediation: The percentage of students who enrolled and began instruction at an institution of higher education in Texas for the school year following high school graduation and who did not require a developmental education course, based on meeting the Texas Success Initiative. Texas Success Initiative requirements apply only to students attending Texas public institutions. The rate is determined as follows: number of graduates during the school year who enrolled in a public college or university in Texas for the school year following the year they graduated and met the Texas Success Initiative requirement in all subject areas (reading, writing, and mathematics) number of graduates during the school year who enrolled in a public college or university in Texas for the school year following the year they graduated Students Not Included: Students who enrolled in independent colleges or universities in Texas, out-of-state colleges or universities, or any non-public career school Students Included: Students who attended Texas public two- or four-year institutions of higher education. Additional reports showing students enrolled in Texas public colleges and universities are available on the THECB site at For more information on the data used in this indicator, contact the Texas Higher Education Coordinating Board at (512) (Source of data: Texas Higher Education Coordinating Board, Fall 2015) Graduation Rate: Please see Longitudinal Rates. Texas Education Agency Assessment and Accountability Performance Reporting 12 of 28
31 TAPR Glossary November 2015 Instructional Expenditure Ratio ( ): This information is available on the PEIMS Financial Standard Reports at Instructional Staff Percent (District Profile only): The percentage of the district's FTEs whose job function was to provide classroom instruction directly to students during the school year. The instructional staff percent is a district-level measure and is calculated as follows: total number of hours for district staff who were reported under expenditure object codes 6112, 6119, and 6129, and function codes 11, 12, 13, and 31 total number of hours worked by all district employees Contact the Division of Financial Compliance at (512) for further details about this measure. (Source of data: PEIMS, Oct. 2014) International Baccalaureate (IB): See AP/IB Results. Leaver Record: The PEIMS record that reports the status of prior year grade 7 12 students who are no longer enrolled at a Texas public school. Districts are required to submit a leaver record for each student who graduated, enrolled in school in another state, returned to his or her home country, died, or dropped out. This information is sent to TEA in Submission 1 of the annual PEIMS data collection. See Data Quality. (Source of data: PEIMS, Oct. 2014; Secondary School Completion and Dropouts in Texas Public Schools, , Texas Education Agency) LEP (Limited English Proficient): Please see English Language Learner. Longitudinal Rates: The status of a group (cohort) of students after four years in high school (4-Year Longitudinal Rate), after five years in high school (5-Year Extended Longitudinal Rate), or after six years in high school (6-Year Extended Longitudinal Rate). For the 4-Year Longitudinal Rate, the cohort consists of students who first attended ninth grade in They are followed through their expected graduation with the class of For the 5-Year Extended Longitudinal Rate, the cohort consists of students who first attended ninth grade in They are followed for five years and included if they graduated within a year after their expected graduation with the class of For the 6-Year Extended Longitudinal Rate, the cohort consists of students who first attended ninth grade in They are followed for six years, and included if they graduated within two years after their expected graduation with the class of Additional Information on Cohorts: A student transfers into a campus, district, or state cohort when he or she moves into the cohort from another high school in Texas, from another district in Texas, or from out of state. Texas Education Agency Assessment and Accountability Performance Reporting 13 of 28
32 TAPR Glossary November 2015 A student transfers out of a campus or district cohort when he or she moves to another public high school in Texas or moves to another district in Texas. Note that these students are transferred into the cohort of the receiving high school or district. There are also students who move out of state or out of the country and students who transfer to private schools or who are home-schooled. These types of transfer students cannot be tracked and are not included in longitudinal rate calculations. A student does not change cohorts if he or she repeats or skips a grade. A student who begins with the ninth-grade cohort remains with that cohort. A student who started the ninth grade in but takes 5 years to graduate (i.e., graduates in May 2015) is still part of the 2014 cohort; he or she is not switched to the 2015 cohort. This student would be considered a continuing student and counted as part of the Continued HS number for the class of This is true as well for the five-year and six-year extended longitudinal cohorts. There are four student outcomes used in computing each longitudinal rate: 4-Year Longitudinal Rate (1) Graduated: The percentage who received their high school diploma on time (in four years) or earlier by August 31, 2014 for the cohort. It is calculated as follows: number of students from the cohort who received a high school diploma by August 31, 2014 number of students in the cohort* (2) Received GED: For the cohort, the percentage who received a General Educational Development (GED) certificate by August 31, It is calculated as follows: number of students from the cohort who received a GED by August 31, 2014 number of students in the cohort* (3) Continued High School: The percent of the cohort still enrolled as students in the fall of the school year. It is calculated as follows: number of students from the cohort who were enrolled in the fall of the school year number of students in the cohort* (4) Dropped Out: The percent of the cohort who dropped out and did not return by the fall of the school year. It is calculated as follows: number of students from the cohort who dropped out before fall of the school year number of students in the cohort* Texas Education Agency Assessment and Accountability Performance Reporting 14 of 28
PEIMS Submission 1 list
 Campus PEIMS Preparation FALL 2014-2015 D E P A R T M E N T O F T E C H N O L O G Y ( D O T ) - P E I M S D I V I S I O N PEIMS Submission 1 list The information on this page provides instructions for
DATE ISSUED: 11/2/ of 12 UPDATE 103 EHBE(LEGAL)-P
-P") TITLE III REQUIREMENTS STATE POLICY DEFINITIONS DISTRICT RESPONSIBILITY IDENTIFICATION OF LEP STUDENTS A district that receives funds under Title III of the No Child Left Behind Act shall comply with the
TITLE III REQUIREMENTS STATE POLICY DEFINITIONS DISTRICT RESPONSIBILITY IDENTIFICATION OF LEP STUDENTS A district that receives funds under Title III of the No Child Left Behind Act shall comply with the
Data Diskette & CD ROM
 Data File Format Data Diskette & CD ROM Texas Assessment of Academic Skills Fall 2002 through Summer 2003 Exit Level Test Administrations Attention Macintosh Users To accommodate Macintosh systems a delimiter
ILLINOIS DISTRICT REPORT CARD
 -6-525-2- HAZEL CREST SD 52-5 HAZEL CREST SD 52-5 HAZEL CREST, ILLINOIS and federal laws require public school districts to release report cards to the public each year. 2 7 ILLINOIS DISTRICT REPORT CARD
Miami-Dade County Public Schools
 ENGLISH LANGUAGE LEARNERS AND THEIR ACADEMIC PROGRESS: 2010-2011 Author: Aleksandr Shneyderman, Ed.D. January 2012 Research Services Office of Assessment, Research, and Data Analysis 1450 NE Second Avenue,
ILLINOIS DISTRICT REPORT CARD
 -6-525-2- Hazel Crest SD 52-5 Hazel Crest SD 52-5 Hazel Crest, ILLINOIS 2 8 ILLINOIS DISTRICT REPORT CARD and federal laws require public school districts to release report cards to the public each year.
FTE General Instructions
 Florida Department of Education Bureau of PK-20 Education Data Warehouse and Office of Funding and Financial Reporting FTE General Instructions 2017-18 Questions and comments regarding this publication
Evaluation of Teach For America:
 EA15-536-2 Evaluation of Teach For America: 2014-2015 Department of Evaluation and Assessment Mike Miles Superintendent of Schools This page is intentionally left blank. ii Evaluation of Teach For America:
A Guide to Adequate Yearly Progress Analyses in Nevada 2007 Nevada Department of Education
 A Guide to Adequate Yearly Progress Analyses in Nevada 2007 Nevada Department of Education Note: Additional information regarding AYP Results from 2003 through 2007 including a listing of each individual
Kansas Adequate Yearly Progress (AYP) Revised Guidance
 Revised Guidance") Kansas State Department of Education Kansas Adequate Yearly Progress (AYP) Revised Guidance Based on Elementary & Secondary Education Act, No Child Left Behind (P.L. 107-110) Revised May 2010 Revised May
Kansas State Department of Education Kansas Adequate Yearly Progress (AYP) Revised Guidance Based on Elementary & Secondary Education Act, No Child Left Behind (P.L. 107-110) Revised May 2010 Revised May
Katy Independent School District Paetow High School Campus Improvement Plan
 Katy Independent School District 2017-2018 Campus Improvement Plan Generated by Plan4Learningcom 1 of 15 Table of Contents Comprehensive Needs Assessment 3 Demographics 3 Student Academic Achievement 4
Moving the Needle: Creating Better Career Opportunities and Workforce Readiness. Austin ISD Progress Report
 Moving the Needle: Creating Better Career Opportunities and Workforce Readiness Austin ISD Progress Report 2013 A Letter to the Community Central Texas Job Openings More than 150 people move to the Austin
Shelters Elementary School
 Shelters Elementary School August 2, 24 Dear Parents and Community Members: We are pleased to present you with the (AER) which provides key information on the 23-24 educational progress for the Shelters
Financing Education In Minnesota
 Financing Education In Minnesota 2016-2017 Created with Tagul.com A Publication of the Minnesota House of Representatives Fiscal Analysis Department August 2016 Financing Education in Minnesota 2016-17
Cooper Upper Elementary School
 LIVONIA PUBLIC SCHOOLS http://cooper.livoniapublicschools.org 215-216 Annual Education Report BOARD OF EDUCATION 215-16 Colleen Burton, President Dianne Laura, Vice President Tammy Bonifield, Secretary
Cooper Upper Elementary School
 LIVONIA PUBLIC SCHOOLS www.livoniapublicschools.org/cooper 213-214 BOARD OF EDUCATION 213-14 Mark Johnson, President Colleen Burton, Vice President Dianne Laura, Secretary Tammy Bonifield, Trustee Dan
Description of Program Report Codes Used in Expenditure of State Funds
 Program Report Codes (PRC) A program report code (PRC) is an accounting term and is used for the allocation and accounting of funds. The PRCs (allocations) may change from year to year depending on the
An Introduction to School Finance in Texas
 An Introduction to School Finance in Texas May 12, 2010 Sheryl Pace TTARA Research Foundation space@ttara.org (512) 472-8838 Texas Public Education System 1,300 school districts (#1 in the nation) 1,025
College and Career Ready Performance Index, High School, Grades 9-12
 Dr. John D. Barge, State School Superintendent Making Education Work for All of Georgia s Students College and Career Ready Performance Index, High School, Grades 9-12 CONTENT MASTERY (END of COURSE TESTS
Massachusetts Department of Elementary and Secondary Education. Title I Comparability
 Massachusetts Department of Elementary and Secondary Education Title I Comparability 2009-2010 Title I provides federal financial assistance to school districts to provide supplemental educational services
Data Glossary. Summa Cum Laude: the top 2% of each college's distribution of cumulative GPAs for the graduating cohort. Academic Honors (Latin Honors)
") Institutional Research and Assessment Data Glossary This document is a collection of terms and variable definitions commonly used in the universities reports. The definitions were compiled from various
Institutional Research and Assessment Data Glossary This document is a collection of terms and variable definitions commonly used in the universities reports. The definitions were compiled from various
Conroe Independent School District
 Conroe Independent School District A REVIEW OF THE STUDENT BEHAVIOR MANAGEMENT SYSTEM Conducted by MGT of America, Inc. for the Legislative Budget Board January 2011 CONROE INDEPENDENT SCHOOL DISTRICT
Best Colleges Main Survey
 Best Colleges Main Survey Date submitted 5/12/216 18::56 Introduction page 1 / 146 BEST COLLEGES Data Collection U.S. News has begun collecting data for the 217 edition of Best Colleges. The U.S. News
Campus Improvement Plan Elementary/Intermediate Campus: Deretchin Elementary Rating: Met Standard
 Campus Improvement Plan 2015-2016 Elementary/Intermediate Campus: Deretchin Elementary Rating: Met Standard Goal 1: Student Achievement and Post-Secondary Success Deretchin Elementary School will maintain
Katy Independent School District Davidson Elementary Campus Improvement Plan
 Katy Independent School District 2017-2018 Campus Improvement Plan Accountability Rating: Met Standard Generated by Plan4Learningcom 1 of 26 Mission Statement Together with our community, the Davidson
Student Mobility Rates in Massachusetts Public Schools
 Student Mobility Rates in Massachusetts Public Schools Introduction The Massachusetts Department of Elementary and Secondary Education (ESE) calculates and reports mobility rates as part of its overall
ADMISSION TO THE UNIVERSITY
 ADMISSION TO THE UNIVERSITY William Carter, Director of Admission College Hall 140. MSC 128. Extension 2315. Texas A&M University-Kingsville adheres to high standards of academic excellence and admits
Iowa School District Profiles. Le Mars
 Iowa School District Profiles Overview This profile describes enrollment trends, student performance, income levels, population, and other characteristics of the public school district. The report utilizes
John F. Kennedy Middle School
 John F. Kennedy Middle School CUPERTINO UNION SCHOOL DISTRICT Steven Hamm, Principal hamm_steven@cusdk8.org School Address: 821 Bubb Rd. Cupertino, CA 95014-4938 (408) 253-1525 CDS Code: 43-69419-6046890
FLORIDA. -Mindingall. Portilla Dr. Wilbert. endent of School. Superinte. Associate Curriculum. Assistant
 Miami-Dade County Public Schools Curriculum Bulletin 2012-2013 THE SCHOOL BOARD OF MIAMI-D DADE COUNTY, FLORIDA Ms. Perla Tabares Hantman, Chair Dr. Lawrence S. Feldman, Vice Chair Dr. Dorothy Bendross-
African American Male Achievement Update
 Report from the Department of Research, Evaluation, and Assessment Number 8 January 16, 2009 African American Male Achievement Update AUTHOR: Hope E. White, Ph.D., Program Evaluation Specialist Department
PEIMS Submission 3 list
 Campus PEIMS Preparation SPRING 2014-2015 D E P A R T M E N T O F T E C H N O L O G Y ( D O T ) - P E I M S D I V I S I O N PEIMS Submission 3 list The information on this page provides instructions for
Executive Summary. Laurel County School District. Dr. Doug Bennett, Superintendent 718 N Main St London, KY
 Dr. Doug Bennett, Superintendent 718 N Main St London, KY 40741-1222 Document Generated On January 13, 2014 TABLE OF CONTENTS Introduction 1 Description of the School System 2 System's Purpose 4 Notable
State Parental Involvement Plan
 A Toolkit for Title I Parental Involvement Section 3 Tools Page 41 Tool 3.1: State Parental Involvement Plan Description This tool serves as an example of one SEA s plan for supporting LEAs and schools
Massachusetts Juvenile Justice Education Case Study Results
 Massachusetts Juvenile Justice Education Case Study Results Principal Investigator: Thomas G. Blomberg Dean and Sheldon L. Messinger Professor of Criminology and Criminal Justice Prepared by: George Pesta
Personnel Administrators. Alexis Schauss. Director of School Business NC Department of Public Instruction
 Personnel Administrators Alexis Schauss Director of School Business NC Department of Public Instruction Delivering Bad News in a Good Way Planning Allotments are NOT Allotments Budget tool New Allotted
Alvin Elementary Campus Improvement Plan
 Goal 1: Student academic performance on state and national exams will reflect continuous improvement and excellence in learning. 1.1 Maintain 90% or higher of students in grades 3 through 5 passing the
Hitchcock Independent School District. District Improvement Plan
 Hitchcock Independent School District District Improvement Plan 2015-2016 Review Dates: September 21, 2015 _November 16, 2016 Page 1 of 20 Texas Public Education Mission Statement The mission of the public
READY OR NOT? CALIFORNIA'S EARLY ASSESSMENT PROGRAM AND THE TRANSITION TO COLLEGE
 READY OR NOT? CALIFORNIA'S EARLY ASSESSMENT PROGRAM AND THE TRANSITION TO COLLEGE Michal Kurlaender University of California, Davis Policy Analysis for California Education March 16, 2012 This research
Coming in. Coming in. Coming in
 212-213 Report Card for Glenville High School SCHOOL DISTRICT District results under review by the Ohio Department of Education based upon 211 findings by the Auditor of State. Achievement This grade combines
Longitudinal Analysis of the Effectiveness of DCPS Teachers
 F I N A L R E P O R T Longitudinal Analysis of the Effectiveness of DCPS Teachers July 8, 2014 Elias Walsh Dallas Dotter Submitted to: DC Education Consortium for Research and Evaluation School of Education
Hokulani Elementary School
 Hokulani Elementary Code: 109 Status and Improvement Report Year -11 Contents Focus On Standards Grades K-5 This Status and Improvement Report has been prepared as part of the Department's education accountability
EDUCATIONAL ATTAINMENT
 EDUCATIONAL ATTAINMENT By 2030, at least 60 percent of Texans ages 25 to 34 will have a postsecondary credential or degree. Target: Increase the percent of Texans ages 25 to 34 with a postsecondary credential.
2012 ACT RESULTS BACKGROUND
 Report from the Office of Student Assessment 31 November 29, 2012 2012 ACT RESULTS AUTHOR: Douglas G. Wren, Ed.D., Assessment Specialist Department of Educational Leadership and Assessment OTHER CONTACT
Bethune-Cookman University
 Bethune-Cookman University The Independent Colleges and Universities of Florida Community College Articulation Manual 2012-2013 1 BETHUNE-COOKMAN UNIVERSITY ICUF ARTICULATION MANUAL GENERAL ADMISSION PROCEDURES
Kahului Elementary School
 Kahului Elementary Code: 405 Status and Improvement Report Year 2014-15 Focus On Standards Grades K-5 Focus on Standards Description Contents Setting Student Profile Community Profile Improvement Summary
Undergraduate Admissions Standards for the Massachusetts State University System and the University of Massachusetts. Reference Guide April 2016
 Undergraduate Admissions Standards for the Massachusetts State University System and the University of Massachusetts Reference Guide April 2016 Massachusetts Department of Higher Education One Ashburton
Summary of Special Provisions & Money Report Conference Budget July 30, 2014 Updated July 31, 2014
 6.4 (b) Base Budget This changes how average daily membership is built in the Budget. Until now, projected ADM increases have been included in the continuation budget. This special provision defines what
COURSE CATALOG & EDUCATIONAL PLANNING GUIDE SAN ANGELO INDEPENDENT SCHOOL DISTRICT LAKE VIEW HIGH SCHOOL CENTRAL HIGH SCHOOL
 SAN ANGELO INDEPENDENT SCHOOL DISTRICT LAKE VIEW HIGH SCHOOL CENTRAL FRESHMAN CAMPUS CENTRAL HIGH SCHOOL 2015-2016 COURSE CATALOG & EDUCATIONAL PLANNING GUIDE SAISD San Angelo Independent School District
INDEPENDENT STUDY PROGRAM
 INSTRUCTION BOARD POLICY BP6158 INDEPENDENT STUDY PROGRAM The Governing Board authorizes independent study as a voluntary alternative instructional setting by which students may reach curricular objectives
Pathways to College Preparatory Advanced Academic Offerings in the Anchorage School District
 Pathways to College Preparatory Advanced Academic Offerings in the Anchorage School District Prepared by: Rosyland Frazier Diane Hirshberg Prepared for: CITC s Anchorage Realizing Indigenous Student Excellence
Gifted & Talented. Dyslexia. Special Education. Updates. March 2015!
 Gifted & Talented Dyslexia Special Education Updates Gifted & Talented Where Are We Now? Program of Services! Identification! Professional Development! Communication! GT Update Percent of Students in RISD
64% :Trenton High School. School Grade A; AYP-No. *FCAT Level 3 and Above: Reading-80%; Math-
 I. Current School Status: A. School Information: 1. School-Level Information: a. School: Trenton High School b. Principal's name: Cheri Langford c. School Advisory Council chair's name: Heather Rucker
West Haven School District English Language Learners Program
 West Haven School District English Language Learners Program 2016 W E S T H A V E N S C H O O L S Hello CIAO NÍN HǍO MERHABA ALLÔ CHÀO DZIEN DOBRY SALAAM Hola Dear Staff, Our combined community of bilingual
UPPER ARLINGTON SCHOOLS
 UPPER ARLINGTON SCHOOLS SERVE LEAD SUCCEED CHALLENGE AND SUPPORT EVERY STUDENT, EVERY STEP OF THE WAY. 2014-2015 www.uaschools.org 1950 North Mallway Drive Upper Arlington, Ohio 43221 (614) 487-5000 Introduction
Frank Phillips College. Accountability Report
 Frank Phillips College Accountability Report January 2016 Accountability System, January 2016 1 of 22 Participation - Key Measures Enrollment 1. Fall Headcount (Unduplicated) Fall 2000 Fall 2014 Fall 2015
National Longitudinal Study of Adolescent Health. Wave III Education Data
 National Longitudinal Study of Adolescent Health Wave III Education Data Primary Codebook Chandra Muller, Jennifer Pearson, Catherine Riegle-Crumb, Jennifer Harris Requejo, Kenneth A. Frank, Kathryn S.
CONTINUUM OF SPECIAL EDUCATION SERVICES FOR SCHOOL AGE STUDENTS
 CONTINUUM OF SPECIAL EDUCATION SERVICES FOR SCHOOL AGE STUDENTS No. 18 (replaces IB 2008-21) April 2012 In 2008, the State Education Department (SED) issued a guidance document to the field regarding the
Appendix K: Survey Instrument
 Journal of Southeast Asian American Education and Advancement Volume Article 12 2011 Appendix K: Survey Instrument Wayne E. Wright University of Texas, San Antonio, wewright@purdue.edu Sovicheth Boun The
Samuel Enoka Kalama Intermediate School
 Code: 420 Samuel Enoka Kalama Intermediate Status and Improvement Report Year 2014-15 Focus On Standards Grades 6-8 Contents This Status and Improvement Report has been prepared as part of the Department's
Frequently Asked Questions and Answers
 Definition and Responsibilities 1. What is home education? Frequently Asked Questions and Answers Section 1002.01, F.S., defines home education as the sequentially progressive instruction of a student
NATIONAL CENTER FOR EDUCATION STATISTICS
 NATIONAL CENTER FOR EDUCATION STATISTICS The Integrated Postsecondary Education Data System (IPEDS) is the core postsecondary education data collection program for the NCES. It is a single, comprehensive
PEDAGOGY AND PROFESSIONAL RESPONSIBILITIES STANDARDS (EC-GRADE 12)
") PEDAGOGY AND PROFESSIONAL RESPONSIBILITIES STANDARDS (EC-GRADE 12) Standard I.* Standard II.* Standard III.* Standard IV. The teacher designs instruction appropriate for all students that reflects an understanding
PEDAGOGY AND PROFESSIONAL RESPONSIBILITIES STANDARDS (EC-GRADE 12) Standard I.* Standard II.* Standard III.* Standard IV. The teacher designs instruction appropriate for all students that reflects an understanding
Student Support Services Evaluation Readiness Report. By Mandalyn R. Swanson, Ph.D., Program Evaluation Specialist. and Evaluation
 Student Support Services Evaluation Readiness Report By Mandalyn R. Swanson, Ph.D., Program Evaluation Specialist and Bethany L. McCaffrey, Ph.D., Interim Director of Research and Evaluation Evaluation
NDPC-SD Data Probes Worksheet
 NDPC-SD Data Probes Worksheet This worksheet from the National Dropout Prevention Center for Students with Disabilities (NDPC- SD) is an optional tool to help schools organize multiple years of student
Sunnyvale Middle School School Accountability Report Card Reported Using Data from the School Year Published During
 Sunnyvale Middle School School Accountability Report Card Reported Using Data from the 2014-15 School Year Published During 2015-16 By February 1 of each year, every school in California is required by
CONNECTICUT GUIDELINES FOR EDUCATOR EVALUATION. Connecticut State Department of Education
 CONNECTICUT GUIDELINES FOR EDUCATOR EVALUATION Connecticut State Department of Education October 2017 Preface Connecticut s educators are committed to ensuring that students develop the skills and acquire
TABLE OF CONTENTS. By-Law 1: The Faculty Council...3
 FACULTY OF SOCIAL SCIENCES, University of Ottawa Faculty By-Laws (November 21, 2017) TABLE OF CONTENTS By-Law 1: The Faculty Council....3 1.1 Mandate... 3 1.2 Members... 3 1.3 Procedures for electing Faculty
https://secure.aacte.org/apps/peds/print_all_forms.php?view=report&prin...
 1 of 35 4/25/2012 9:56 AM A» 2011 PEDS» Institutional Data inst id: 3510 Institutional Data A_1 Institutional Information This information will be used in all official references to your institution. Institution
Bellevue University Bellevue, NE
 C O L L E G E P R O F I L E - O V E R V I E W Bellevue University Bellevue, NE Bellevue, founded in 1966, is a private university. Its campus is located in Bellevue, in the Omaha metropolitan area. Web
Exams: Accommodations Guidelines. English Language Learners
 PSSA Accommodations Guidelines for English Language Learners (ELLs) [Arlen: Please format this page like the cover page for the PSSA Accommodations Guidelines for Students PSSA with IEPs and Students with
Bureau of Teaching and Learning Support Division of School District Planning and Continuous Improvement GETTING RESULTS
 PENNSYLVANIA DEPARTMENT OF EDUCATION A Framework for Continuous School Improvement Planning (Summer 2009) GETTING RESULTS Continuous School Improvement Plan Gen 6-2 Year Plan Required for Schools in School
EXECUTIVE SUMMARY. Online courses for credit recovery in high schools: Effectiveness and promising practices. April 2017
 EXECUTIVE SUMMARY Online courses for credit recovery in high schools: Effectiveness and promising practices April 2017 Prepared for the Nellie Mae Education Foundation by the UMass Donahue Institute 1
Orange Elementary School FY15 Budget Overview. Tari N. Thomas Superintendent of Schools
 + Orange Elementary School FY15 Budget Overview Tari N. Thomas Superintendent of Schools + The Key Metrics of the Organization: Orange Elementary Enrollment 661 Attendance 94% Average Class Size 22 Student
File Print Created 11/17/2017 6:16 PM 1 of 10
 Success - Key Measures Graduation Rate: 4-, 5-, and 6-Year 9. First-time, full-time entering, degree-seeking, students enrolled in a minimum of 12 SCH their first fall semester who have graduated from
3.7 General Education Homebound (GEH) Program
 Program") 3.7 General Education Homebound (GEH) Program Any student who is served through the GEH program must meet the following three criteria: The student is expected to be confined at home or hospital bedside
3.7 General Education Homebound (GEH) Program Any student who is served through the GEH program must meet the following three criteria: The student is expected to be confined at home or hospital bedside
RECRUITMENT AND EXAMINATIONS
 CHAPTER V: RECRUITMENT AND EXAMINATIONS RULE 5.1 RECRUITMENT Section 5.1.1 Announcement of Examinations RULE 5.2 EXAMINATION Section 5.2.1 Determination of Examinations 5.2.2 Open Competitive Examinations
Freshman Admission Application 2016
 We are pleased that you have requested application materials from Governors State University. We recommend that you review all program requirements carefully. Major requirements may vary. Please review
GENERAL UNIVERSITY POLICY APM REGARDING ACADEMIC APPOINTEES Limitation on Total Period of Service with Certain Academic Titles
 Important Introductory Note Please read this note before consulting APM - 133-0. I. For determining years toward the eight-year limitation of service with certain academic titles, see APM - 133-0 printed
State Budget Update February 2016
 State Budget Update February 2016 2016-17 BUDGET TRAILER BILL SUMMARY The Budget Trailer Bill Language is the implementing statute needed to effectuate the proposals in the annual Budget Bill. The Governor
NATIONAL CENTER FOR EDUCATION STATISTICS
 NATIONAL CENTER FOR EDUCATION STATISTICS Palm Desert, CA The Integrated Postsecondary Education Data System (IPEDS) is the nation s core postsecondary education data collection program. It is a single,
Table of Contents Welcome to the Federal Work Study (FWS)/Community Service/America Reads program.
/Community Service/America Reads program.") Table of Contents Welcome........................................ 1 Basic Requirements for the Federal Work Study (FWS)/ Community Service/America Reads program............ 2 Responsibilities of All Participants
Table of Contents Welcome........................................ 1 Basic Requirements for the Federal Work Study (FWS)/ Community Service/America Reads program............ 2 Responsibilities of All Participants
Educational Quality Assurance Standards. Residential Juvenile Justice Commitment Programs DRAFT
 Educational Quality Assurance Standards Residential Juvenile Justice Commitment Programs 2009 2010 Bureau of Exceptional Education and Student Services Division of K-12 Public Schools Florida Department
NCEO Technical Report 27
 Home About Publications Special Topics Presentations State Policies Accommodations Bibliography Teleconferences Tools Related Sites Interpreting Trends in the Performance of Special Education Students
Lakewood Board of Education 200 Ramsey Avenue, Lakewood, NJ 08701
 March 20, 2017 Judee DeStefano-Anen Interim Executive County Superintendent 212 Washington Street Toms River, NJ 08753 Dear Dr. DeStefano-Anen: It is with great sadness that I must inform you that the
Lincoln School Kathmandu, Nepal
 ISS Administrative Searches is pleased to announce Lincoln School Kathmandu, Nepal Seeks Elementary Principal Application Deadline: October 30, 2017 Visit the ISS Administrative Searches webpage to view
Montana's Distance Learning Policy for Adult Basic and Literacy Education
 Montana's Distance Learning Policy for Adult Basic and Literacy Education 2013-2014 1 Table of Contents I. Introduction Page 3 A. The Need B. Going to Scale II. Definitions and Requirements... Page 4-5
AGENDA ITEM VI-E October 2005 Page 1 CHAPTER 13. FINANCIAL PLANNING
 Page 1 CHAPTER 13. FINANCIAL PLANNING Subchapter F. FORMULA FUNDING AND TUITION CHARGED FOR REPEATED AND EXCESS HOURS OF UNDERGRADUATE STUDENTS Section 13.100. Purpose. 13.101. Authority 13.102. Definitions.
Colorado s Unified Improvement Plan for Schools for Online UIP Report
 Colorado s Unified Improvement Plan for Schools for 2015-16 Online UIP Report Organization Code: 2690 District Name: PUEBLO CITY 60 Official 2014 SPF: 1-Year Executive Summary How are students performing?
INTRODUCTION ( MCPS HS Course Bulletin)
") INTRODUCTION (2012-2013 MCPS HS Course Bulletin) MARYLAND DIPLOMA REQUIREMENTS The state of Maryland authorizes one diploma for all high school graduates, based upon successful fulfillment of four categories
INTRODUCTION (2012-2013 MCPS HS Course Bulletin) MARYLAND DIPLOMA REQUIREMENTS The state of Maryland authorizes one diploma for all high school graduates, based upon successful fulfillment of four categories
LIM College New York, NY
 C O L L E G E P R O F I L E - O V E R V I E W LIM College New York, NY The Laboratory Institute of Merchandising, founded in 1939, is a private institute. Its facilities are located in Manhattan. Web Site
Standardized Assessment & Data Overview December 21, 2015
 Standardized Assessment & Data Overview December 21, 2015 Peters Township School District, as a public school entity, will enable students to realize their potential to learn, live, lead and succeed. 2
Office Hours: Day Time Location TR 12:00pm - 2:00pm Main Campus Carl DeSantis Building 5136
 FIN 3110 - Financial Management I. Course Information Course: FIN 3110 - Financial Management Semester Credit Hours: 3.0 Course CRN and Section: 20812 - NW1 Semester and Year: Fall 2017 Course Start and
Northwest-Shoals Community College - Personnel Handbook/Policy Manual 1-1. Personnel Handbook/Policy Manual I. INTRODUCTION
 Northwest-Shoals Community College - Personnel Handbook/Policy Manual 1-1 Personnel Handbook/Policy Manual I. INTRODUCTION Northwest-Shoals Community College - Personnel Handbook/Policy Manual 1-2 I. INTRODUCTION
University of Maine at Augusta Augusta, ME
 C O L L E G E P R O F I L E - O V E R V I E W University of Maine at Augusta Augusta, ME U Maine at Augusta, founded in 1965, is a public university. Its 165-acre campus is located in Augusta, 50 miles
GRADUATE STUDENTS Academic Year
 Financial Aid Information for GRADUATE STUDENTS Academic Year 2017-2018 Your Financial Aid Award This booklet is designed to help you understand your financial aid award, policies for receiving aid and
Strategic Plan Dashboard Results. Office of Institutional Research and Assessment
 29-21 Strategic Plan Dashboard Results Office of Institutional Research and Assessment Binghamton University Office of Institutional Research and Assessment Definitions Fall Undergraduate and Graduate
Clark Lane Middle School
 152-51 STRATEGIC SCHOOL PROFILE 2010-11 Middle and Junior High School Edition Clark Lane Middle School Waterford School District MICHAEL LOVETERE, Principal LYNN M. LYNCH, Asst. Principal Telephone: (860)
Georgia Department of Education
 Georgia Department of Education Early Intervention Program (EIP) Guidance 2014-2015 School Year The Rubrics are required for school districts to use along with other supporting documents in making placement
1. Amend Article Departmental co-ordination and program committee as set out in Appendix A.
 WORKLOAD RESOURCES 1. Amend Article 4.1.00 Departmental co-ordination and program committee as set out in Appendix A. 2. Amend Article 8.4.00 Teaching Load as set out in Appendix B. 3. Add teaching resources