Student Achievement WTPS Mrs. Cheryl Dyer, Superintendent Dr. Lisa Gleason, Director of Curriculum and Instruction 1
|
|
|
- Marcus Townsend
- 5 years ago
- Views:
Transcription

1 Student Achievement WTPS Mrs. Cheryl Dyer, Superintendent Dr. Lisa Gleason, Director of Curriculum and Instruction 1
 Results No reportable Science data due to NJSLA - Science Field Test")
2 Topics Covered Proposed Changes for Statewide Assessments PARCC Results SAT and ACT Results Advanced Placement (AP) Results No reportable Science data due to NJSLA - Science Field Test 2
3 Proposed Changes to Statewide Assessments and High School Graduation Requirements (N.J.A.C. 6A:8) Current Regulations Proposed Amendments Take all associated PARCC assessments for: ELA 9, 10, 11 Alg. I, Geometry, Algebra II Take and pass: ELA 10 Algebra I Class of 2021 (current sophomores) Only alternative graduation option is Portfolio Appeals Process Class of 2020 (current juniors) Students must take all applicable assessments before availing themselves of the menu of alternate options Take associated PARCC assessments for: ELA 9 and 10 End of course math in 9th and 10th (Alg 1 and Geometry OR Geometry and Algebra II) Take and pass: ELA 10 Algebra I Maintain the menu of graduation assessment options afforded to the class of 2020, including: ACT, SAT, ASFAB, PSAT, and ACCUPLACER Portfolio Appeals Process 3
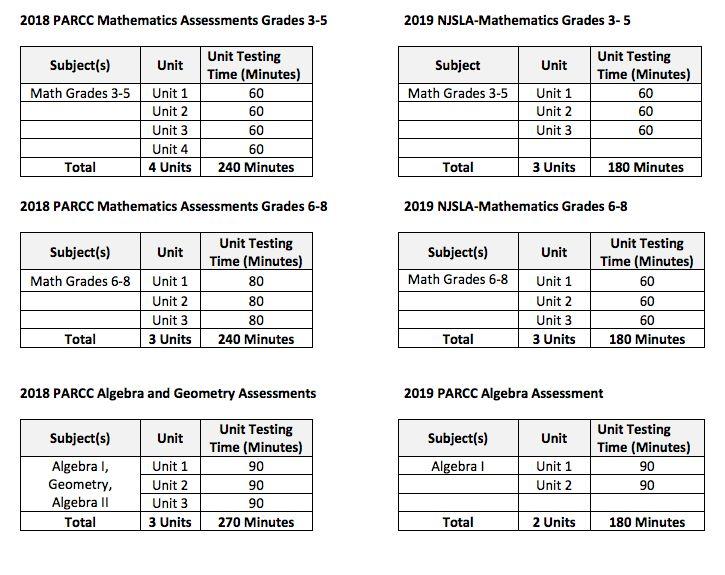
4 Immediate Changes for Spring 2019 Reduced Testing Times 4
5 5
6 PARCC Results English Language Arts Mathematics Grades
7 PARCC Performance Descriptors 1: Not yet meeting grade-level expectations for NJSLS 2: Partially meeting grade-level expectations for NJSLS 3: Approaching grade-level expectations for NJSLS 4: Meeting grade-level expectations for NJSLS 5: Exceeding grade-level expectations for NJSLS 7

8 English Language Arts 8
9 3rd Grade English Language Arts # of valid scores Average Scale Score One Two Three Four Five Four and Five comb. State 98, % 14% 21% 44% 8% 52% District % 12% 15% 57% 11% 68% District % 10% 18% 57% 13% 70% AW % 13% 14% 48% 20% 68% CS % 5% 21% 60% 12% 72% OM % 17% 11% 59% 5% 64% WB % 17% 14% 55% 10% 65% 16% increase over state average. All schools exceeded state average more than 10%. 2% decrease in overall passing from 2017 to 2018 in this grade level. 9
10 3rd Grade English Language Arts - Disaggregated Data # of valid scores Average Scale Score One Two Three Four Five Four and Five comb. State 98, % 13.5% 21.4% 43.5% 4.8% 51.7% District % 12.1% 15.1% 56.5% 11.3% 67.8% Female % 10.6% 8.9% 61.0% 16.3% 77.2% Male % 13.8% 21.6% 51.7% 6.0% 57.8% Hispanic < 20 Asian < 10 Black < 10 White % 10.9% 14.7% 57.3% 12.8% 70.1% 2 or more races <10 ED-Yes % 33.3% 26.7% 26.7% 3.3% 30.0% SE-Yes % 32.4% 17.6% 26.5% 0.0% 26.5% 504-Yes < 20 10
11 4th Grade English Language Arts # of valid scores Average Scale Score One Two Three Four Five Four and Five comb. State 99, % 12% 22% 39% 19% 58% District 2018 District % 8% 23% 44% 22% 66% % 9% 20% 50% 19% 69% AW % 4% 19% 37% 37% 74% CS % 8% 34% 45% 9% 54% OM % 9% 15% 41% 31% 72% WB % 9% 19% 56% 13% 68% 8% increase over state average. Three schools exceeded state average more than 10%. 3% decrease in overall passing from 2017 to 2018 in this grade level. 11
12 4th Grade English Language Arts - Disaggregated Data # of valid scores Average Scale Score One Two Three Four Five Four and Five comb. State 99, % 12.3% 22.1% 39.1% 18.9% 58.0% District % 7.6% 23.3% 43.8% 21.7% 65.5% Female % 6.3% 23.4% 43.2% 26.1% 69.4% Male % 8.7% 23.2% 44.2% 18.1% 62.3% Hispanic < 20 Asian < 10 Black < 10 White % 6.5% 22.9% 43.9% 23.4% 67.3% 2 or more races <10 ED-Yes % 22.2% 38.9% 27.8% 0.0% 27.8% SE-Yes % 26.1% 26.1% 21.7% 10.9% 32.6% 504-Yes <20 12
13 5th Grade English Language Arts # of valid scores Average Scale Score One Two Three Four Five Four and Five comb. State 101, % 13% 22% 47% 11% 58% District 2018 District % 8% 22% 54% 13% 67% % 4% 18% 66% 12% 78% AW % 10% 26% 53% 8% 61% CS % 5% 27% 55% 11% 66% OM % 11% 14% 55% 17% 72% WB % 7% 18% 50% 18% 68% 9% increase over state average. Two schools exceeded state average more than 10%. 11% decrease in overall passing from 2017 to 2018 in this grade level. 13
14 5th Grade English Language Arts - Disaggregated Data # of valid scores Average Scale Score One Two Three Four Five Four and Five comb. State 101, % 12.6% 22.4% 47.2% 10.8% 58.0% District % 8.4% 22.0% 53.7% 12.8% 66.5% Female % 3.9% 15.5% 57.3% 20.4% 77.7% Male % 12.1% 27.4% 50.8% 6.5% 57.3% Hispanic % 18.5% 7.4% 55.6% 11.1% 66.7% Asian < 10 Black < 10 White % 6.4% 25.1% 52.9% 12.8% 65.8% 2 or more races <10 ED-Yes % 23.3% 10.0% 46.7% 6.7% 53.3% SE-Yes % 23.1% 30.8% 36.5% 3.8% 40.4% 504-Yes < 20 14
15 Targeted Interventions 3rd - 5th Grade English Language Arts 15
16 Incorporate new digital formative assessment, Measuring Up, in grades 2-5 for diagnostic assessment, and progress monitoring Workshop model - teacher conferring in small groups to customize instruction and target deficits. Increases student choice. 1:1 Chromebooks to increase students ability to improve keyboarding, writing, and research Increase informational text and work with Literary Analysis and Research Simulation Tasks 16
17 Teachers participating in PLCs and district-wide grade level articulation to analyze data and adjust instruction. New word study program in grades 3-5 Words Their Way, to improve written expression and written knowledge New RTI model provides teachers with more specific interventions for struggling learners, including new digital intervention resource Branching Minds Title I programs for extended day intervention programs. 17
18 6th-8th Grade English Language Arts # of valid scores Average Scale Score One Two Three Four Five Four and Five comb. 6 th grade 22% increase over state average. 10% increase in overall passing from 2017 State 99, % 14% 24% 41% 15% 56% District % 5% 17% 57% 21% 78% District % 8% 22% 57% 11% 68% 7 th grade 12% increase over state average. 9% increase in overall passing from 2017 State 99, % 10% 19% 34% 29% 63% District % 6% 16% 38% 37% 75% District % 9% 21% 36% 30% 66% 8 th grade 5% increase over state average. 2% increase in overall passing from 2017 State 100, % 11% 20% 40% 20% 60% District % 12% 18% 42% 23% 65% District % 7% 22% 45% 18% 63% 18
19 6th Grade English Language Arts - Disaggregated Data # of valid scores Average Scale Score One Two Three Four Five Four and Five comb. State 99, % 13.6% 24.0% 41.3% 14.9% 56.2% District % 4.6% 16.5% 56.5% 21.1% 77.6% Female % 1.9% 17.0% 50.9% 29.2% 80.2% Male % 6.9% 16.0% 61.1% 14.5% 75.6% Hispanic > 20 Asian < 10 Black < 10 White % 4.4% 15.1% 57.1% 22.0% 79.0% 2 or more races <10 ED-Yes % 7.1% 39.3% 46.4% 3.6% 50.0% SE-Yes % 21.6% 29.7% 32.4% 8.1% 40.5% 504-Yes < 20 19
20 7th Grade English Language Arts - Disaggregated Data # of valid scores Average Scale Score One Two Three Four Five Four and Five comb. State 98, % 10.2% 18.5% 34.1% 28.6% 62.7% District % 5.8% 16.3% 37.8% 37.4% 75.2% Female % 3.6% 10.9% 38.0% 46.0% 83.9% Male % 7.5% 21.8% 37.6% 28.6% 66.2% Hispanic % 6.7% 43.3% 33.3% 13.3% 46.7% Asian < 10 Black < 10 White % 4.5% 12.5% 38.4% 41.5% 79.9% 2 or more races <10 ED-Yes % 18.8% 31.3% 37.5% 9.4% 46.9% SE-Yes % 6.5% 41.3% 34.8% 4.3% 39.1% 504-Yes < 20 20
21 8th Grade English Language Arts - Disaggregated Data # of valid scores Average Scale Score One Two Three Four Five Four and Five comb. State 100, % 11.1% 19.8% 39.9% 20.4% 60.4% District % 11.9% 18.4% 41.5% 22.7% 64.3% Female % 1.6% 13.0% 54.5% 27.6% 82.1% Male % 20.1% 22.7% 31.2% 18.8% 50.0% Hispanic < 20 Asian < 10 Black < 10 White % 11.5% 17.6% 41.8% 23.4% 65.2% 2 or more races <10 ED-Yes % 16.7% 25.0% 37.5% 12.5% 50.0% SE-Yes % 25.5% 29.4% 11.8% 13.7% 25.5% 504-Yes % 33.3% 19.0% 28.6% 4.8% 33.3% 21
22 Targeted Interventions 6th-8th Grade English Language Arts 22
23 Digital formative assessments, Measuring Up, for diagnostic assessment and progress monitoring. Increase in informational text through Measuring Up and Newsela. New intervention course for ELA, small group instruction, data based instruction Additional teaching support in 7th grade ELA for identified at risk students to provide Tier II supports. Teachers using CD time to analyze PARCC Evidence Statements to identify grade level weaknesses and target areas for at risk students. Title I programs for extended day and summer programs. 23
24 Workshop model - teacher conferring in small groups to customize instruction and target deficits. Increases student choice. 1:1 Chromebooks to increase students ability to provide increased opportunities for keyboarding, writing, research Continue to identify ED students at risk for literacy and analyze interventions and Title I extended day and extended year opportunities. New RTI model provides teachers with more specific interventions for struggling learners, including new digital intervention resource Branching Minds 24
25 9th-11th Grade English Language Arts # of valid scores Average Scale Score One Two Three Four Five Four and Five comb. 9 th grade 8% increase over state average. 2% increase in overall passing from State 99, % 13% 21% 38% 16% 54% District % 9% 24% 46% 16% 62% District % 17% 28% 47% 13% 60% 10 th grade 3% decrease compared to state average. 8% decrease in overall passing from State 95, % 13% 19% 32% 18% 50% District % 17% 23% 37% 10% 47% District % 13% 25% 43% 12% 55% 11 th grade 2% decrease compared to state average. 5% decrease in overall passing from State 69, % 17% 22% 29% 9% 38% District % 18% 31% 33% 3% 36% District % 18% 28% 38% 3% 41% 25
26 9th Grade English Language Arts - Disaggregated Data # of valid scores Average Scale Score One Two Three Four Five Four and Five comb. State 99, % 12.5% 21.1% 38.0% 16.1% 54.1% District % 8.6% 24.4% 46.0% 15.8% 61.9% Female % 2.7% 19.5% 56.4% 19.5% 75.8% Male % 14.8% 29.6% 35.2% 12.0% 47.2% Hispanic % 10.0% 40.0% 25.0% 5.0% 30.0% Asian < 10 Black < 10 White % 8.6% 23.0% 47.9% 16.3% 64.2% 2 or more races <10 ED-Yes % 19.4% 32.3% 16.1% 9.7% 25.8% SE-Yes % 22.4% 41.4% 17.2% 0.0% 17.2% 504-Yes % 4.5% 9.1% 68.2% 9.1% 77.3% 26
27 10th Grade English Language Arts - Disaggregated Data # of valid scores Average Scale Score One Two Three Four Five Four and Five comb. State 95, % 12.8% 19.0% 31.8% 18.1% 49.9% District % 16.8% 22.8% 36.6% 10.3% 47.0% Female % 10.8% 14.7% 46.1% 18.6% 64.7% Male % 21.5% 29.2% 29.2% 3.8% 33.1% Hispanic % 23.8% 28.6% 19.0% 4.8% 23.8% Asian < 10 Black < 10 White % 15.9% 22.9% 37.8% 11.4% 49.3% 2 or more races <10 ED-Yes % 20.7% 31.0% 20.7% 0.0% 20.7% SE-Yes % 37.5% 12.5% 10.0% 0.0% 10.0% 504-Yes < 20 27
28 11th Grade English Language Arts - Disaggregated Data # of valid scores Average Scale Score One Two Three Four Five Four and Five comb. State 69, % 16.6% 22.2% 29.1% 9.0% 38.1% District % 18.2% 30.8% 32.8% 2.8% 35.6% Female % 14.2% 27.5% 45.8% 5.8% 51.7% Male % 22.0% 33.9% 20.5% 0.0% 20.5% Hispanic < 20 Asian < 10 Black < 10 White % 18.4% 29.6% 34.1% 3.1% 37.2% 2 or more races <10 ED-Yes % 17.4% 43.5% 21.7% 0.0% 21.7% SE-Yes % 24.3% 24.3% 24.3% 2.7% 27.0% 504-Yes < 20 28
29 Targeted Interventions 9th-11th Grade English Language Arts 29
30 Title I funding for extended day programs and shared school social worker Increase in informational text and progress monitoring through new digital resource, Newsela Supervisor working with teachers to analyze lesson plans for standards alignment Additional English push-in teaching support for Tier I interventions with struggling learners. Targeting English 10 classes due to HS graduation requirement. Unit Lunch English Support now available Teachers using CD time to analyze PARCC Evidence Statements to identify grade level weaknesses and target areas for at risk students 30
31 Workshop pilot - teacher conferring in small groups to customize instruction and target deficits. Increases student choice. 1:1 Chromebooks to increase students ability to provide increased opportunities for keyboarding, writing, research Continue to identify ED students at risk for literacy and analyze interventions and Title I extended day and extended year opportunities. New RTI model provides teachers with more specific interventions for struggling learners, including new digital intervention resource Branching Minds Analyze curriculum modifications for students with IEPS to ensure appropriate exposure to grade level standards. 31
32 Mathematics 32
33 3rd Grade Mathematics # of valid scores Average Scale Score One Two Three Four Five Four and Five comb. State 99, % 15% 24% 38% 15% 53% District 2018 District % 5% 20% 45% 27% 72% % 7% 18% 49% 24% 73% Allenwood % 4% 11% 48% 36% 84% Central % 3% 24% 49% 23% 72% Old Mill % 9% 22% 40% 23% 73% West Belmar % 3% 21% 41% 28% 69% 19% increase over state average. All schools exceeded state average more than 10%. 1% decrease in overall passing from 2017 to 2018 in this grade level. 33
34 3rd Grade Mathematics - Disaggregated Data # of valid scores Average Scale Score One Two Three Four Five Four and Five comb. State 99, % 15.3% 23.7% 37.8% 15.2% 53.0% District % 5.0% 20.0% 45.0% 26.7% 71.7% Female % 6.5% 22.6% 39.5% 27.4% 66.9% Male % 3.4% 17.2% % 76.7% Hispanic < 20 Asian < 10 Black < 10 White % 5.2% 18.9% 44.3% 29.7% 74.1% 2 or more races <10 ED-Yes % 12.9% 29.0.% 41.9% 3.2% 45.2% SE-Yes % 17.1% 40.0% 17.1% 11.4% 28.6% 504-Yes < 20 34
35 4th Grade Mathematics # of valid scores Average Scale Score One Two Three Four Five Four and Five comb. State 100, % 17% 26% 42% 8% 50% District 2018 District % 14% 27% 46% 11% 57% % 14% 26% 52% 5% 57% Allenwood % 6% 19% 48% 24% 72% Central % 24% 26% 42% 5% 47% Old Mill % 9% 31% 49% 10% 59% West Belmar % 6% 34% 50% 9% 59% 7% increase over state average. Three schools exceeded state average, AW by 22% Consistent performance in overall passing from 2017 to 2018 in this grade level. 35
36 4th Grade Mathematics - Disaggregated Data # of valid scores Average Scale Score One Two Three Four Five Four and Five comb. State 100, % 16.8% 26.3% 41.8% 7.6% 49.4% District % 13.7% 26.9% 46.2% 11.2% 57.4% Female % 7.2% 30.6% 48.6% 11.7% 60.4% Male % 18.8% 23.9% 44.2% 10.9% 55.1% Hispanic < 20 Asian < 10 Black < 10 White % 12.1% 27.6% 46.7% 11.7% 58.4% 2 or more races <10 ED-Yes % 30.6% 36.1% 27.8% 0,0% 27.8% SE-Yes % 26.1% 34.8% 30.4% 0.0% 30.4% 504-Yes < 20 36
37 5th Grade Mathematics # of valid scores Average Scale Score One Two Three Four Five Four and Five comb. State 101, % 17% 27% 38% 10% 48% District 2018 District % 12% 29% 47% 10% 57% % 10% 30% 49% 10% 59% Allenwood % 11% 28% 51% 8% 59% Central % 14% 30% 49% 7% 56% Old Mill % 9% 28% 45% 14% 59% West Belmar % 11% 29% 39% 14% 53% 9% increase over state average. Two schools exceeded state average. 2% decrease in overall passing from 2017 to 2018 in this grade level. 37
38 5th Grade Mathematics - Disaggregated Data # of valid scores Average Scale Score One Two Three Four Five Four and Five comb. State 1001, % 17.0% 26.7% 38.5% 10.4% 48.8% District % 11.5% 28.8% 47.3% 10.2% 57.5% Female % 8.7% 30.1% 44.7% 14.6% 59.2% Male % 13.8% 27.6% 49.6% 6.5% 56.1% Hispanic % 18.5% 25.9% 44.4% 3.7% 48.1% Asian < 10 Black < 10 White % 10.8% 28.5% 48.9% 10.2% 59.1% 2 or more races <10 ED-Yes % 23.3% 33.3% 26.7% 6.7% 33.3% SE-Yes % 26.9% 36.5% 26.9% 3.8% 30.8% 504-Yes < 20 38
39 Targeted Interventions 3rd - 5th Grade Mathematics 39
40 Incorporate new digital formative assessment, Measuring Up, in grades 2-5 for diagnostic assessment, and progress monitoring Teachers participating in PLCs and district-wide grade level articulation to analyze data and adjust instruction Targeted centers specific to student s areas for growth New RTI model provides teachers with more specific interventions for struggling learners, including new digital intervention resource Branching Minds 40
41 New district RTI Math team leading professional development Math interventionists Title I extended day programs for Tier II interventions 41
42 6th-8th Grade Mathematics # of valid scores Average Scale Score One Two Three Four Five Four and Five comb. 6 th grade 16% increase over state average. 5% increase in overall passing from 2017 State 100, % 20% 28% 36% 8% 44% District % 10% 28% 51% 9% 60% District % 9% 31% 49% 6% 55% 7 th grade 6% increase over state average. 12% increase in overall passing from 2017 State 94, % 20% 29% 36% 7% 44% District % 14% 34% 50% 0% 50% District % 14% 47% 37% 1% 38% 8 th grade 11% increase over state average. 20% increase in overall passing from 2017 State 64, % 23% 27% 27% 1% 29% District % 18% 33% 41% 0% 41% District % 20% 35% 20% 1% 21% 42
43 6th Grade Mathematics - Disaggregated Data # of valid scores Average Scale Score One Two Three Four Five Four and Five comb. State 100, % 20.1% 27.9% 35.6% 8.0% 43.5% District % 10.2% 27.7% 51.1% 9.4% 60.4% Female % 10.4% 27.4% 47.2% 13.2% 60.4% Male % 10.1% 27.9% 54.3% 6.2% 60.5% Hispanic <20 Asian < 10 Black < 10 White % 9.4% 26.6% 53.2% 9.4% 62.6% 2 or more races <10 ED-Yes % 28.6% 35.7% 28.6% 3.6% 32.1% SE-Yes % 35.1% 29.7% 21.6% 5.4% 27.0% 504-Yes < 20 43
44 7th Grade Mathematics - Disaggregated Data # of valid scores Average Scale Score One Two Three Four Five Four and Five comb. State 94, % 20.3% 28.6% 36.0% 7.4% 43.4% District % 13.5% 33.8% 49.8% 0.5% 50.2% Female % 12.7% 30.0% 55.5% 0.9% 56.4% Male % 14.4% 38.1% 43.3% 0.0% 43.3% Hispanic % 31.0% 44.8% 24.1% 0.0% 24.1% Asian < 10 Black < 10 White % 9.1% 32.3% 54.9% 0.6% 55.5% 2 or more races <10 ED-Yes % 40.0% 40.0% 20.0% 0.0% 20.0% SE-Yes % 26.1% 37.7% 26.1% 0.0% 26.1% 504-Yes < 20 44
45 8th Grade Mathematics - Disaggregated Data # of valid scores Average Scale Score One Two Three Four Five Four and Five comb. State 64, % 22.7% 27.1% 27.2% 1.0% 28.2% District % 17.9% 32.5% 41.5% 0.0% 41.5% Female % 14.6% 22.0% 56.1% 0.0% 56.1% Male % 19.5% 37.8% 34.1% 0.0% 34.1% Hispanic < 20 Asian < 10 Black < 10 White % 16.2% 33.3% 41.9% 0.0% 41.9% 2 or more races <10 ED-Yes < 20 SE-Yes % 23.8% 31.0% 26.2% 0.0% 26.2% 504-Yes < 20 45
46 Targeted Interventions 6th-8th Grade Mathematics 46
47 New envision Math resource grades 7 & 8 Incorporate new digital formative assessment, Measuring Up, in grades 6-8 for diagnostic assessment, and progress monitoring Teachers participating in PLCs and district-wide grade level articulation to analyze data and adjust instruction New RTI model provides teachers with more specific interventions for struggling learners, including new digital intervention resource Branching Minds 47
48 New district RTI Math team leading professional development Additional math teacher available during Math 7 to provide Tier II interventions. Currently undergoing Math program evaluation 48
49 Algebra I # of valid scores Average Scale Score One Two Three Four Five Four and Five comb. State 110, % 19% 24% 39% 6% 45% District % 7% 17% 67% 5% 72% District % 10% 29% 58% 1% 59% WIS % 1% 3% 87% 9% 96% WHS % 14% 35% 43% 0% 43% 27% increase over state average. 13% increase in overall passing from WIS - 22% increase in overall passing from
50 Algebra I - Disaggregated Data # of valid scores Average Scale Score One Two Three Four Five Four and Five comb. State 110, % 18.6% 24.3% 39.3% 6.5% 45.8% District % 6.8% 17.4% 67.2% 5.1% 72.4% Female % 4.1% 18.5% 71.2% 4.8% 76.0% Male % 9.5% 16.3% 63.3% 5.4% 68.7% Hispanic % 12.5% 25.0% 50.0% 4.2% 54.2% Asian < 10 Black < 10 White % 6.7% 16.7% 68.7% 5.2% 73.8% 2 or more races <10 ED-Yes % 14.7% 32.4% 38.2% 2.9% 41.2% SE-Yes % 25.4% 28.8% % 33.9% 504-Yes % 10.0% 25.0% 60.0% 5.0% 65.0% 50
51 Geometry # of valid scores Average Scale Score One Two Three Four Five Four and Five comb. State 90, % 31% 30% 25% 5% 30% District 2018 District % 18% 37% 41% 3% 44% % 18% 37% 36% 5% 41% WIS % 0% 17% 67% 16% 83% WHS % 22% 42% 34% 0% 34% 14% increase over state average. 3% increase in overall passing from
52 Geometry- Disaggregated Data # of valid scores Average Scale Score One Two Three Four Five Four and Five comb. State 90, % 31.5% 29.6% 24.6% 4.9% 29.5% District % 17.7% 37.0% 40.8% 3.2% 44.1% Female % 12.4% 39.9% 43.8% 3.3% 47.1% Male % 22.8% 34.2% 38.0% 3.2% 41.1% Hispanic % 17.4% 56.5% 17.4% 0.0% 17.4% Asian < 10 Black < 10 White % 17.5% 35.6% 42.5% 3.6% 46.2% 2 or more races <10 ED-Yes % 26.7% 43.3% 23.3% 0.0% 23.3% SE-Yes % 65.9% 22.0% 9.8% 0.0% 9.8% 504-Yes <20 52
53 Algebra II # of valid scores Average Scale Score One Two Three Four Five Four and Five comb. State 78, % 22% 18% 25% 4% 29% District 2018 District % 25% 26% 34% 1% 36% % 17% 30% 34% 0% 34% 7% increase over state average. 2% increase in overall passing from
54 Algebra II - Disaggregated Data # of valid scores Average Scale Score One Two Three Four Five Four and Five comb. State 78, % 22.4% 18.0% 24.6% 4.0% 28.6% District % 25.0% 25.5% 34.0% 1.0% 35.0% Female % 16.7% 34.4% 33.3% 0.0% 33.3% Male % 32.7% 17.3% 34.6% 1.9% 36.5% Hispanic <20 Asian < 10 Black < 10 White % 23.0% 27.0% 36.0% 1.1% 37.1% 2 or more races <10 ED-Yes <20 SE-Yes % 47.8% 17.4% 4.3% 0.0% 4.3% 504-Yes <20 54
55 Targeted Interventions Algebra I Geometry Algebra II 55
56 Algebra and Geometry teachers at WIS and WHS will pilot new digital resource, Math IXL, a standards-based progress monitoring tool Algebra I 7.5 course meets A/B for full year Algebra II 7.5 course meets A/B for full year Math Unit Lunch support teacher available daily Supervisors working with teachers to analyze PARCC Evidence Statements to identify areas for growth and adjust planning and instruction 56
57 New RTI model provides teachers with more specific interventions for struggling learners, including new digital intervention resource Branching Minds New district RTI Math team leading professional development Currently undergoing Math program evaluation 57

58 SAT/ACT Results Wall High School 58
59 SAT Results: 5 Year Data Critical Reading Year Change Wall HS New Jersey N/A N/A Total Group N/A N/A N/A Mathematics Year Change Wall HS New Jersey N/A N/A Total Group N/A N/A N/A 59
60 ACT Results: 5 Year Data English Year Change Wall HS New Jersey Benchmark Score: Mathematics Year Change Wall HS New Jersey Benchmark Score: 60
61 ACT Results: 5 Year Data Reading Year Change Wall HS New Jersey Benchmark Score: Science Year Change Wall HS New Jersey Benchmark Score: 61
 Wall High School")
62 Advanced Placement (AP) Wall High School 62
63 Course/Test Art History 25% N/A N/A N/A 100% Biology 76% 96% 100% 97% 96% Calculus AB 100% 70% 91% 88% 50% Calculus BC 84% 79% 90% 89% 91% Chemistry 100% 100% 100% 86% 94% Computer Science N/A N/A 100% 100% N/A English Language and Composition 81% 92% 93% 100% 90% English Literature and Composition 84% 100% 91% 81% 75% Environmental Science 63% 56% 71% 69% 71% European History N/A N/A 16% 42% N/A Values in chart are % passing Passing scores are scores of 3, 4, or 5 63
64 Course/Test French Language and Culture N/A N/A 9% 40% 33% Human Geography N/A N/A 88% 100% 100% Latin 100% N/A 33% 10% 50% Macroeconomics 61% 46% 42% 87% 91% Microeconomics 65% 40% 44% 36% 43% Music Theory N/A 100% 75% 80% 100% Physics 1 N/A 82% 43% 56% 64% Psychology 74% 80% 76% 83% 69% Spanish Language and Culture 79% 92% 85% 89% 90% Statistics 60% 29% 58% 100% 77% 64
65 Course/Test Studio Art: 2-D Design Portfolio N/A 100% 100% 100% 100% Studio Art: Drawing Portfolio N/A 100% 100% 100% 100% US Government and Politics N/A 46% 41% 94% 100% United States History 70% 65% 73% 89% 100% Overall Passing 78% 78% 70% 87% 86% 65
66 Breakdown of 2018 Scores* Test Total Exams Total Passing Test Total Exams Total Passing Biology % Environmental Science Calculus AB % Human Geography % % Calculus BC % Macro % Chemistry % Physics % English Lang % Psychology % English Lit % Spanish % Statistics % *The breakdown is not reported for courses/tests where fewer than 10 students took the test. 66
67 Highlights of AP 2016 Total Passing Scores 304 Total scores of 3: 129 (42%) Total scores of 4: 119 (39%) Total scores of 5: 57 (19%) 2017 Total Passing Scores: 313 Total Scores of 3: 120 (38%) Total Scores of 4: 137 (44%) Total Scores of 5: 56 (18%) 2018 Total Passing Scores: 264 Total Scores of 3: 94 (29% Total Scores of 4: 105 (32%) Total Scores of 5: 65 (20%) 41 AP Scholars 17 AP Scholars with Honor 10 AP Scholars with Distinction 1 National Scholar 31 AP Scholars 15 AP Scholars with Honor 21 AP Scholars with Distinction 2 National Scholars 26 AP Scholars 11 AP Scholars with Honor 12 AP Scholars with Distinction 1 National Scholar 67

68 ACCESS for ELLs K-12 68
69 Purpose of ACCESS The content of the assessments aligns with the five WIDA ELD Standards: Social & Instructional Language Language of Language Arts Language of Mathematics Language of Science Language of Social Studies 69
70 ACCESS One: Entering Two: Emerging Three: Developing Four: Expanding Five: Bridging Six: Reaching Listening Speaking Reading Writing Oral Language Literacy Comprehension Overall Score
71 Exit from ESL Program Students exit the ESL program based on triangulation of the following criteria: ACCESS score at or above 4.5 PARCC scores Report card grades Classroom teacher recommendation ESL teacher recommendation Students exit the ESL program based on triangulation of the following criteria: 7 ESL program students 71

72 72
Idaho Public Schools
 Advanced Placement: Student Participation 13.5% increase in the number of students participating between 25 and 26 In 26: 3,79 Idaho Public School Students took AP Exams In 25: 3,338 Idaho Public School
Standardized Assessment & Data Overview December 21, 2015
 Standardized Assessment & Data Overview December 21, 2015 Peters Township School District, as a public school entity, will enable students to realize their potential to learn, live, lead and succeed. 2
TABLE OF CONTENTS Credit for Prior Learning... 74
 TABLE OF CONTENTS Credit for Prior Learning... 74 Credit by Examination...74 Specific Course Credit...74 General Education and Associate Degree Credit by Exam...74 Advanced Placement (AP) Examination:
Junior Scheduling Assembly. February 22, 2017
 Junior Scheduling Assembly February 22, 2017 Graduation Requirements State Assessments Assessment Requirements New Jersey Biology Competency Test Taken when enrolled in Biology course PARCC English Language
2015 High School Results: Summary Data (Part I)
") 1 2015 High School Results: Summary Data (Part I) October 27, 2015 Dr. Gregory E. Thornton CEO, Baltimore City Public Schools Theresa D. Jones Chief Achievement and Accountability Officer HS Data Summary
1 2015 High School Results: Summary Data (Part I) October 27, 2015 Dr. Gregory E. Thornton CEO, Baltimore City Public Schools Theresa D. Jones Chief Achievement and Accountability Officer HS Data Summary
NDPC-SD Data Probes Worksheet
 NDPC-SD Data Probes Worksheet This worksheet from the National Dropout Prevention Center for Students with Disabilities (NDPC- SD) is an optional tool to help schools organize multiple years of student
Shelters Elementary School
 Shelters Elementary School August 2, 24 Dear Parents and Community Members: We are pleased to present you with the (AER) which provides key information on the 23-24 educational progress for the Shelters
Cooper Upper Elementary School
 LIVONIA PUBLIC SCHOOLS http://cooper.livoniapublicschools.org 215-216 Annual Education Report BOARD OF EDUCATION 215-16 Colleen Burton, President Dianne Laura, Vice President Tammy Bonifield, Secretary
College and Career Ready Performance Index, High School, Grades 9-12
 Dr. John D. Barge, State School Superintendent Making Education Work for All of Georgia s Students College and Career Ready Performance Index, High School, Grades 9-12 CONTENT MASTERY (END of COURSE TESTS
World s Best Workforce Plan
 2017-18 World s Best Workforce Plan District or Charter Name: PiM Arts High School, 4110-07 Contact Person Name and Position Matt McFarlane, Executive Director In accordance with Minnesota Statutes, section
Colorado s Unified Improvement Plan for Schools for Online UIP Report
 Colorado s Unified Improvement Plan for Schools for 2015-16 Online UIP Report Organization Code: 2690 District Name: PUEBLO CITY 60 Official 2014 SPF: 1-Year Executive Summary How are students performing?
Cooper Upper Elementary School
 LIVONIA PUBLIC SCHOOLS www.livoniapublicschools.org/cooper 213-214 BOARD OF EDUCATION 213-14 Mark Johnson, President Colleen Burton, Vice President Dianne Laura, Secretary Tammy Bonifield, Trustee Dan
EDINA SENIOR HIGH SCHOOL Registration Class of 2020
 EDINA SENIOR HIGH SCHOOL 2017-2018 Registration Class of 2020 Angela Kieffer Taylor Johnson Dylan Hackbarth Lisa Burnham Sandy Schmidt Bill Hicks Course Catalog You may find the course catalog at: http://www.edinaschools.org/ehscounseling_registration
ISD 2184, Luverne Public Schools. xcvbnmqwertyuiopasdfghjklzxcv. Local Literacy Plan bnmqwertyuiopasdfghjklzxcvbn
 qwertyuiopasdfghjklzxcvbnmqw ertyuiopasdfghjklzxcvbnmqwert yuiopasdfghjklzxcvbnmqwertyui opasdfghjklzxcvbnmqwertyuiopa sdfghjklzxcvbnmqwertyuiopasdf ghjklzxcvbnmqwertyuiopasdfghj klzxcvbnmqwertyuiopasdfghjklz
Timeline. Recommendations
 Introduction Advanced Placement Course Credit Alignment Recommendations In 2007, the State of Ohio Legislature passed legislation mandating the Board of Regents to recommend and the Chancellor to adopt
Aligning and Improving Systems for Special Education Services in St Paul Public Schools. Dr. Elizabeth Keenan Assistant Superintendent
 Aligning and Improving Systems for Special Education Services in St Paul Public Schools Dr. Elizabeth Keenan Assistant Superintendent 1 Aligning and Improving Systems for Special Education Student Purpose:
AB 167/216 Graduation. kids-alliance.org/programs/education. Alliance for Children s Rights
 h AB 167/216/1806 GRADUATION: OVERVIEW OF THE LAW Foster and homeless youth who transfer high schools after their second year may graduate by completing minimum state graduation requirements if, at the
College Entrance Testing:
 College Entrance Testing: SATs, ACTs, Subject Tests, and test-optional schools College & Career Day April 1, 2017 Today s Workshop Goal: Learn about different college entrance exams to develop a testing
ADVANCED PLACEMENT STUDENTS IN COLLEGE: AN INVESTIGATION OF COURSE GRADES AT 21 COLLEGES. Rick Morgan Len Ramist
 February 1998 Report No. SR-98-13 ADVANCED PLACEMENT STUDENTS IN COLLEGE: AN INVESTIGATION OF COURSE GRADES AT 21 COLLEGES Rick Morgan Len Ramist Unpublished Statistical Report This is a limited distribution
Getting Results Continuous Improvement Plan
 Page of 9 9/9/0 Department of Education Market Street Harrisburg, PA 76-0 Getting Results Continuous Improvement Plan 0-0 Principal Name: Ms. Sharon Williams School Name: AGORA CYBER CS District Name:
Engage Educate Empower
 Engage Educate Empower John F. Kennedy High School B Engage Educate Empower John F. Kennedy High School C Engage Educate Empower JFK Approved AP Courses Subject 2012-13 2013-14 2014-15 2015-16 Biology
Annual Report to the Public. Dr. Greg Murry, Superintendent
 Annual Report to the Public Dr. Greg Murry, Superintendent 1 Conway Board of Education Ms. Susan McNabb Mr. Bill Clements Mr. Chuck Shipp Mr. Carl Barger Dr. Adam Lamey Dr. Quentin Washispack Mr. Andre
Sunnyvale Middle School School Accountability Report Card Reported Using Data from the School Year Published During
 Sunnyvale Middle School School Accountability Report Card Reported Using Data from the 2014-15 School Year Published During 2015-16 By February 1 of each year, every school in California is required by
NORTH CAROLINA VIRTUAL PUBLIC SCHOOL IN WCPSS UPDATE FOR FALL 2007, SPRING 2008, AND SUMMER 2008
 E&R Report No. 08.29 February 2009 NORTH CAROLINA VIRTUAL PUBLIC SCHOOL IN WCPSS UPDATE FOR FALL 2007, SPRING 2008, AND SUMMER 2008 Authors: Dina Bulgakov-Cooke, Ph.D., and Nancy Baenen ABSTRACT North
School Improvement Fieldbook A Guide to Support College and Career Ready Graduates School Improvement Plan
 School Improvement Plan July 2012 Page 1 of 16 SCHOOL IMPROVEMENT PLAN School Name: Pickens High School District Name: Pickens County Principal Name: Chris LeMieux School Year: 2015-16 Title I Schoolwide
Clarkstown Central School District. Response to Intervention & Academic Intervention Services District Plan
 Clarkstown Central School District Response to Intervention & Academic Intervention Services District Plan 2014-2017 Clarkstown Central School District Board of Education 2013-2014 Michael Aglialoro -
Kahului Elementary School
 Kahului Elementary Code: 405 Status and Improvement Report Year 2014-15 Focus On Standards Grades K-5 Focus on Standards Description Contents Setting Student Profile Community Profile Improvement Summary
Psychometric Research Brief Office of Shared Accountability
 August 2012 Psychometric Research Brief Office of Shared Accountability Linking Measures of Academic Progress in Mathematics and Maryland School Assessment in Mathematics Huafang Zhao, Ph.D. This brief
Miami-Dade County Public Schools
 ENGLISH LANGUAGE LEARNERS AND THEIR ACADEMIC PROGRESS: 2010-2011 Author: Aleksandr Shneyderman, Ed.D. January 2012 Research Services Office of Assessment, Research, and Data Analysis 1450 NE Second Avenue,
Fashion Design Program Articulation
 Memorandum of Understanding (206-207) Los Angeles City College This document is intended both as a memorandum of understanding for college counselors and as a guide for students transferring into Woodbury
African American Male Achievement Update
 Report from the Department of Research, Evaluation, and Assessment Number 8 January 16, 2009 African American Male Achievement Update AUTHOR: Hope E. White, Ph.D., Program Evaluation Specialist Department
Kansas Adequate Yearly Progress (AYP) Revised Guidance
 Revised Guidance") Kansas State Department of Education Kansas Adequate Yearly Progress (AYP) Revised Guidance Based on Elementary & Secondary Education Act, No Child Left Behind (P.L. 107-110) Revised May 2010 Revised May
Kansas State Department of Education Kansas Adequate Yearly Progress (AYP) Revised Guidance Based on Elementary & Secondary Education Act, No Child Left Behind (P.L. 107-110) Revised May 2010 Revised May
Have earned IB, AP, A-Level, French Baccalaureate or Equivalent
 Have earned IB, AP, A-Level, French Baccalaureate or Equivalent Admitted applicants who achieve a minimum grade equivalent to B in their IB Higher Level, GCE A-Level, the Lebanese Baccalaureate, the French
School Performance Plan Middle Schools
 SY 2012-2013 School Performance Plan Middle Schools 734 Middle ALternative Program @ Lombard, Principal Roger Shaw (Interim), Executive Director, Network Facilitator PLEASE REFER TO THE SCHOOL PERFORMANCE
Newburgh Enlarged City School District Academic. Academic Intervention Services Plan
 Newburgh Enlarged City School District Academic Academic Intervention Services Plan Revised September 2016 October 2015 Newburgh Enlarged City School District Elementary Academic Intervention Services
2012 ACT RESULTS BACKGROUND
 Report from the Office of Student Assessment 31 November 29, 2012 2012 ACT RESULTS AUTHOR: Douglas G. Wren, Ed.D., Assessment Specialist Department of Educational Leadership and Assessment OTHER CONTACT
Supply and Demand of Instructional School Personnel
 Supply and Demand of Instructional School Personnel Presentation to the 82 nd Annual Virginia Middle and High School Principals Conference and Exposition Mrs. Patty S. Pitts Assistant Superintendent of
Accuplacer Implementation Report Submitted by: Randy Brown, Ph.D. Director Office of Institutional Research Gavilan College May 2012
 Accuplacer Implementation Report Submitted by: Randy Brown, Ph..D. Director Office of Institutional Research Gavilan Collegee May 01 Introduction New student matriculation is an important factor in students
ONLINE COURSES. Flexibility to Meet Middle and High School Students at Their Point of Need
 ONLINE COURSES Flexibility to Meet Middle and High School Students at Their Point of Need 88 FuelEd Online Courses Standards-based online courses for middle and high school Struggling Seeking Greater Academic
Geographic Area - Englewood
 ROBESON HS Geographic Area - Englewood Official School Name Paul Robeson High School Address 6835 S rmal Blvd Chicago, Illinois 60621 Number Of Students Served Capacity Utilization Adjusted Capacity Adjusted
Manasquan Elementary School State Proficiency Assessments. Spring 2012 Results
 Manasquan Elementary School State Proficiency Assessments Spring 2012 Results Assessments Administered 2012 ACCESS for ELL S- State mandated for English Language Learners. NJPASS- for Grade 2 School Optional.
Port Jefferson Union Free School District. Response to Intervention (RtI) and Academic Intervention Services (AIS) PLAN
 and Academic Intervention Services (AIS) PLAN") Port Jefferson Union Free School District Response to Intervention (RtI) and Academic Intervention Services (AIS) PLAN 2016-2017 Approved by the Board of Education on August 16, 2016 TABLE of CONTENTS
Port Jefferson Union Free School District Response to Intervention (RtI) and Academic Intervention Services (AIS) PLAN 2016-2017 Approved by the Board of Education on August 16, 2016 TABLE of CONTENTS
School Accountability Report Card Published During the School Year
 Met Sacramento High School 810 V St. Sacramento, CA 95818 916.395.5417 Grades 9-12 Vince Wolfe, Principal vince-wolfe@metsacramento.org metsacramento.org 2014-15 School Accountability Report Card Published
ADMISSION TO THE UNIVERSITY
 ADMISSION TO THE UNIVERSITY William Carter, Director of Admission College Hall 140. MSC 128. Extension 2315. Texas A&M University-Kingsville adheres to high standards of academic excellence and admits
Data Diskette & CD ROM
 Data File Format Data Diskette & CD ROM Texas Assessment of Academic Skills Fall 2002 through Summer 2003 Exit Level Test Administrations Attention Macintosh Users To accommodate Macintosh systems a delimiter
Undergraduate Admissions Standards for the Massachusetts State University System and the University of Massachusetts. Reference Guide April 2016
 Undergraduate Admissions Standards for the Massachusetts State University System and the University of Massachusetts Reference Guide April 2016 Massachusetts Department of Higher Education One Ashburton
John F. Kennedy Middle School
 John F. Kennedy Middle School CUPERTINO UNION SCHOOL DISTRICT Steven Hamm, Principal hamm_steven@cusdk8.org School Address: 821 Bubb Rd. Cupertino, CA 95014-4938 (408) 253-1525 CDS Code: 43-69419-6046890
AIS/RTI Mathematics. Plainview-Old Bethpage
 AIS/RTI Mathematics Plainview-Old Bethpage 2015-2016 What is AIS Math? AIS is a partnership between student, parent, teacher, math specialist, and curriculum. Our goal is to steepen the trajectory of each
Executive Summary. Walker County Board of Education. Dr. Jason Adkins, Superintendent 1710 Alabama Avenue Jasper, AL 35501
 Dr. Jason Adkins, Superintendent 1710 Alabama Avenue Jasper, AL 35501 Document Generated On November 3, 2016 TABLE OF CONTENTS Introduction 1 Description of the School System 2 System's Purpose 4 Notable
INFORMATION TECHNOLOGY AND TELECOMMUNICATIONS A $10.00 fee will be assessed for all computer education classes.
 INTERNATIONAL BUSINESS AND FINANCE A $10.00 fee will be assessed for all computer education classes. CODE CO-REQUISITE NOTES H02 820902001 Computing for College and Careers 09-12 Student Interest H40 881211001
A Guide to Adequate Yearly Progress Analyses in Nevada 2007 Nevada Department of Education
 A Guide to Adequate Yearly Progress Analyses in Nevada 2007 Nevada Department of Education Note: Additional information regarding AYP Results from 2003 through 2007 including a listing of each individual
Testing Schedule. Explained
 2014 2015 Testing Schedule Explained Jennifer Dugan Leading for educational excellence and equity. Every day for every one. Agenda Requirements and implementation of legislation Testing schedule for 2014
Hokulani Elementary School
 Hokulani Elementary Code: 109 Status and Improvement Report Year -11 Contents Focus On Standards Grades K-5 This Status and Improvement Report has been prepared as part of the Department's education accountability
Testing for the Homeschooled High Schooler: SAT, ACT, AP, CLEP, PSAT, SAT II
 Testing for the Homeschooled High Schooler: SAT, ACT, AP, CLEP, PSAT, SAT II Does my student *have* to take tests? What exams do students need to take to prepare for college admissions? What are the differences
2012 New England Regional Forum Boston, Massachusetts Wednesday, February 1, More Than a Test: The SAT and SAT Subject Tests
 2012 New England Regional Forum Boston, Massachusetts Wednesday, February 1, 2012 More Than a Test: The SAT and SAT Subject Tests 1 Presenters Chris Lucier Vice President for Enrollment Management, University
Port Jervis City School District Academic Intervention Services (AIS) Plan
 Plan") Port Jervis City School District 2014-2016 Academic Intervention Services (AIS) Plan Port Jervis High School Port Jervis Middle School Anna S. Kuhl Elementary School Hamilton Bicentennial Elementary School
Port Jervis City School District 2014-2016 Academic Intervention Services (AIS) Plan Port Jervis High School Port Jervis Middle School Anna S. Kuhl Elementary School Hamilton Bicentennial Elementary School
Exams: Accommodations Guidelines. English Language Learners
 PSSA Accommodations Guidelines for English Language Learners (ELLs) [Arlen: Please format this page like the cover page for the PSSA Accommodations Guidelines for Students PSSA with IEPs and Students with
https://secure.aacte.org/apps/peds/print_all_forms.php?view=report&prin...
 1 of 35 4/25/2012 9:56 AM A» 2011 PEDS» Institutional Data inst id: 3510 Institutional Data A_1 Institutional Information This information will be used in all official references to your institution. Institution
K-12 Academic Intervention Plan. Academic Intervention Services (AIS) & Response to Intervention (RtI)
 & Response to Intervention (RtI)") K-12 Academic Intervention Plan Academic Intervention Services (AIS) & Response to Intervention (RtI) September 2016 June 2018 2016 2018 K 12 Academic Intervention Plan Table of Contents AIS Overview...Page
K-12 Academic Intervention Plan Academic Intervention Services (AIS) & Response to Intervention (RtI) September 2016 June 2018 2016 2018 K 12 Academic Intervention Plan Table of Contents AIS Overview...Page
INTRODUCTION ( MCPS HS Course Bulletin)
") INTRODUCTION (2012-2013 MCPS HS Course Bulletin) MARYLAND DIPLOMA REQUIREMENTS The state of Maryland authorizes one diploma for all high school graduates, based upon successful fulfillment of four categories
INTRODUCTION (2012-2013 MCPS HS Course Bulletin) MARYLAND DIPLOMA REQUIREMENTS The state of Maryland authorizes one diploma for all high school graduates, based upon successful fulfillment of four categories
YOUR FUTURE IN IB. Why is the International Baccalaureate a great choice for you? Mrs. Debbie Woolard IB Director Marietta High School
 YOUR FUTURE IN IB Why is the International Baccalaureate a great choice for you? Mrs. Debbie Woolard IB Director Marietta High School MHS 11 TH & 12 TH GRADE ACADEMIC OPTIONS Full IB Diploma IB Career
Executive Summary. Hamilton High School
 Executive Summary Hamilton High School Hamilton School District Dr. Kathleen Cooke, Superintendent W220 N6151 Town Line Rd. Sussex, WI 53089 TABLE OF CONTENTS Introduction 1 Executive Summary 2 Description
Executive Summary. Osan High School
 Pacific: Korea Mr. Morgan Nugent, Principal Unit 2037 APO, AP 96278-2039 Document Generated On December 9, 2014 TABLE OF CONTENTS Introduction 1 Description of the School 2 School's Purpose 3 Notable Achievements
EGRHS Course Fair. Science & Math AP & IB Courses
 EGRHS Course Fair Science & Math AP & IB Courses Science Courses: AP Physics IB Physics SL IB Physics HL AP Biology IB Biology HL AP Physics Course Description Course Description AP Physics C (Mechanics)
Bureau of Teaching and Learning Support Division of School District Planning and Continuous Improvement GETTING RESULTS
 PENNSYLVANIA DEPARTMENT OF EDUCATION A Framework for Continuous School Improvement Planning (Summer 2009) GETTING RESULTS Continuous School Improvement Plan Gen 6-2 Year Plan Required for Schools in School
Race, Class, and the Selective College Experience
 Race, Class, and the Selective College Experience Thomas J. Espenshade Alexandria Walton Radford Chang Young Chung Office of Population Research Princeton University December 15, 2009 1 Overview of NSCE
TRANSFER APPLICATION: Sophomore Junior Senior
 : Sophomore Junior Senior 2714 W Augusta Phone: 773.534.9718 Fax: 773.534.4022 Email: admissions@chiarts.org Web: www.chiarts.org CPS Mail Run: G.S.R. #35 FRESHMAN APPLICATION STEPS Thank you for your
Bachelor of Science. Undergraduate Program. Department of Physics
 Department of Physics Undergraduate Program Bachelor of Science Students with a strong interest in understanding the fundamental whys and hows of natural physical phenomena are encouraged to consider majoring
TREATMENT OF SMC COURSEWORK FOR STUDENTS WITHOUT AN ASSOCIATE OF ARTS
 Articulation Agreement REGIS UNIVERSITY Associate s to Bachelor s Program PURPOSE The purpose of the agreement is to enable SMC students who transfer to Regis with an Associate of Arts to be recognized
B.S/M.A in Mathematics
 B.S/M.A in Mathematics The dual Bachelor of Science/Master of Arts in Mathematics program provides an opportunity for individuals to pursue advanced study in mathematics and to develop skills that can
SCHOOL IMPROVEMENT PLAN Salem High School
 Mission Statement The mission of is to offer all students the opportunity to demonstrate independence, self- motivation, and responsibility for self and others. Provided with a safe learning environment
SER CHANGES~ACCOMMODATIONS PAGES
 EAST PARISH SCHOOL BOARD EXCEPTIONAL STUDENT SERVICES DEPARTMENT Excellence in Education! 12732 SILLIMAN STREET. P.O. BOX 397 CLINTON, LOUISIANA 70722 PHONE: (225) 683-8582 FAX: (225) 683-8525 www.efpsb.k12.la.us
RtI: Changing the Role of the IAT
 RtI: Changing the Role of the IAT Aimee A. Kirsch Akron Public Schools Akron, Ohio akirsch@akron.k12.oh.us Urban Special Education Leadership Collaborative November 3, 2006 1 Introductions Akron Public
International: Three-Year School Improvement Plan to September 2016 (Year 2)
") International: Three-Year School Improvement Plan 2016-17 to 2017-18 September 2016 (Year 2) Bellevue School District Mission: To provide all students with an exemplary college preparatory education so
International: Three-Year School Improvement Plan 2016-17 to 2017-18 September 2016 (Year 2) Bellevue School District Mission: To provide all students with an exemplary college preparatory education so
ACADEMIC ALIGNMENT. Ongoing - Revised
 ACADEMIC ALIGNMENT Sandra Andrews December 2012 Erin Busscher, John Dersch, William Faber, Lorraine Fortuna, Laurie Foster, Wilfred Gooch, Fiona Hert, Diane Patrick, Paula Sullivan and Vince James Part
Parent Academy. Common Core & PARCC
 Parent Academy Common Core & PARCC Common Core State Standards What are Academic Standards? Academic Standards describe the knowledge and skills a student needs to have by the end of each school year from
SAT Results December, 2002 Authors: Chuck Dulaney and Roger Regan WCPSS SAT Scores Reach Historic High
 ABOUT THE SAT 2001-2002 SAT Results December, 2002 Authors: Chuck Dulaney and Roger Regan WCPSS SAT Scores Reach Historic High The Scholastic Assessment Test (SAT), more formally known as the SAT I: Reasoning
Columbia High School
 Volume 12, Issue 3 SPECIAL REGENTS EDITION Message from the Principal - John P. Sawchuk - June 2017 Columbia High School Hello Parents/Guardians: With the 2016-2017 school year quickly winding down, I
Course Offerings SUBJECT AND COURSE REQUIREMENTS
 Mira Mesa High School 10510 Reagan Road San Diego, CA 92126 (858) 566-2262 phone (858) 549-9541 fax http://sandi.net/miramesa Course Offerings SUBJECT AND COURSE REQUIREMENTS Minimum Semester Credits Required
Robert Bennis Elementary School
 Robert Bennis Elementary School School Improvement Plan 2010-2011 1 Robert Bennis Elementary School School Improvement Plan 2010-2011 Core Operating Principle Our business is the creation of learning environments
READY OR NOT? CALIFORNIA'S EARLY ASSESSMENT PROGRAM AND THE TRANSITION TO COLLEGE
 READY OR NOT? CALIFORNIA'S EARLY ASSESSMENT PROGRAM AND THE TRANSITION TO COLLEGE Michal Kurlaender University of California, Davis Policy Analysis for California Education March 16, 2012 This research
Georgia Department of Education
 Georgia Department of Education Early Intervention Program (EIP) Guidance 2014-2015 School Year The Rubrics are required for school districts to use along with other supporting documents in making placement
CSU East Bay EAP Breakfast. CSU Office of the Chancellor Student Academic Services Lourdes Kulju Academic Outreach and Early Assessment
 CSU East Bay EAP Breakfast CSU Office of the Chancellor Student Academic Services Lourdes Kulju Academic Outreach and Early Assessment 2015 CAASPP EAP Testing 3.2 million students tested in grades 3-11.
What We Are Learning about Successful Programs In College Calculus
 What We Are Learning about Successful Programs In College Calculus David Bressoud St. Paul, MN Knox College Galesburg, IL May 15, 2014 A pdf file of this PowerPoint is available at www.macalester.edu/~bressoud/talks
EAP. updates KHENG WAICHE. early proficiency programs coordinator
 EAP updates 2016 KHENG WAICHE early proficiency programs coordinator 2015 CAASPP EAP Testing ü 3.2 million students tested in grades 3-11. ü California tested the largest number of students in the Smarter
School Accountability Report Card Published During the School Year
 George Washington Carver School of Arts and Science 10101 Systems Pkwy. Sacramento, CA 95827 916.228.5751 Grades 9-12 Allegra Alessandri, Ed.D, Principal allegra-alessandri@scusd.edu 2014-15 School Accountability
Cuero Independent School District
 Cuero Independent School District Texas Superintendent: Henry Lind Primary contact: Debra Baros, assistant superintendent* 1,985 students, prek-12, rural District Description Cuero Independent School District
WELCOME JUNIORS SENIOR YEAR SCHEDULING
 WELCOME JUNIORS 2016-2017 SENIOR YEAR SCHEDULING COUNSELORS Mrs. M. Dvorchak, A-G Mrs. K. Baluh, H-N Mrs. K. Rygiel DeBor, O-Z 2015-2016 SENIOR YEAR SCHEDULING ASSEMBLY Discuss course selection sheets/scheduling
What is related to student retention in STEM for STEM majors? Abstract:
 What is related to student retention in STEM for STEM majors? Abstract: The purpose of this study was look at the impact of English and math courses and grades on retention in the STEM major after one
Executive Summary. Gautier High School
 Pascagoula School District Mr. Boyd West, Principal 4307 Gautier-Vancleave Road Gautier, MS 39553-4800 Document Generated On January 16, 2013 TABLE OF CONTENTS Introduction 1 Description of the School
Grade 5 + DIGITAL. EL Strategies. DOK 1-4 RTI Tiers 1-3. Flexible Supplemental K-8 ELA & Math Online & Print
 Standards PLUS Flexible Supplemental K-8 ELA & Math Online & Print Grade 5 SAMPLER Mathematics EL Strategies DOK 1-4 RTI Tiers 1-3 15-20 Minute Lessons Assessments Consistent with CA Testing Technology
Harmony School of Advancement Harmony Public Schools Course Selection Guide
 Harmony School of Advancement Harmony Public Schools Course Selection Guide 2013-2014 At critical decision points in your high school career, you must review your educational and career goals thoughtfully
Strategic Plan Dashboard
 Strategic Plan Dashboard 2015-16 2010-18* *Strategic Plan extended until 2018 (1) Goal 1: Continue to operate in a fiscally responsible manner. Focus Area 1A: Reduce costs/expenses where possible Strategy
Campus Improvement Plan Elementary/Intermediate Campus: Deretchin Elementary Rating: Met Standard
 Campus Improvement Plan 2015-2016 Elementary/Intermediate Campus: Deretchin Elementary Rating: Met Standard Goal 1: Student Achievement and Post-Secondary Success Deretchin Elementary School will maintain
EFFECTS OF MATHEMATICS ACCELERATION ON ACHIEVEMENT, PERCEPTION, AND BEHAVIOR IN LOW- PERFORMING SECONDARY STUDENTS
 EFFECTS OF MATHEMATICS ACCELERATION ON ACHIEVEMENT, PERCEPTION, AND BEHAVIOR IN LOW- PERFORMING SECONDARY STUDENTS Jennifer Head, Ed.S Math and Least Restrictive Environment Instructional Coach Department
Geographic Area - Englewood
 FULTON Geographic Area - Englewood Official School Name Robert Fulton Elementary School Address 5300 S Hermitage Ave Chicago, Illinois 60609 Number Of Students Served Capacity Utilization Adjusted Capacity
SSIS SEL Edition Overview Fall 2017
 Image by Photographer s Name (Credit in black type) or Image by Photographer s Name (Credit in white type) Use of the new SSIS-SEL Edition for Screening, Assessing, Intervention Planning, and Progress
CITY COLLEGE OF SAN FRANCISCO Transfer Credit Agreement Catalog
 Notre Dame de Namur University agrees to accept the CCSF courses listed below in satisfaction of General Education (GE) requirements. For further information or to make an appointment to meet with a transfer
George A. Buljan Middle School School Accountability Report Card Reported Using Data from the School Year Published During
 George A. Buljan Middle School School Accountability Report Card Reported Using Data from the 2015-16 School Year Published During 2016-17 By February 1 of each year, every school in California is required
ADDENDUM 2016 Template - Turnaround Option Plan (TOP) - Phases 1 and 2 St. Lucie Public Schools
 - Phases 1 and 2 St. Lucie Public Schools") ADDENDUM 2016 Template - Turnaround Option Plan (TOP) - Phases 1 and 2 St. Lucie Public Schools The district requests an additional year to implement the previously approved turnaround option. Evidence
ADDENDUM 2016 Template - Turnaround Option Plan (TOP) - Phases 1 and 2 St. Lucie Public Schools The district requests an additional year to implement the previously approved turnaround option. Evidence