DISTRICT STUDENT PERFORMANCE REPORT
|
|
|
- Gloria Shavonne Owens
- 5 years ago
- Views:
Transcription

1 WOODBURY CITY PUBLIC SCHOOLS A Leader in Personalizing Education DISTRICT STUDENT PERFORMANCE REPORT Addendum I: School Performance Reports To be Presented to the Woodbury City Board of Education February 25, 2015 Joseph Jones, III Superintendent of Schools Lindsay E. Wilhelmi Evaluation & Research Coordinator
2 Introduction This is the first of two addendums to the fall District Student Performance Report: Student Data, which provide and update on information that relates to the school year and was just recently released by the New Jersey Department of Education (NJDOE). This report will focus on School Performance Reports and the second addendum provides an overview of student growth data. NJDOE released its annual School Performance Reports in February The data presented in these school-by-school documents is summarized in this addendum. School performance reports attempt to bring together multiple metrics to determine in what areas students and schools are successful in a given year and note areas for improvement. These reports also rank schools with regard to certain performance areas - academic achievement, college and career readiness, and student growth, along with several sub-categories in each area. Peer schools (Elementary and Junior-Senior High Schools) are chosen by the NJDOE by attempting to match schools based on factors such as: o % economically disadvantaged o % limited English proficiency o % special education o Grade span (elementary, middle, high) Academic achievement data reported includes: o NJASK (Elementary) o HSPA proficiency rates Junior-Senior High School) o Individualized NCLB progress targets College and Career Readiness (Elementary) data reported includes: o Chronic absenteeism (not present for more than 10% of the total days possible for that student for any reason) College and Career Readiness (Junior-Senior High School) data reported includes: o % of students participating in SAT o % of students participating in PSAT and/or ACT-Plan o % of students scoring above 1550 on SAT o % of students taking at least one AP test or IB test in English, mathematics, social studies, or science (NOTE: IB tests were not included in the performance reports) o % of AP tests in English, mathematics, social studies, or science with score of 3 or greater or IB test with a score of 4 or better (NOTE: IB tests were not included in the performance reports) o % of students participating in approved Career and Technical Programs Student Growth (Elementary) data reported includes: o Student growth percentiles, using a student s academic peers (other grade-level peers statewide who scored similarly the previous testing year) and the following year s achievement data for that academic peer group to determine each student s growth score (a percentile rank). Graduation and Postsecondary data reported includes:
3 o o Overall Graduation Rate Dropout Rate School wide median growth percentiles (for Elementary Schools), arrived at via ranking a school s student growth percentiles from highest to lowest, and finding the median. An example of an interpretation is as follows, from page 15 of the NJ School Performance Reports Interpretive Guide: A schoolwide growth score of 35 in language arts means that the median student s growth in language arts in the school was 35. The median is the point where half of the students in the school fall above and half fell below. A school is deemed to be making low growth if the growth score is below 35, typical growth if a score is between 35 and 65 and high growth if the score is greater than 65.( InterpretiveGuide.pdf). Concerns about Reporting Historical Data as Year-to-Year Comparison State test achievement trend data is presented for the past four years for each tested grade level. Caution should be exercised when making year-to-year comparisons based on what the state presents, since (in most cases) each year represents a different group of students with a possible different demographic makeup and other different contextual factors that impact performance. Locally, Woodbury makes year-to-year comparisons by examining cohort trends, which can be found in our publically available District Student Performance Report: Concerns about Peer Schools and Categories as Indicators for Woodbury Jr-Sr High School Woodbury Junior-Senior High School serves students in grades 6 through 12. Of the 31 peer schools selected by the NJDOE for Woodbury, only one other school was a 6-12 building, and only 5 served grades 7 through 12. One was a charter school that served K through grade 12. Another concern is that even though this is titled a Woodbury Jr-Sr High report, with a 6 through 12 grade span, the indicators reported by the NJDOE within the report often only represent performance among the 9 through 12 population of students. For example, growth data is not captured in this report for students in grades 6 through 8 the same way it would be captured if a separate middle school or junior high report was produced. Conversely, NCLB progress target achievement presented in a fall NJDOE report was based on the achievement of the entire 6-12 population on NJASK; however, Academic Achievement Indicators for the school only list HSPA for Schoolwide Performance, making the percentage of targets met indicator misleading. This results in a very complicated, confusing performance report for the Junior-Senior High School. Please see complete report for more information about the growth of the grades 6 through 8 group of students. Summary of Data- EVERGREEN The chart below summarizes the percentage of Targets met by Evergreen in compared with the previous two school years.
4 For Academic Achievement, the percentage of targets met represents the percentage of progress targets met as defined by the NJDOE s NCLB waiver; that is, that the school will reduce by half the percentage of students schoolwide and in specified subgroups who were partially proficient in (baseline year) over the course of six years, using equal increments as annual targets. Note that this means the proficiency target is higher for each school year. For College and Career Readiness, the percentage of targets met represents whether the school was successful in meeting the statewide target of 6 percent of students (or fewer) missing 10 percent of the total days possible for that individual student during the school year. For Student Growth, the percentage of targets met represents whether the school s median growth score in language arts and mathematics for all students in the school met the statewide target of 35. EVERGREEN OVERALL PERFORMANCE Indicator % of Targets Met Academic Achievement 100% 50% 17% Language Arts 100% 0% 33% Mathematics 100% 100% 0% College and Career Readiness 0% 0% 0% Chronic Absenteeism 0% 0% 0% Student Growth 100% 100% 100% Language Arts 100% 100% 100% Mathematics 100% 100% 100% The charts that follow summarize peer group percentile ranking as well as performance of Evergreen on the various performance indicators in compared with the previous two years. Caution should be exercised, as peer schools change from year to year:
5
6
7
8
9 Summary of Data - WALNUT The chart below summarizes the percentage of Targets met by West End in compared with the previous two school years. For Academic Achievement, the percentage of targets met represents the percentage of progress targets met as defined by the NJDOE s NCLB waiver; that is, that the school will reduce by half the percentage of students schoolwide and in specified subgroups who were partially proficient in (baseline year) over the course of six years, using equal increments as annual targets. Note that this means the proficiency target is higher for each school year. For College and Career Readiness, the percentage of targets met represents whether the school was successful in meeting the statewide target of 6 percent of students (or fewer) missing 10 percent of the total days possible for that individual student during the school year. For Student Growth, the percentage of targets met represents whether the school s median growth score in language arts and mathematics for all students in the school met the statewide target of 35. WALNUT OVERALL PERFORMANCE Indicator % of Targets Met Academic Achievement 100% 100% 100% Language Arts 100% 100% 100% Mathematics 100% 100% 100% College and Career Readiness 0% 0% 0% Chronic Absenteeism 0% 0% 0% Student Growth 100% 100% 100% Language Arts 100% 100% 100% Mathematics 100% 100% 100% The charts that follow summarize peer group percentile ranking as well as performance of Walnut on the various performance indicators in compared with the previous two years. Caution should be exercised, as peer schools change from year to year:
10
11
12
13
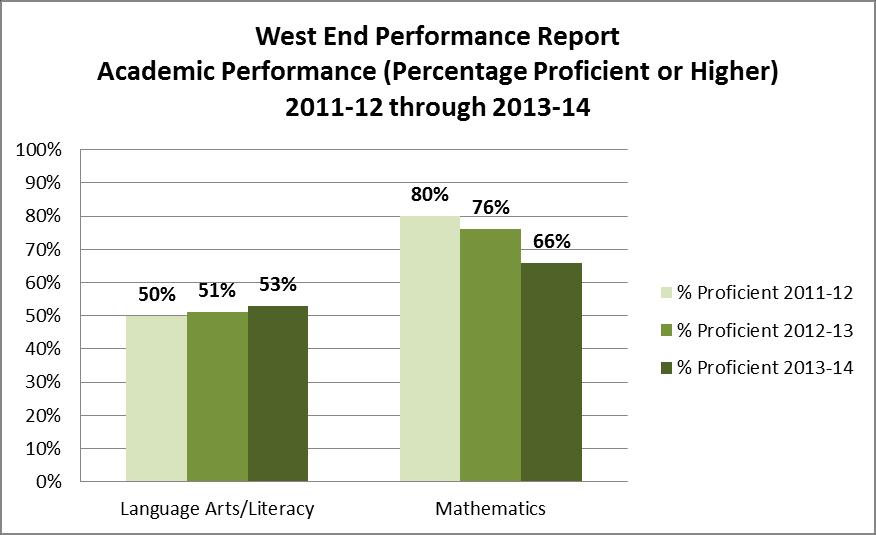
14 Summary of Data WEST END The chart below summarizes the percentage of Targets met by West End in compared with the previous two school years. For Academic Achievement, the percentage of targets met represents the percentage of progress targets met as defined by the NJDOE s NCLB waiver; that is, that the school will reduce by half the percentage of students schoolwide and in specified subgroups who were partially proficient in (baseline year) over the course of six years, using equal increments as annual targets. Note that this means the proficiency target is higher for each school year. For College and Career Readiness, the percentage of targets met represents whether the school was successful in meeting the statewide target of 6 percent of students (or fewer) missing 10 percent of the total days possible for that individual student during the school year. For Student Growth, the percentage of targets met represents whether the school s median growth score in language arts and mathematics for all students in the school met the statewide target of 35. WEST END OVERALL PERFORMANCE Indicator % of Targets Met Academic Achievement 88% 60% 25% Language Arts 50% 20% 25% Mathematics 80% 100% 25% College and Career Readiness 0% 0% 0% Chronic Absenteeism 0% 0% 0% Student Growth 50% 0% 0% Language Arts 0% 0% 0% Mathematics 100% 0% 0% The charts that follow summarize peer group percentile ranking as well as performance of West End on the various performance indicators in compared with the previous two years. Caution should be exercised, as peer schools change from year to year:
15
16
17
18
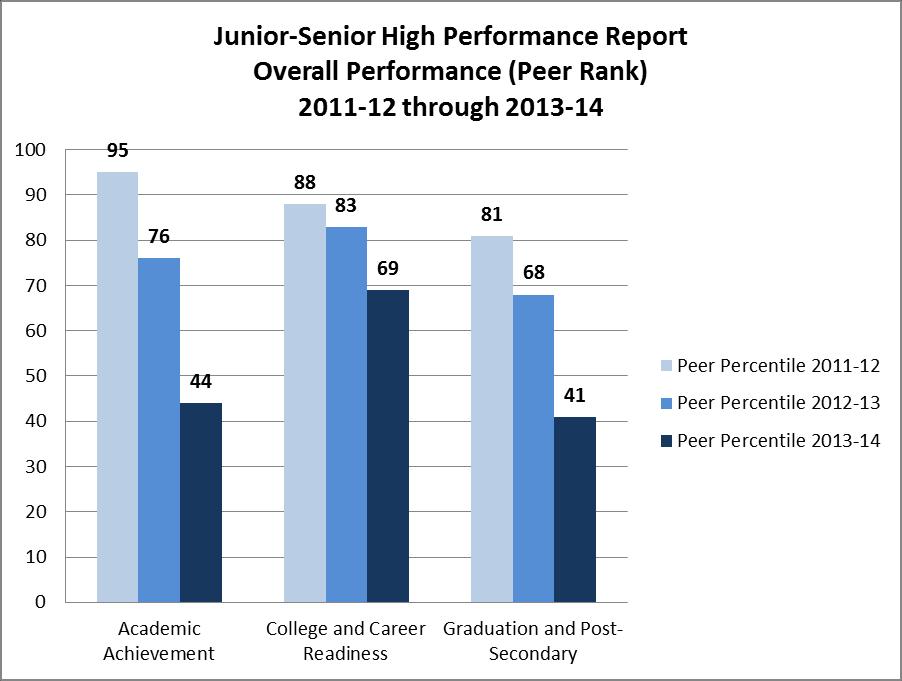
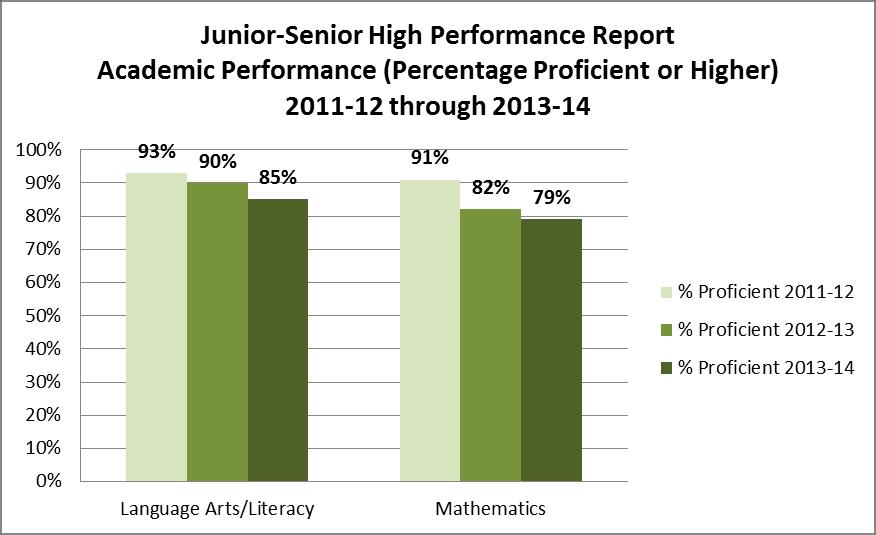
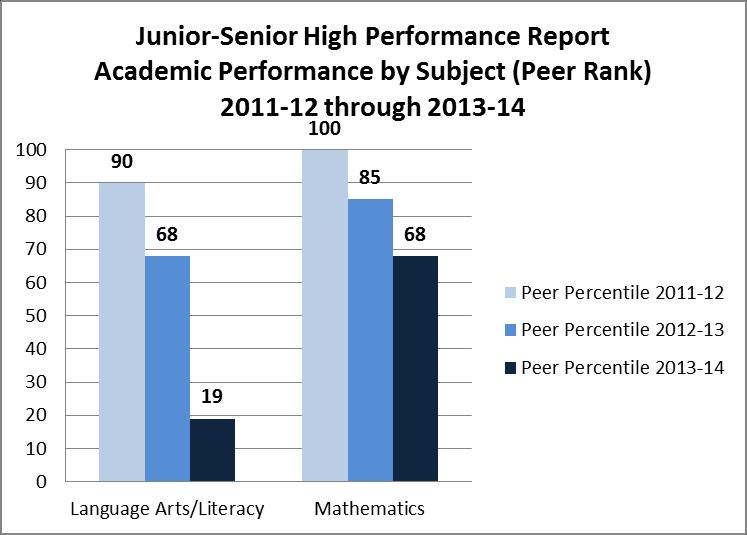
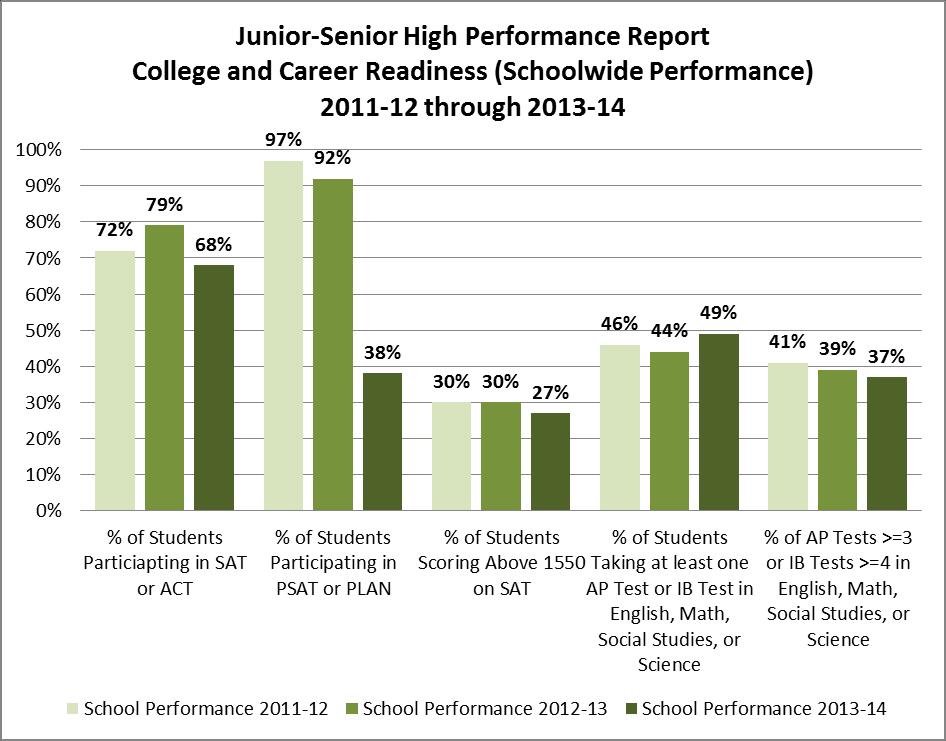
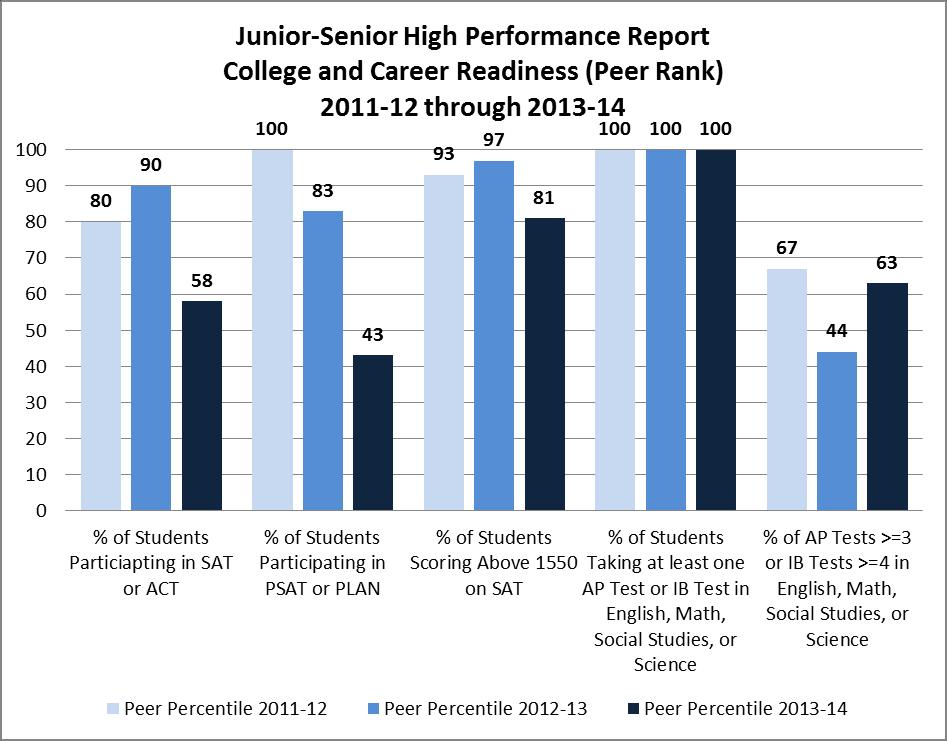
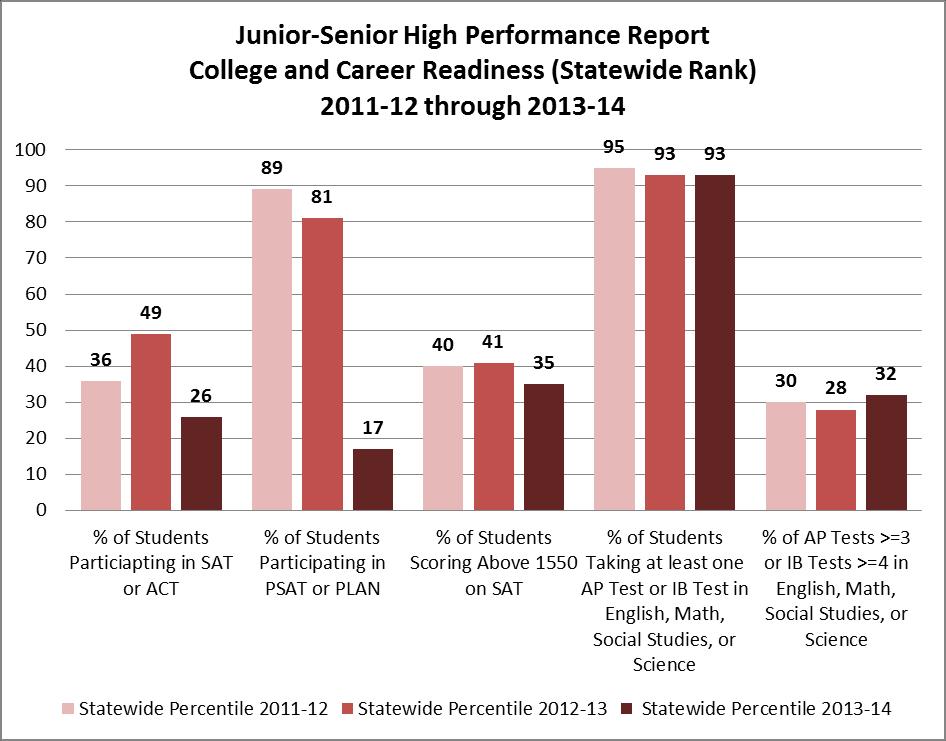
19 Summary of Data JUNIOR-SENIOR HIGH SCHOOL The chart below summarizes the percentage of Targets met by the Junior-Senior High School in compared with the previous two school years. For Academic Achievement, the percentage of targets met represents the percentage of progress targets met as defined by the NJDOE s NCLB waiver; that is, that the school will reduce by half the percentage of students schoolwide and in specified subgroups who were partially proficient in (baseline year) over the course of six years, using equal increments as annual targets. Note that this means the proficiency target is higher for each school year. For College and Career Readiness, the percentage of targets met represents whether the school was successful in meeting statewide targets for each indicator: 80% of students participating in SAT or ACT, 60% of students participating in PSAT or PLAN, 40% of students scoring above 1550 on SAT, 35% of students taking at least one AP or IB test in English, mathematics, social studies, or science, and 75% of tests greater than or equal to 3 (for AP tests) or 4 (for IB tests). For Graduation and Post Secondary, the percentage of targets met represents whether the succeeded in exceeding the statewide target of 75 percent for graduation rate, and stayed under the statewide target of no more than 2 percent for dropout rate. % of Targets Met JR-SR HIGH Indicator Academic Achievement 75% 83% 33% Language Arts 50% 67% 17% Mathematics 100% 100% 50% College and Career Readiness 40% 40% 20% % of Students Participating in SAT or ACT 0% 0% 0% % of students Participating in PSAT or PLAN 100% 100% 0% OVERALL % of Students Scoring about 1550 on SAT 0% 0% 0% PERFORMANCE % of Students Taking at least one AP Test of IB Test in English, Math, Social Studies, or 100% 100% 100% Science % of AP Tests >=3 or IB Test >= 4 in English, Math, Social Studies or Science 0% 0% 0% Graduation and Post-Secondary 50% 100% 50% Overall Graduation Rate 100% 100% 100% Dropout Rate* 0% 100% 0% *note: in , the school missed the statewide target of 2.0% by 0.2 percentage point. The charts that follow summarize peer group percentile ranking as well as performance of the Junior- Senior High School on the various performance indicators in compared with the previous two years. Caution should be exercised, as peer schools change from year to year:
20
21
22
23
24 Junior-Senior High Performance Report Graduation & Postsecondary Indicators (Statewide Rank) through Overall Graduation Rate 9 Dropout Rate Statewide Percentile Statewide Percentile Statewide Percentile
25 APPENDIX NJDOE SCHOOL PERFORMANCE REPORTS Evergreen School Performance Report: Walnut School Performance Report: West End School Performance Report: Junior-Senior High School School Performance Report:
State of New Jersey
 OVERVIEW 1213 GRADE SPAN KG6 116946 GALLOWAY, NEW JERSEY 85 This school's academic performance is about average when compared to schools across the state. Additionally, its academic performance is very
Manasquan Elementary School State Proficiency Assessments. Spring 2012 Results
 Manasquan Elementary School State Proficiency Assessments Spring 2012 Results Assessments Administered 2012 ACCESS for ELL S- State mandated for English Language Learners. NJPASS- for Grade 2 School Optional.
Colorado s Unified Improvement Plan for Schools for Online UIP Report
 Colorado s Unified Improvement Plan for Schools for 2015-16 Online UIP Report Organization Code: 2690 District Name: PUEBLO CITY 60 Official 2014 SPF: 1-Year Executive Summary How are students performing?
African American Male Achievement Update
 Report from the Department of Research, Evaluation, and Assessment Number 8 January 16, 2009 African American Male Achievement Update AUTHOR: Hope E. White, Ph.D., Program Evaluation Specialist Department
2015 High School Results: Summary Data (Part I)
") 1 2015 High School Results: Summary Data (Part I) October 27, 2015 Dr. Gregory E. Thornton CEO, Baltimore City Public Schools Theresa D. Jones Chief Achievement and Accountability Officer HS Data Summary
1 2015 High School Results: Summary Data (Part I) October 27, 2015 Dr. Gregory E. Thornton CEO, Baltimore City Public Schools Theresa D. Jones Chief Achievement and Accountability Officer HS Data Summary
FOUR STARS OUT OF FOUR
 Louisiana FOUR STARS OUT OF FOUR Louisiana s proposed high school accountability system is one of the best in the country for high achievers. Other states should take heed. The Purpose of This Analysis
Annual Report to the Public. Dr. Greg Murry, Superintendent
 Annual Report to the Public Dr. Greg Murry, Superintendent 1 Conway Board of Education Ms. Susan McNabb Mr. Bill Clements Mr. Chuck Shipp Mr. Carl Barger Dr. Adam Lamey Dr. Quentin Washispack Mr. Andre
Port Graham El/High. Report Card for
 School: District: Kenai Peninsula Grades: K - 12 School Enrollment: 20 Title I School? No Title 1 Program: Accreditation: Report Card for 2008-2009 A Title 1 school receives federal money in support low-achieving
ILLINOIS DISTRICT REPORT CARD
 -6-525-2- Hazel Crest SD 52-5 Hazel Crest SD 52-5 Hazel Crest, ILLINOIS 2 8 ILLINOIS DISTRICT REPORT CARD and federal laws require public school districts to release report cards to the public each year.
A Guide to Adequate Yearly Progress Analyses in Nevada 2007 Nevada Department of Education
 A Guide to Adequate Yearly Progress Analyses in Nevada 2007 Nevada Department of Education Note: Additional information regarding AYP Results from 2003 through 2007 including a listing of each individual
Miami-Dade County Public Schools
 ENGLISH LANGUAGE LEARNERS AND THEIR ACADEMIC PROGRESS: 2010-2011 Author: Aleksandr Shneyderman, Ed.D. January 2012 Research Services Office of Assessment, Research, and Data Analysis 1450 NE Second Avenue,
Bureau of Teaching and Learning Support Division of School District Planning and Continuous Improvement GETTING RESULTS
 PENNSYLVANIA DEPARTMENT OF EDUCATION A Framework for Continuous School Improvement Planning (Summer 2009) GETTING RESULTS Continuous School Improvement Plan Gen 6-2 Year Plan Required for Schools in School
Bellehaven Elementary
 Overall istrict: Albuquerque Public Schools Grade Range: KN-05 Code: 1229 School Grade Report Card 2013 Current Standing How did students perform in the most recent school year? are tested on how well
Orleans Central Supervisory Union
 Orleans Central Supervisory Union Vermont Superintendent: Ron Paquette Primary contact: Ron Paquette* 1,142 students, prek-12, rural District Description Orleans Central Supervisory Union (OCSU) is the
Educational Attainment
 A Demographic and Socio-Economic Profile of Allen County, Indiana based on the 2010 Census and the American Community Survey Educational Attainment A Review of Census Data Related to the Educational Attainment
3.7 General Education Homebound (GEH) Program
 Program") 3.7 General Education Homebound (GEH) Program Any student who is served through the GEH program must meet the following three criteria: The student is expected to be confined at home or hospital bedside
3.7 General Education Homebound (GEH) Program Any student who is served through the GEH program must meet the following three criteria: The student is expected to be confined at home or hospital bedside
Iowa School District Profiles. Le Mars
 Iowa School District Profiles Overview This profile describes enrollment trends, student performance, income levels, population, and other characteristics of the public school district. The report utilizes
Coming in. Coming in. Coming in
 212-213 Report Card for Glenville High School SCHOOL DISTRICT District results under review by the Ohio Department of Education based upon 211 findings by the Auditor of State. Achievement This grade combines
Kansas Adequate Yearly Progress (AYP) Revised Guidance
 Revised Guidance") Kansas State Department of Education Kansas Adequate Yearly Progress (AYP) Revised Guidance Based on Elementary & Secondary Education Act, No Child Left Behind (P.L. 107-110) Revised May 2010 Revised May
Kansas State Department of Education Kansas Adequate Yearly Progress (AYP) Revised Guidance Based on Elementary & Secondary Education Act, No Child Left Behind (P.L. 107-110) Revised May 2010 Revised May
ENGLISH LANGUAGE LEARNERS (ELL) UPDATE FOR SUNSHINE STATE TESOL 2013
 UPDATE FOR SUNSHINE STATE TESOL 2013") ENGLISH LANGUAGE LEARNERS (ELL) UPDATE FOR SUNSHINE STATE TESOL 2013 Presented by: Chane Eplin, Bureau Chief Student Achievement through Language Acquisition Florida Department of Education May 16, 2013
ENGLISH LANGUAGE LEARNERS (ELL) UPDATE FOR SUNSHINE STATE TESOL 2013 Presented by: Chane Eplin, Bureau Chief Student Achievement through Language Acquisition Florida Department of Education May 16, 2013
Cooper Upper Elementary School
 LIVONIA PUBLIC SCHOOLS http://cooper.livoniapublicschools.org 215-216 Annual Education Report BOARD OF EDUCATION 215-16 Colleen Burton, President Dianne Laura, Vice President Tammy Bonifield, Secretary
ILLINOIS DISTRICT REPORT CARD
 -6-525-2- HAZEL CREST SD 52-5 HAZEL CREST SD 52-5 HAZEL CREST, ILLINOIS and federal laws require public school districts to release report cards to the public each year. 2 7 ILLINOIS DISTRICT REPORT CARD
College and Career Ready Performance Index, High School, Grades 9-12
 Dr. John D. Barge, State School Superintendent Making Education Work for All of Georgia s Students College and Career Ready Performance Index, High School, Grades 9-12 CONTENT MASTERY (END of COURSE TESTS
Massachusetts Department of Elementary and Secondary Education. Title I Comparability
 Massachusetts Department of Elementary and Secondary Education Title I Comparability 2009-2010 Title I provides federal financial assistance to school districts to provide supplemental educational services
The Condition of College & Career Readiness 2016
 The Condition of College and Career Readiness This report looks at the progress of the 16 ACT -tested graduating class relative to college and career readiness. This year s report shows that 64% of students
Moving the Needle: Creating Better Career Opportunities and Workforce Readiness. Austin ISD Progress Report
 Moving the Needle: Creating Better Career Opportunities and Workforce Readiness Austin ISD Progress Report 2013 A Letter to the Community Central Texas Job Openings More than 150 people move to the Austin
FTE General Instructions
 Florida Department of Education Bureau of PK-20 Education Data Warehouse and Office of Funding and Financial Reporting FTE General Instructions 2017-18 Questions and comments regarding this publication
Getting Results Continuous Improvement Plan
 Page of 9 9/9/0 Department of Education Market Street Harrisburg, PA 76-0 Getting Results Continuous Improvement Plan 0-0 Principal Name: Ms. Sharon Williams School Name: AGORA CYBER CS District Name:
An Empirical Analysis of the Effects of Mexican American Studies Participation on Student Achievement within Tucson Unified School District
 An Empirical Analysis of the Effects of Mexican American Studies Participation on Student Achievement within Tucson Unified School District Report Submitted June 20, 2012, to Willis D. Hawley, Ph.D., Special
EFFECTS OF MATHEMATICS ACCELERATION ON ACHIEVEMENT, PERCEPTION, AND BEHAVIOR IN LOW- PERFORMING SECONDARY STUDENTS
 EFFECTS OF MATHEMATICS ACCELERATION ON ACHIEVEMENT, PERCEPTION, AND BEHAVIOR IN LOW- PERFORMING SECONDARY STUDENTS Jennifer Head, Ed.S Math and Least Restrictive Environment Instructional Coach Department
New Jersey Department of Education World Languages Model Program Application Guidance Document
 New Jersey Department of Education 2018-2020 World Languages Model Program Application Guidance Document Please use this guidance document to help you prepare for your district s application submission
Peer Influence on Academic Achievement: Mean, Variance, and Network Effects under School Choice
 Megan Andrew Cheng Wang Peer Influence on Academic Achievement: Mean, Variance, and Network Effects under School Choice Background Many states and municipalities now allow parents to choose their children
Charter School Performance Comparable to Other Public Schools; Stronger Accountability Needed
 April 2005 Report No. 05-21 Charter School Performance Comparable to Other Public Schools; Stronger Accountability Needed at a glance On average, charter school students are academically behind when they
Cooper Upper Elementary School
 LIVONIA PUBLIC SCHOOLS www.livoniapublicschools.org/cooper 213-214 BOARD OF EDUCATION 213-14 Mark Johnson, President Colleen Burton, Vice President Dianne Laura, Secretary Tammy Bonifield, Trustee Dan
Statistical Peers for Benchmarking 2010 Supplement Grade 11 Including Charter Schools NMSBA Performance 2010
 Statistical Peers for Benchmarking 2010 Supplement Grade 11 Including Charter Schools NMSBA Performance 2010 September 2010 River Dunavin 1 ALBUQUERQUE PUBLIC SCHOOLS BOARD OF EDUCATION PAULA MAES Vice
AB104 Adult Education Block Grant. Performance Year:
 AB104 Adult Education Block Grant Performance Year: 2015-2016 Funding source: AB104, Section 39, Article 9 Version 1 Release: October 9, 2015 Reporting & Submission Process Required Funding Recipient Content
Undergraduate Admissions Standards for the Massachusetts State University System and the University of Massachusetts. Reference Guide April 2016
 Undergraduate Admissions Standards for the Massachusetts State University System and the University of Massachusetts Reference Guide April 2016 Massachusetts Department of Higher Education One Ashburton
Supply and Demand of Instructional School Personnel
 Supply and Demand of Instructional School Personnel Presentation to the 82 nd Annual Virginia Middle and High School Principals Conference and Exposition Mrs. Patty S. Pitts Assistant Superintendent of
National Longitudinal Study of Adolescent Health. Wave III Education Data
 National Longitudinal Study of Adolescent Health Wave III Education Data Primary Codebook Chandra Muller, Jennifer Pearson, Catherine Riegle-Crumb, Jennifer Harris Requejo, Kenneth A. Frank, Kathryn S.
Writing a Basic Assessment Report. CUNY Office of Undergraduate Studies
 Writing a Basic Assessment Report What is a Basic Assessment Report? A basic assessment report is useful when assessing selected Common Core SLOs across a set of single courses A basic assessment report
Institutional Program Evaluation Plan Training
 Institutional Program Evaluation Plan Training Office of Educator Preparation March 2015 Section 1004.04, Florida Statutes, Each state-approved teacher preparation program must annually report A list of
SINGLE PLAN FOR STUDENT ACHIEVEMENT. Peter Johansen High School
 SINGLE PLAN FOR STUDENT ACHIEVEMENT Peter Johansen High School 50 711755030135 CDS Code Non TITLE 1: TITLE 1 Schoolwide: X TITLE 1 Targeted Assistance: Date of this revision: 10/18/16 This is a plan of
EDUCATIONAL ATTAINMENT
 EDUCATIONAL ATTAINMENT By 2030, at least 60 percent of Texans ages 25 to 34 will have a postsecondary credential or degree. Target: Increase the percent of Texans ages 25 to 34 with a postsecondary credential.
Minnesota s Consolidated State Plan Under the Every Student Succeeds Act (ESSA)
") Minnesota s Consolidated State Plan Under the Every Student Succeeds Act (ESSA) To be submitted to the U.S. Department of Education in September 2017 IMPORTANT NOTE: This is an early draft prepared for
Minnesota s Consolidated State Plan Under the Every Student Succeeds Act (ESSA) To be submitted to the U.S. Department of Education in September 2017 IMPORTANT NOTE: This is an early draft prepared for
Status of Latino Education in Massachusetts: A Report
 University of Massachusetts Boston ScholarWorks at UMass Boston Gastón Institute Publications Gastón Institute for Latino Community Development and Public Policy Publications 3-1-2008 Status of Latino
Table of Contents PROCEDURES
 1 Table of Contents PROCEDURES 3 INSTRUCTIONAL PRACTICE 3 INSTRUCTIONAL ACHIEVEMENT 3 HOMEWORK 4 LATE WORK 5 REASSESSMENT 5 PARTICIPATION GRADES 5 EXTRA CREDIT 6 ABSENTEEISM 6 A. Enrolled Students 6 B.
Cuero Independent School District
 Cuero Independent School District Texas Superintendent: Henry Lind Primary contact: Debra Baros, assistant superintendent* 1,985 students, prek-12, rural District Description Cuero Independent School District
Effectiveness of McGraw-Hill s Treasures Reading Program in Grades 3 5. October 21, Research Conducted by Empirical Education Inc.
 Effectiveness of McGraw-Hill s Treasures Reading Program in Grades 3 5 October 21, 2010 Research Conducted by Empirical Education Inc. Executive Summary Background. Cognitive demands on student knowledge
Emerald Coast Career Institute N
 Okaloosa County School District Emerald Coast Career Institute N 2017-18 School Improvement Plan Okaloosa - 0791 - - 2017-18 SIP 500 ALABAMA ST, Crestview, FL 32536 [ no web address on file ] School Demographics
NCEO Technical Report 27
 Home About Publications Special Topics Presentations State Policies Accommodations Bibliography Teleconferences Tools Related Sites Interpreting Trends in the Performance of Special Education Students
Shelters Elementary School
 Shelters Elementary School August 2, 24 Dear Parents and Community Members: We are pleased to present you with the (AER) which provides key information on the 23-24 educational progress for the Shelters
World s Best Workforce Plan
 2017-18 World s Best Workforce Plan District or Charter Name: PiM Arts High School, 4110-07 Contact Person Name and Position Matt McFarlane, Executive Director In accordance with Minnesota Statutes, section
Student Mobility Rates in Massachusetts Public Schools
 Student Mobility Rates in Massachusetts Public Schools Introduction The Massachusetts Department of Elementary and Secondary Education (ESE) calculates and reports mobility rates as part of its overall
Local Control and Accountability Plan and Annual Update Template
 Page 1 of 69 Introduction: LEA: Monroe Middle School Contact (Name, Title, Email, Phone Number): Dawnel Sonntag, Principal, dsonntag@campbellusd.org, (408) 341-7026 LCAP Year: 2015-2016 Local Control and
Wisconsin 4 th Grade Reading Results on the 2015 National Assessment of Educational Progress (NAEP)
") Wisconsin 4 th Grade Reading Results on the 2015 National Assessment of Educational Progress (NAEP) Main takeaways from the 2015 NAEP 4 th grade reading exam: Wisconsin scores have been statistically flat
Wisconsin 4 th Grade Reading Results on the 2015 National Assessment of Educational Progress (NAEP) Main takeaways from the 2015 NAEP 4 th grade reading exam: Wisconsin scores have been statistically flat
Katy Independent School District Paetow High School Campus Improvement Plan
 Katy Independent School District 2017-2018 Campus Improvement Plan Generated by Plan4Learningcom 1 of 15 Table of Contents Comprehensive Needs Assessment 3 Demographics 3 Student Academic Achievement 4
SASKATCHEWAN MINISTRY OF ADVANCED EDUCATION
 SASKATCHEWAN MINISTRY OF ADVANCED EDUCATION Report March 2017 Report compiled by Insightrix Research Inc. 1 3223 Millar Ave. Saskatoon, Saskatchewan T: 1-866-888-5640 F: 1-306-384-5655 Table of Contents
John F. Kennedy Middle School
 John F. Kennedy Middle School CUPERTINO UNION SCHOOL DISTRICT Steven Hamm, Principal hamm_steven@cusdk8.org School Address: 821 Bubb Rd. Cupertino, CA 95014-4938 (408) 253-1525 CDS Code: 43-69419-6046890
Bethune-Cookman University
 Bethune-Cookman University The Independent Colleges and Universities of Florida Community College Articulation Manual 2012-2013 1 BETHUNE-COOKMAN UNIVERSITY ICUF ARTICULATION MANUAL GENERAL ADMISSION PROCEDURES
EAP. updates KHENG WAICHE. early proficiency programs coordinator
 EAP updates 2016 KHENG WAICHE early proficiency programs coordinator 2015 CAASPP EAP Testing ü 3.2 million students tested in grades 3-11. ü California tested the largest number of students in the Smarter
Dr. Russell Johnson Middle School
 Dr. Russell Johnson Middle Serving Grades Six through Eight 13603 Edwards Street Westminster, CA 92683 (714) 894-7244 www.jmswarriors.com Principal Heidi DeBritton Westminster High Academic Achievement,
Proficiency Illusion
 KINGSBURY RESEARCH CENTER Proficiency Illusion Deborah Adkins, MS 1 Partnering to Help All Kids Learn NWEA.org 503.624.1951 121 NW Everett St., Portland, OR 97209 Executive Summary At the heart of the
Governors and State Legislatures Plan to Reauthorize the Elementary and Secondary Education Act
 Governors and State Legislatures Plan to Reauthorize the Elementary and Secondary Education Act Summary In today s competitive global economy, our education system must prepare every student to be successful
Psychometric Research Brief Office of Shared Accountability
 August 2012 Psychometric Research Brief Office of Shared Accountability Linking Measures of Academic Progress in Mathematics and Maryland School Assessment in Mathematics Huafang Zhao, Ph.D. This brief
Dyer-Kelly Elementary 1
 San Juan Unified School Dyer-Kelly Elementary School 2008-2009 School Accountability Report Card Deborah Wegsteen, Principal School Address: 2236 Edison Ave. Sacramento, CA 95821-1607 916-566-2150 Dr.
learning collegiate assessment]
![learning collegiate assessment]](/thumbs/71/66063392.jpg "learning collegiate assessment]") [ collegiate learning assessment] INSTITUTIONAL REPORT 2005 2006 Kalamazoo College council for aid to education 215 lexington avenue floor 21 new york new york 10016-6023 p 212.217.0700 f 212.661.9766
[ collegiate learning assessment] INSTITUTIONAL REPORT 2005 2006 Kalamazoo College council for aid to education 215 lexington avenue floor 21 new york new york 10016-6023 p 212.217.0700 f 212.661.9766
OVERVIEW OF CURRICULUM-BASED MEASUREMENT AS A GENERAL OUTCOME MEASURE
 OVERVIEW OF CURRICULUM-BASED MEASUREMENT AS A GENERAL OUTCOME MEASURE Mark R. Shinn, Ph.D. Michelle M. Shinn, Ph.D. Formative Evaluation to Inform Teaching Summative Assessment: Culmination measure. Mastery
State Parental Involvement Plan
 A Toolkit for Title I Parental Involvement Section 3 Tools Page 41 Tool 3.1: State Parental Involvement Plan Description This tool serves as an example of one SEA s plan for supporting LEAs and schools
What Is The National Survey Of Student Engagement (NSSE)?
?") National Survey of Student Engagement (NSSE) 2000 Results for Montclair State University What Is The National Survey Of Student Engagement (NSSE)? US News and World Reports Best College Survey is due next
National Survey of Student Engagement (NSSE) 2000 Results for Montclair State University What Is The National Survey Of Student Engagement (NSSE)? US News and World Reports Best College Survey is due next
New Hanover County Schools Announce the Results for the READY Assessments and Report the Highest Graduation Rate to Date
 New Hanover County s Announce the 215-216 Results for the READY Assessments and Report the Highest Graduation Rate to Date The 215-216 results show that New Hanover County s students are progressing and
Biological Sciences, BS and BA
 Student Learning Outcomes Assessment Summary Biological Sciences, BS and BA College of Natural Science and Mathematics AY 2012/2013 and 2013/2014 1. Assessment information collected Submitted by: Diane
SLOAN-HENDRIX SCHOOL DISTRICT 2016 ANNUAL REPORT TO THE PUBLIC ADVANC-ED ACCREDITATION
 SLOAN-HENDRIX SCHOOL DISTRICT 2016 ANNUAL REPORT TO THE PUBLIC Preserving Yesterday, Excelling Today, Preparing for Tomorrow is the vision statement that summarizes the philosophies that have been the
RAISING ACHIEVEMENT BY RAISING STANDARDS. Presenter: Erin Jones Assistant Superintendent for Student Achievement, OSPI
 RAISING ACHIEVEMENT BY RAISING STANDARDS Presenter: Erin Jones Assistant Superintendent for Student Achievement, OSPI Agenda Introductions Definitions History of the work Strategies Next steps Debrief
Section V Reclassification of English Learners to Fluent English Proficient
 Section V Reclassification of English Learners to Fluent English Proficient Understanding Reclassification of English Learners to Fluent English Proficient Decision Guide: Reclassifying a Student from
Standardized Assessment & Data Overview December 21, 2015
 Standardized Assessment & Data Overview December 21, 2015 Peters Township School District, as a public school entity, will enable students to realize their potential to learn, live, lead and succeed. 2
Two-thirds of APS Schools Increase on State CCRPI Scores
 Contact: Latisha Gray Office: 404-802-2816 Cell: 414-688-1478 Latisha.Gray@atlanta.k12.ga.us FOR IMMEDIATE RELEASE November 2, 2017 Two-thirds of APS s Increase on State CCRPI Scores 56 schools improve
School Performance Plan Middle Schools
 SY 2012-2013 School Performance Plan Middle Schools 734 Middle ALternative Program @ Lombard, Principal Roger Shaw (Interim), Executive Director, Network Facilitator PLEASE REFER TO THE SCHOOL PERFORMANCE
John F. Kennedy Junior High School
 John F. Kennedy Junior High 2010-2011 Accountability Report Card Jason Strickland, Principal Address: 1000 East Florinda Street Hanford, CA 93232 559.585.3850 Hanford Elementary Paul J. Terry, Superintendent
Graduate Division Annual Report Key Findings
 Graduate Division 2010 2011 Annual Report Key Findings Trends in Admissions and Enrollment 1 Size, selectivity, yield UCLA s graduate programs are increasingly attractive and selective. Between Fall 2001
The Talent Development High School Model Context, Components, and Initial Impacts on Ninth-Grade Students Engagement and Performance
 The Talent Development High School Model Context, Components, and Initial Impacts on Ninth-Grade Students Engagement and Performance James J. Kemple, Corinne M. Herlihy Executive Summary June 2004 In many
Arthur E. Wright Middle School
 Las Virgenes Unified School District A.E. Wright Middle School 4029 N. Las Virgenes Road Calabasas, CA 91302 (818) 880-4614 www.lvusd.org Sixth through Eighth Grades Principal Steven Rosentsweig Assistant
Dr. Russell Johnson Middle School
 Serving Grades Six through Eight 13603 Edwards Street Westminster, CA 92683 (714) 894-7244 www.jmswarriors.com Principal Heidi DeBritton Vice Principal Robert McKane Westminster School High Academic Achievement
The Impacts of Regular Upward Bound on Postsecondary Outcomes 7-9 Years After Scheduled High School Graduation
 Contract No.: EA97030001 MPR Reference No.: 6130-800 The Impacts of Regular Upward Bound on Postsecondary Outcomes 7-9 Years After Scheduled High School Graduation Final Report January 2009 Neil S. Seftor
Institution-Set Standards: CTE Job Placement Resources. February 17, 2016 Danielle Pearson, Institutional Research
 Institution-Set Standards: CTE Job Placement Resources February 17, 2016 Danielle Pearson, Institutional Research Standard 1.B.3 states: The institution establishes institution-set standards for student
DAS-REMI District Accountability System Reporting, Evaluating, and Monitoring Instrument for the P2E2020SBP
 DAS-REMI District Accountability System Reporting, Evaluating, and Monitoring Instrument for the P2E2020SBP Prepared by the Board Accountability Committee DAS REMI 2015-16 1 Board Approved: September 2,
Practices Worthy of Attention Step Up to High School Chicago Public Schools Chicago, Illinois
 Step Up to High School Chicago Public Schools Chicago, Illinois Summary of the Practice. Step Up to High School is a four-week transitional summer program for incoming ninth-graders in Chicago Public Schools.
CSU East Bay EAP Breakfast. CSU Office of the Chancellor Student Academic Services Lourdes Kulju Academic Outreach and Early Assessment
 CSU East Bay EAP Breakfast CSU Office of the Chancellor Student Academic Services Lourdes Kulju Academic Outreach and Early Assessment 2015 CAASPP EAP Testing 3.2 million students tested in grades 3-11.
ABILITY SORTING AND THE IMPORTANCE OF COLLEGE QUALITY TO STUDENT ACHIEVEMENT: EVIDENCE FROM COMMUNITY COLLEGES
 ABILITY SORTING AND THE IMPORTANCE OF COLLEGE QUALITY TO STUDENT ACHIEVEMENT: EVIDENCE FROM COMMUNITY COLLEGES Kevin Stange Ford School of Public Policy University of Michigan Ann Arbor, MI 48109-3091
2012 ACT RESULTS BACKGROUND
 Report from the Office of Student Assessment 31 November 29, 2012 2012 ACT RESULTS AUTHOR: Douglas G. Wren, Ed.D., Assessment Specialist Department of Educational Leadership and Assessment OTHER CONTACT
Chapters 1-5 Cumulative Assessment AP Statistics November 2008 Gillespie, Block 4
 Chapters 1-5 Cumulative Assessment AP Statistics Name: November 2008 Gillespie, Block 4 Part I: Multiple Choice This portion of the test will determine 60% of your overall test grade. Each question is
Rules and Discretion in the Evaluation of Students and Schools: The Case of the New York Regents Examinations *
 Rules and Discretion in the Evaluation of Students and Schools: The Case of the New York Regents Examinations * Thomas S. Dee University of Virginia and NBER dee@virginia.edu Brian A. Jacob University
UPPER ARLINGTON SCHOOLS
 UPPER ARLINGTON SCHOOLS SERVE LEAD SUCCEED CHALLENGE AND SUPPORT EVERY STUDENT, EVERY STEP OF THE WAY. 2014-2015 www.uaschools.org 1950 North Mallway Drive Upper Arlington, Ohio 43221 (614) 487-5000 Introduction
Implementing an Early Warning Intervention and Monitoring System to Keep Students On Track in the Middle Grades and High School
 Implementing an Early Warning Intervention and Monitoring System to Keep Students On Track in the Middle Grades and High School National High School Center Facilitator: Joseph Harris, Ph.D. Presenters:
What Does ESSA Mean for English Learners and #ESSAforELs
 What Does ESSA Mean for English Learners and Accountability? @EdPolicyAIR #ESSAforELs English Learner Reclassification Joseph P. Robinson-Cimpian, Ph.D. Associate Professor and College of Education Distinguished
Iva Meairs Elementary School
 Serving Grades Kindergarten through Five 8441 Trask Avenue Garden Grove, CA 92844 (714) 638-0450 Principal Tricia Urbaniec Westminster School High Academic Achievement for All Students www.wsd.k12.ca.us
Superintendent s 100 Day Entry Plan Review
 Superintendent s 100 Day Entry Plan Review January 10, 2012 Thelma Meléndez de Santa Ana, Ph.D. Superintendent 2 The 100-Day Entry Plan Roll-Out What We ll Cover Reflections & Observations on Our Aha!
Dr. Brent Benda and Ms. Nell Smith
 School Case Studies Dr. Brent Benda and Ms. Nell Smith Bureau of Legislative Research Case Study Objectives Examine eschools s that have aeachieved ed sg significant improvement and schools that have been
Exams: Accommodations Guidelines. English Language Learners
 PSSA Accommodations Guidelines for English Language Learners (ELLs) [Arlen: Please format this page like the cover page for the PSSA Accommodations Guidelines for Students PSSA with IEPs and Students with
International: Three-Year School Improvement Plan to September 2016 (Year 2)
") International: Three-Year School Improvement Plan 2016-17 to 2017-18 September 2016 (Year 2) Bellevue School District Mission: To provide all students with an exemplary college preparatory education so
International: Three-Year School Improvement Plan 2016-17 to 2017-18 September 2016 (Year 2) Bellevue School District Mission: To provide all students with an exemplary college preparatory education so
U VA THE CHANGING FACE OF UVA STUDENTS: SSESSMENT. About The Study
 About The Study U VA SSESSMENT In 6, the University of Virginia Office of Institutional Assessment and Studies undertook a study to describe how first-year students have changed over the past four decades.